Advances in Specificity for Ubiquitination Site Identification: From Computational Predictions to Experimental Validation
The precise identification of ubiquitination sites is crucial for understanding cellular regulation, disease mechanisms, and developing targeted therapies.
Advances in Specificity for Ubiquitination Site Identification: From Computational Predictions to Experimental Validation
Abstract
The precise identification of ubiquitination sites is crucial for understanding cellular regulation, disease mechanisms, and developing targeted therapies. This article synthesizes current methodologies and emerging technologies aimed at improving the specificity of ubiquitination site mapping. We explore foundational concepts of the ubiquitin code and site-specific consequences, evaluate advanced computational tools like Ubigo-X that integrate deep learning with image-based features, and examine cutting-edge experimental techniques such as the BioE3 system for E3 ligase-specific substrate profiling. The content addresses critical challenges including low stoichiometry, linkage complexity, and PTM cross-talk, while providing a comparative analysis of prediction algorithms and validation strategies. This resource is tailored for researchers, scientists, and drug development professionals seeking to implement high-specificity approaches in their ubiquitination studies.
Decoding the Ubiquitin Landscape: Fundamental Principles and Specificity Challenges
Technical Support Center
Troubleshooting Guides & FAQs
This section addresses common experimental challenges in ubiquitination research, focusing on improving the specificity of ubiquitination site identification.
FAQ 1: How can I improve the specificity and coverage for mapping ubiquitination sites via mass spectrometry?
Answer: A major challenge in MS-based ubiquitinomics is the low abundance of ubiquitinated peptides and the need for highly specific enrichment. The UbiSite Approach directly addresses this.
- Core Technology: Utilize an antibody (UbiSite) that is highly specific for the C-terminal 13 amino acids of ubiquitin, which remain attached to modified lysine or protein N-terminal after LysC digestion [1].
- Key Advantage: This method avoids the need for tryptic digestion that leaves a bulky Gly-Gly remnant on lysines, instead leveraging the specificity of LysC. It allows for the comprehensive identification of both lysine and N-terminal ubiquitination sites with high confidence [1].
- Protocol Summary:
- Cell Lysis: Lyse cells in a denaturing buffer to preserve modifications and inactivate deubiquitinases (DUBs).
- Protein Digestion: Digest the proteome with the endoproteinase LysC.
- Peptide Enrichment: Enrich for ubiquitinated peptides using the UbiSite antibody.
- Secondary Digestion: Digest the enriched peptides with trypsin to prepare them for MS.
- LC-MS/MS Analysis: Analyze the peptides using high-accuracy mass spectrometry [1].
FAQ 2: My western blot signals for polyubiquitinated proteins are weak. What high-affinity tools can I use for detection?
Answer: Weak signals often result from low-affinity detection reagents or the transient nature of ubiquitination. Tandem Hybrid Ubiquitin Binding Domain (ThUBD)-based technologies offer a significant improvement.
- Recommended Solution: Use reagents based on Tandem Hybrid Ubiquitin Binding Domain (ThUBD). This engineered domain exhibits unbiased, high-affinity binding to all types of ubiquitin chains [2].
- Performance Data: In a 96-well plate format, ThUBD-coated plates demonstrated a 16-fold wider linear range for capturing polyubiquitinated proteins compared to older TUBE (Tandem Ubiquitin Binding Entity) technology [2]. The following table quantifies this performance:
Table 1: Comparison of Ubiquitin Capture Technologies
| Technology | Affinity for Ubiquitin Chains | Linkage Bias | Detection Sensitivity | Best Application |
|---|---|---|---|---|
| ThUBD-coated plates | High (nanomolar range) | Unbiased | 0.625 μg (16x more sensitive than TUBE) | High-throughput, global ubiquitination profiling [2] |
| TUBE-coated plates | Low-micromolar range | Biased towards specific chain types | 10 μg | General ubiquitination detection [2] |
| Standard Antibodies | Variable, often low | High (often linkage-specific) | Variable | Target-specific assays with confirmed specificity [2] |
- Troubleshooting Protocol for TUF-WB (ThUBD-based Ubiquitin Fractionation - Western Blot):
- Capture: Incubate your cell lysate with ThUBD-coated plates or ThUBD-conjugated beads.
- Wash: Use a stringent wash buffer (e.g., containing 0.1% SDS) to reduce non-specific binding.
- Elution: Elute the captured ubiquitinated proteins with a standard Laemmli buffer for western blotting.
- Detection: Proceed with standard western blot protocol using your target protein antibody [2].
FAQ 3: How can I specifically monitor K48- vs. K63-linked ubiquitination of my protein of interest in a high-throughput format?
Answer: Discriminating between ubiquitin chain linkages is crucial for understanding a protein's fate. Chain-specific TUBEs enable this in assay plates.
- Technology: Use linkage-specific TUBEs (e.g., K48-TUBE or K63-TUBE) coated on high-density 96-well plates [3].
- Application Example: This method has been successfully used to differentiate the ubiquitination of RIPK2:
- Experimental Workflow:
- Treatment & Lysis: Treat cells (e.g., THP-1) with your stimulus or inhibitor. Lyse cells with a buffer that preserves polyubiquitination.
- Incubation: Add lysate to the chain-specific TUBE-coated plate.
- Capture & Wash: Allow endogenous ubiquitinated proteins to bind, then wash away unbound material.
- Detection: Detect your specific target protein using a tagged or enzyme-linked antibody in the plate, enabling quantitative, high-throughput readout [3].
The Scientist's Toolkit: Key Research Reagent Solutions
Table 2: Essential Reagents for Advanced Ubiquitination Research
| Research Reagent | Core Function | Key Application in Ubiquitination Research |
|---|---|---|
| UbiSite Antibody [1] | Highly specific immuno-enrichment of ubiquitinated peptides post-LysC digestion. | Comprehensive, site-specific mapping of lysine and N-terminal ubiquitination for mass spectrometry. |
| ThUBD (Tandem Hybrid Ubiquitin Binding Domain) [2] | Unbiased, high-affinity capture of all ubiquitin chain linkages. | Sensitive detection and quantification of global ubiquitination signals in western blot (TUF-WB) or plate-based assays. |
| Chain-Specific TUBEs (K48, K63) [3] | Selective enrichment of proteins modified with a specific ubiquitin chain topology. | Investigating the functional outcome of ubiquitination (e.g., degradation vs. signaling) in high-throughput screening formats. |
| Reconstituted Ubiquitination System (E1, E2, E3, Ub) [4] | Provides the core enzymatic machinery for in vitro ubiquitination assays. | Mechanistic studies of E3 ligase function, inhibitor screening, and validation of direct substrate ubiquitination. |
| PROTACs [5] [3] | Heterobifunctional molecules that recruit E3 ligases to target specific proteins for degradation. | A key therapeutic modality that exploits the ubiquitin-proteasome system for targeted protein degradation. |
Experimental Pathways & Workflows
The following diagrams illustrate key signaling pathways and experimental workflows in ubiquitination research.
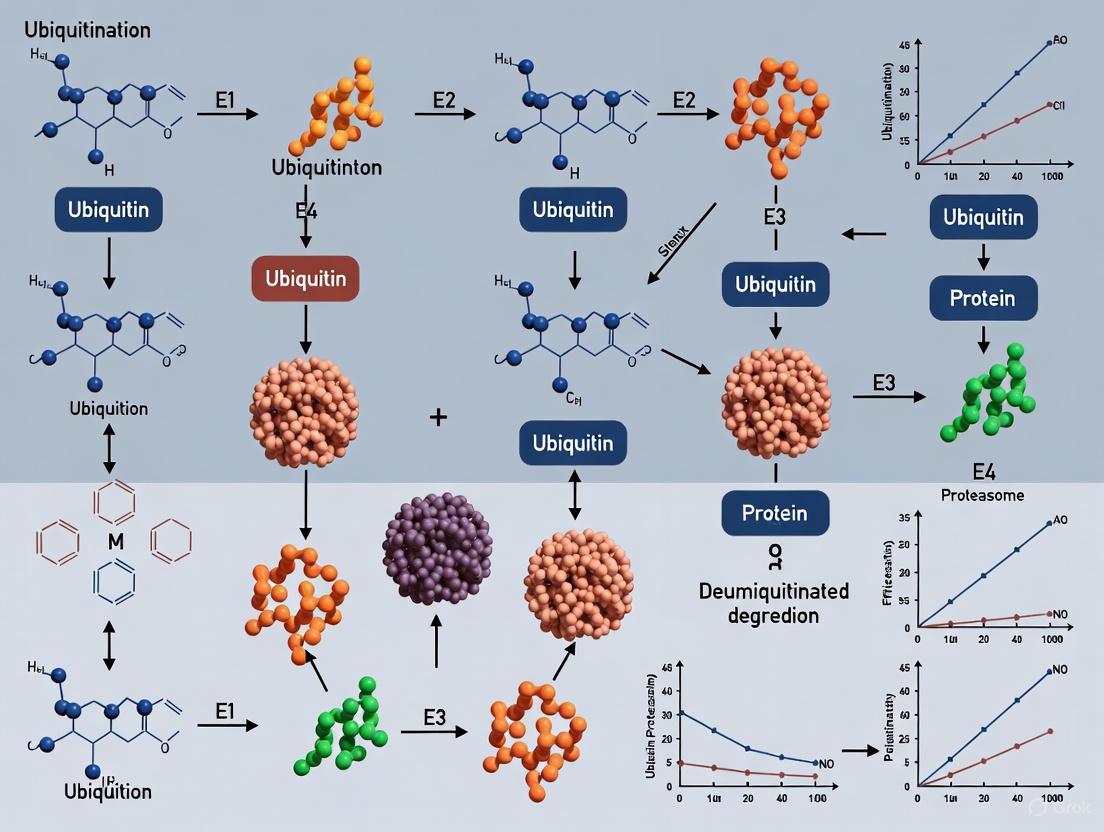
Ubiquitin Cascade and Functional Outcomes
UbiSite MS Workflow for Ubiquitination Site Mapping
TUBE-based Assay for Linkage-specific Ubiquitination
Core Concepts: The Ubiquitin Code
Ubiquitination is a post-translational modification where a small protein, ubiquitin, is covalently attached to substrate proteins. This process is mediated by a cascade of E1 (activating), E2 (conjugating), and E3 (ligating) enzymes [6] [7]. The E3 ligases are particularly crucial for conferring substrate specificity [6].
The functional outcome of ubiquitination is determined by the site of modification on the substrate and the type of ubiquitin chain formed. Ubiquitin itself contains seven lysine residues (K6, K11, K27, K29, K33, K48, K63) and an N-terminal methionine (M1), all of which can serve as linkage points for polyubiquitin chains. This creates a "ubiquitin code" that is interpreted by cellular machinery [6] [7].
Table: Ubiquitin Linkage Types and Their Primary Functions
| Linkage Type | Chain Length | Primary Functional Consequence |
|---|---|---|
| K48 | Polymeric | Canonical signal for proteasomal degradation [8] [9]. |
| K63 | Polymeric | Innate immunity, inflammation, DNA repair, endocytic trafficking [8] [7] [9]. |
| M1 (Linear) | Polymeric | Cell death, immune signaling (NF-κB activation), protein quality control [7] [9]. |
| K6 | Polymeric | Mitophagy, antiviral responses, DNA repair [7] [9]. |
| K11 | Polymeric | Cell cycle regulation, proteasomal degradation [7] [9]. |
| K27 | Polymeric | DNA damage response, innate immunity [7] [9]. |
| K29 | Polymeric | Neurodegenerative disorders, Wnt signaling regulation [7] [9]. |
| Monoubiquitination | Monomer | Endocytosis, histone regulation, DNA damage responses [6] [9]. |
A key concept is site-specificity—the exact residue on a substrate that is ubiquitinated can dictate the molecule's fate. For example, ubiquitination at specific lysines can induce conformational changes or alter the protein's energy landscape, making it more susceptible to proteasomal degradation. In contrast, ubiquitination at other sites on the same protein may trigger non-degradative signaling roles [6].
Figure 1: The Ubiquitin Code Decision Tree. Different ubiquitin chain linkages direct substrate proteins toward proteasomal degradation or various non-degradative signaling functions. Some linkages, like K11, can signal for both fates [7] [9].
Troubleshooting Guides & FAQs
FAQ: Common Ubiquitination Research Challenges
Q1: My western blot for ubiquitinated proteins shows a high background smear. How can I improve the signal-to-noise ratio? A: A common cause is non-specific binding of ubiquitin antibodies. To address this:
- Use a high-affinity, specific enrichment tool like the Ubiquitin-Trap (ChromoTek) for immunoprecipitation prior to western blotting. This pulldown is designed for low-background isolation [9].
- Ensure your antibodies are specific and have been validated for the application. Many commercial ubiquitin antibodies are non-specific and bind artifacts [9].
- Treat cells with a proteasome inhibitor (e.g., MG-132, typically 5-25 µM for 1-2 hours) before harvesting. This prevents the rapid degradation of polyubiquitinated proteins, thereby enriching for them. Avoid overexposure to prevent cytotoxicity [9].
Q2: I have identified a potential ubiquitination site via mass spectrometry. How can I validate that it is functionally important for degradation? A: Functional validation requires a combination of biochemical and cellular assays.
- Mutation Analysis: Mutate the specific lysine residue(s) to arginine (K→R). If the mutant protein shows increased stability (longer half-life) compared to the wild-type, it suggests the site is critical for degradation-targeting ubiquitination [10].
- Biophysical Assays: Consider that ubiquitination can cause site-specific thermodynamic destabilization. Techniques like NMR or differential scanning calorimetry can probe whether ubiquitination at your site of interest induces partial unfolding, a signal recognized by the proteasome [6].
- Pulse-Chase Analysis: Perform a pulse-chase experiment to directly measure the half-life of your wild-type and K→R mutant proteins.
Q3: How can I determine which E3 ligase is responsible for ubiquitinating my protein of interest at a specific site? A: Identifying the responsible E3 ligase is complex due to the large number of E3s and potential redundancy.
- Bioinformatic Analysis: Start by analyzing the sequence around the ubiquitination site. Some E3s recognize specific motifs or "degrons," and intrinsic disorder in the region can be a facilitating factor [11].
- Functional Screening: Use siRNA or CRISPR-based screens to knock down/out candidate E3 ligases and observe the effect on your substrate's ubiquitination status or stability.
- Biochemical Interaction Studies: Perform co-immunoprecipitation to identify E3 ligases that physically interact with your substrate. Follow up with in vitro ubiquitination assays using purified components to confirm activity [6].
Q4: I suspect non-degradative ubiquitination is regulating my protein's activity. How can I investigate this? A: Focus on linkages and readouts unrelated to protein half-life.
- Linkage-Specific Tools: Use linkage-specific ubiquitin antibodies (e.g., anti-K63, anti-M1) in pulldown or western blot experiments to detect chains associated with non-degradative functions [8] [9].
- Functional Assays: Look for ubiquitination-dependent changes in your protein's activity, such as altered kinase activity, changed interaction partners in co-IP experiments, or subcellular relocalization [6] [7].
- Non-Hydrolyzable Mutants: Express ubiquitin mutants that can only form specific chain types (e.g., K63-only) in your cells and assess the impact on your protein's signaling function [7].
Systematic Troubleshooting for Failed Ubiquitination Experiments
When an experiment fails, a systematic approach is critical [12].
- Repeat the Experiment: Rule out simple human error or a single equipment malfunction by repeating the procedure [12].
- Verify the Result: Revisit the scientific literature. Is your negative result biologically plausible, or does it strongly indicate a technical failure? [12]
- Check Controls: Ensure you have included the proper controls.
- Positive Control: A known ubiquitinated substrate to confirm your detection method is working.
- Negative Control: A sample without the E3 ligase or with a catalytically dead E3 mutant [12].
- Inspect Reagents and Equipment:
- Confirm reagents (enzymes, antibodies, cell lines) have been stored correctly and have not expired [12].
- Check that equipment (mass spectrometers, centrifuges) is properly calibrated and functioning.
- Change One Variable at a Time: If the problem persists, methodically test one potential variable at a time [12]. Common variables include:
- Ubiquitination Assay: E1/E2/E3 enzyme concentrations, reaction time/temperature, ATP concentration.
- Cell-Based Assay: Proteasome inhibitor concentration and treatment duration, transfection efficiency, cell lysis conditions (including deubiquitinase inhibitors).
- Document Everything: Meticulously record all steps, conditions, and observations in a lab notebook. This is essential for identifying patterns and solving complex problems [12].
Experimental Protocols & Workflows
Protocol 1: Identifying Ubiquitination Sites by Mass Spectrometry
This is a robust method for the direct, site-specific identification of ubiquitination.
Workflow Overview:
- Enrich Ubiquitinated Proteins: To overcome the low stoichiometry of ubiquitination, enrich modified proteins from cell or tissue lysates. This can be done using:
- Ubiquitin-Trap Immunoprecipitation: Use agarose or magnetic beads coupled with a high-affinity anti-ubiquitin nanobody (e.g., ChromoTek Ubiquitin-Trap) [9].
- Tandem Ubiquitin-Binding Entities (TUBEs): Use other high-affinity ubiquitin-binding modules.
- Cell Treatment: Pre-treat cells with a proteasome inhibitor (MG-132) to stabilize polyubiquitinated proteins [9].
- Digest Proteins: Digest the enriched proteins into peptides using a specific protease like trypsin or Glu-C [11]. A signature di-glycine remnant (Gly-Gly, +114.1 Da) remains on the modified lysine after tryptic digestion, which serves as a mass tag.
- Liquid Chromatography-Mass Spectrometry (LC-MS/MS): Separate the peptides by liquid chromatography and analyze them by tandem mass spectrometry. The mass spectrometer will detect the +114.1 Da mass shift on lysine residues and fragment the peptides to determine their sequence and the exact site of modification [11].
- Data Analysis: Use bioinformatic tools (e.g., SEQUEST, PeptideProphet) to process the spectral data and identify peptides with high confidence [11].
Figure 2: Ubiquitination Site Identification by MS. Workflow for the enrichment and mass spectrometry-based identification of ubiquitination sites, highlighting key steps like enrichment and bioinformatic analysis [11] [9].
Protocol 2: Validating Ubiquitination Site Functionality
After identifying a potential site, follow this protocol to confirm its functional role.
Workflow Overview:
- Site-Directed Mutagenesis: Generate a mutant construct of your protein where the target lysine (K) is replaced by arginine (R). Arginine is a conservative substitution that maintains a positive charge but cannot be ubiquitinated [10].
- Express Wild-Type and Mutant Proteins: Transfect cells with constructs for the wild-type (WT) and K→R mutant protein.
- Assess Ubiquitination Status:
- Immunoprecipitation and Western Blot: Immunoprecipitate your protein and probe for ubiquitin. A significant reduction in ubiquitination signal in the K→R mutant compared to the WT indicates the specific site is a major target for modification [10].
- Determine Functional Consequence:
- For Degradative Ubiquitination: Perform a cycloheximide chase or pulse-chase experiment to measure protein half-life. Stabilization of the K→R mutant suggests the site is used for degradation [6].
- For Non-Degradative Ubiquitination: Assess the functional output of the pathway (e.g., kinase activity, reporter gene assay, protein-protein interactions). Loss of function in the K→R mutant implicates ubiquitination at that site in the signaling process [7].
The Scientist's Toolkit: Key Reagents & Materials
Table: Essential Reagents for Ubiquitination Research
| Reagent / Tool | Function / Application | Key Considerations |
|---|---|---|
| MG-132 (Proteasome Inhibitor) | Stabilizes polyubiquitinated proteins by blocking their degradation by the proteasome, allowing for enrichment and detection [9]. | Use at optimized concentrations (e.g., 5-25 µM); overexposure is cytotoxic [9]. |
| Ubiquitin-Trap (Agarose/Magnetic) | High-affinity nanobody-based resin for immunoprecipitating monomeric ubiquitin, ubiquitin chains, and ubiquitinylated proteins from cell lysates with low background [9]. | Not linkage-specific. Binding capacity can vary due to heterogeneous chain lengths [9]. |
| Linkage-Specific Ubiquitin Antibodies | Western blot detection or validation of specific polyubiquitin chain topologies (e.g., K48, K63) [9]. | Essential for differentiating between degradative and non-degradative ubiquitin signals. Quality and specificity vary by vendor. |
| UbPred Software | Bioinformatics tool for in silico prediction of ubiquitination sites from protein sequence [11]. | A random forest-based predictor; useful for prioritizing lysines for experimental validation [11]. |
| E1, E2, and E3 Enzymes | For in vitro ubiquitination assays to reconstitute the ubiquitination cascade and study specific enzyme-substrate relationships [6]. | Requires purification of active enzyme components. E3 ligases determine substrate specificity [6]. |
| K→R Mutant Constructs | Validating the functional importance of a specific ubiquitination site by preventing modification at that residue [10]. | A conservative mutation; multiple sites may need to be mutated if there is redundancy [10]. |
Frequently Asked Questions (FAQs)
FAQ 1: Low Stoichiometry and Detection Sensitivity
Q: Why is it so difficult to detect ubiquitination sites in my experiments, even when I know my protein of interest is ubiquitinated?
A: The primary reason is the characteristically low stoichiometry of ubiquitination. This means that at any given moment, only a very small fraction of a specific protein substrate is ubiquitinated. This low abundance is further compounded by the dynamic and rapid turnover of the modification, as ubiquitinated proteins are often quickly degraded by the proteasome or deubiquitinated [13]. The median ubiquitination site occupancy is three orders of magnitude lower than that of phosphorylation, making it a challenge for detection methods without prior enrichment [14].
- Recommended Solution: Implement a robust enrichment strategy prior to mass spectrometry analysis. The following table compares the most common methods.
| Method | Principle | Advantages | Disadvantages |
|---|---|---|---|
| Ubiquitin Remnant Immunoaffinity Enrichment [15] | Uses antibodies (e.g., K-ε-GG antibody) to enrich for tryptic peptides containing the di-glycine remnant. | - Excellent for site identification- Compatible with quantitative MS (SILAC, TMT) [16] | - Cannot distinguish linkage types- May miss peptides due to incomplete digestion |
| Tandem Ubiquitin-Binding Entities (TUBEs) [15] | Uses engineered high-affinity ubiquitin-binding domains to purify ubiquitinated proteins. | - Protects ubiquitin chains from DUBs- Captures proteins with diverse chain linkages | - Does not provide direct site information without downstream MS |
| Affinity-Tagged Ubiquitin (e.g., His, Strep) [15] | Cells are engineered to express tagged ubiquitin; ubiquitinated proteins are purified via the tag. | - Powerful for proteome-wide profiling | - Potential for artifacts from tag overexpression- Not suitable for clinical or tissue samples |
FAQ 2: Dynamic Regulation and Quantitative Measurement
Q: How can I accurately measure the changes in ubiquitination of my substrate under different conditions (e.g., drug treatment, pathway activation)?
A: The dynamic nature of ubiquitination, controlled by the opposing actions of E3 ligases and deubiquitinases (DUBs), means that steady-state levels provide an incomplete picture [17]. To understand flux through a ubiquitin-driven pathway, you need quantitative methods that can capture kinetics and stoichiometry [16].
- Recommended Solution: Combine ubiquitin enrichment with quantitative mass spectrometry techniques.
- Stable Isotope Labeling with Amino acids in Cell Culture (SILAC): Allows for precise relative quantification between different cellular states (e.g., control vs. E3 ligase inhibited) [16] [15].
- Tandem Mass Tagging (TMT): Enables multiplexing of up to 10-18 samples simultaneously, ideal for time-course experiments or dose-response studies [16].
- Critical Consideration: When using TMT, an LC-MS3 method is highly recommended to overcome the issue of "signal compression" and ensure accurate quantification [16].
FAQ 3: Structural Diversity and Linkage Specification
Q: My target protein appears to be polyubiquitinated. How can I determine the linkage type of the chain and its functional consequence?
A: Ubiquitin chains can be formed through different lysine residues (K6, K11, K27, K29, K33, K48, K63) or the N-terminus (M1), each encoding distinct functional outcomes [18] [19]. K48-linked chains typically target proteins for proteasomal degradation, while K63-linked chains are often involved in non-proteolytic signaling [18] [17]. This structural diversity requires specialized tools for characterization.
- Recommended Solution:
- Linkage-Specific Antibodies: Use well-validated antibodies for immunoblotting to identify common chain types (e.g., K48 or K63)[ccitation:6].
- Advanced Mass Spectrometry: Employ specialized MS workflows that preserve the intact ubiquitin chain during analysis. Techniques like "top-down" or "middle-down" MS can help identify polyubiquitin chains and their linkage types directly [18] [15].
- Ubiquitin Mutants: Express ubiquitin mutants where all lysines except one are mutated to arginine (e.g., Ub-K48-only). If this mutant rescues the ubiquitination signal, it suggests the chain is primarily K48-linked.
Troubleshooting Guides
Problem: Inconsistent or No Detection of Ubiquitination
| Symptom | Possible Cause | Solution |
|---|---|---|
| High background in western blot; non-specific bands | Antibody cross-reactivity or poor sample quality. | - Pre-clear lysate with protein A/G beads.- Include DUB inhibitors (e.g., N-ethylmaleimide) in lysis buffer to prevent chain disassembly [15]. |
| Signal is lost upon lysine mutation | The mutated lysine is a key ubiquitination site. | - Confirm by identifying the site via MS/diGlycine remnant enrichment.- Be aware that mutation may disrupt E3 binding rather than the site itself [13]. |
| Ubiquitination is detected in vitro but not in cells | The E3 ligase is not present or active in the cellular context; or the site is masked by other PTMs. | - Validate E3-substrate interaction in cells (e.g., co-IP).- Check for phosphorylation or acetylation that may regulate E3 recognition [16]. |
Problem: Different Ubiquitin Linkages
| Symptom | Possible Cause | Solution |
|---|---|---|
| Ubiquitination does not lead to protein degradation | The chain may be a non-degradative type (e.g., K63, monoUb). | - Use linkage-specific antibodies to characterize the chain topology.- Inhibit the proteasome (e.g., with MG132); if the protein does not stabilize, the ubiquitination is likely non-degradative [17]. |
| A single protein has multiple functional outcomes from ubiquitination | The protein is modified by different chain types under different conditions. | - Perform immunofluorescence to see if different ubiquitin signals localize to different cellular compartments.- Use TUBEs to enrich all ubiquitinated forms, then probe for specific linkages [15]. |
The Scientist's Toolkit: Essential Research Reagents
The following table lists key reagents used in modern ubiquitination research to address the core challenges.
| Research Reagent | Function and Utility |
|---|---|
| K-ε-GG Antibody [15] [13] | The cornerstone of ubiquitin remnant profiling; enables immunoenrichment of tryptic peptides containing the di-glycine signature for mass spectrometry. |
| Proteasome Inhibitors (MG132, Bortezomib) [14] | Block the degradation of ubiquitinated proteins, thereby increasing their intracellular abundance and facilitating detection. |
| DUB Inhibitors (NEM, PR-619) [15] | Added to lysis buffers to prevent the removal of ubiquitin chains by deubiquitinating enzymes during sample preparation, preserving the native ubiquitination state. |
| Tandem Ubiquitin-Binding Entities (TUBEs) [15] | High-affinity tools for purifying ubiquitinated proteins from complex lysates while offering protection from DUBs. |
| Linkage-Specific Ubiquitin Antibodies [15] | Allow for the detection and immunoprecipitation of specific polyubiquitin chain types (e.g., K48, K63) via western blot or immunofluorescence. |
| Affinity-Tagged Ubiquitin (His, HA, Strep) [15] | Enables purification of ubiquitinated proteins from cellular overexpression systems for downstream analysis. |
| Activity-Based Probes for DUBs/E1s [15] | Chemical tools that covalently label active deubiquitinases or E1 enzymes, useful for profiling their activity in cell lysates. |
Frequently Asked Questions
FAQ: What are the main types of E3 ubiquitin ligases and their mechanisms? E3 ubiquitin ligases are primarily classified into four types based on their structure and mechanism. The major types are RING, HECT, RBR, and U-box. RING and U-box types facilitate the direct transfer of ubiquitin from the E2 enzyme to the substrate. In contrast, HECT and RBR types form a reactive thioester intermediate with ubiquitin before transferring it to the target protein [20].
FAQ: My experiments are failing to identify all ubiquitination sites on my protein of interest. How can I improve the coverage? A common challenge is the low abundance of ubiquitinated peptides. Traditional protein-level immunoprecipitation (IP) followed by mass spectrometry (AP-MS) may miss many sites. A more sensitive method is peptide-level immunoaffinity enrichment using antibodies specific for the di-glycine (K-ε-GG) remnant left on ubiquitinated lysines after tryptic digestion. This method has been shown to consistently yield a greater than fourfold increase in the abundance of identified ubiquitinated peptides compared to AP-MS approaches [21].
FAQ: Are there high-throughput methods to match E3 ligases with their target substrates? Yes, recent advances have led to scalable methods. One such framework is COMET (Combinatorial Mapping of E3 Targets), which enables testing of the role of many E3s in degrading many candidate substrates within a single experiment. This approach has been successfully applied to screen thousands of E3-substrate combinations, revealing complex interaction networks that are often not one-to-one relationships [22].
FAQ: What experimental options exist for targeting a protein of interest (POI) for degradation using E3 ligases? You can utilize biodegraders (also known as bioPROTACs). These are fusion proteins consisting of an intracellular protein binder (like a single-domain antibody) specific to your POI, linked to a functional E3 ligase. A detailed protocol exists for screening libraries of E3 ligases to identify those that function effectively in this biodegrader configuration, directly monitoring POI degradation via flow cytometry if the POI is fluorescently tagged [23].
Troubleshooting Guides
Issue: Low Yield in Ubiquitination Site Mapping
Problem: When mapping ubiquitination sites on a specific protein, you identify only a few sites despite biochemical evidence of heavy ubiquitination.
Solution:
- Switch to Peptide-Level Enrichment: Move from protein-level immunoprecipitation (IP) to K-ε-GG peptide-level immunoaffinity enrichment [21].
- Stabilize Ubiquitinated Proteins: Treat cells with proteasomal inhibitors (e.g., 10 μM MG132) for several hours before lysis to prevent the degradation of ubiquitinated proteins [21].
- Optimize Input Material: Use sufficient starting material (e.g., 1-10 mg of total protein) to ensure detection of low-abundance ubiquitinated peptides [21].
Experimental Workflow: K-ε-GG Peptide Immunoaffinity Enrichment
Issue: Identifying Which E3 Ligase Targets Your Substrate
Problem: You have a substrate protein but do not know which E3 ligase is responsible for its ubiquitination.
Solution:
- Employ a COMET-like Screening Approach: If resources allow, implement a high-throughput screen where your substrate is tested against a library of hundreds of E3 ligases to find functional pairs [22].
- Utilize a Biodegrader Screening Protocol: Use a established cell-based screening assay. This involves creating a stable cell line expressing your POI fused to a fluorescent tag (e.g., GFP) and then co-transfecting with a library of potential E3 ligases fused to a POI-binding protein. Degradation is quantitatively measured by a reduction in fluorescence via flow cytometry [23].
Experimental Workflow: E3 Ligase Biodegrader Screen
Issue: Poor Predictive Models for Ubiquitination Sites
Problem: Computational predictions of ubiquitination sites on your protein are unreliable, leading to inefficient experimental design.
Solution:
- Incorporate Machine Learning with Optimized Hyperparameters: Use prediction tools that leverage machine learning methods (like SVM or KNN) where grid search has been employed to optimize hyperparameters. This can significantly improve prediction accuracy [24].
- Utilize Physicochemical Properties (PCP): Ensure the predictive model is trained on datasets that include relevant physicochemical properties of amino acids, which can enhance model performance [24].
Quantitative Data on Ubiquitination Site Mapping
Table 1: Comparison of Ubiquitination Site Mapping Methods
| Method | Key Feature | Relative Abundance of Identified K-ε-GG Peptides (vs. AP-MS) | Key Advantage |
|---|---|---|---|
| Protein-Level AP-MS | Immunoprecipitation of protein of interest, then MS | 1x (Baseline) | Context of intact protein complex |
| K-ε-GG Peptide Immunoaffinity Enrichment | Antibody enrichment of modified peptides after digestion | >4x higher [21] | Greater sensitivity and more comprehensive site coverage |
Table 2: Machine Learning Performance for Ubiquitination Site Prediction
| Machine Learning Method | Key Tuning Strategy | Outcome & Relative Improvement |
|---|---|---|
| Support Vector Machine (SVM) | Grid Search with hyperparameter optimization | Top overall performer based on average AUC across datasets [24] |
| k-Nearest Neighbors (KNN) | Grid Search with hyperparameter optimization | Ranked as number two performer [24] |
| LASSO | Grid Search with hyperparameter optimization | Showed maximum AUC improvement of 47% on one dataset [24] |
The Scientist's Toolkit: Key Research Reagents
Table 3: Essential Reagents for E3 and Ubiquitination Research
| Reagent | Function | Example Application |
|---|---|---|
| Anti-K-ε-GG Antibody | Immunoaffinity enrichment of ubiquitinated peptides | Peptide-level ubiquitination site mapping by MS [21] |
| Proteasome Inhibitors (e.g., MG132, Epoxomicin) | Stabilizes ubiquitinated proteins by blocking degradation | Enriching for ubiquitinated species in pull-downs and MS experiments [21] [23] |
| E3 Ligase Biodegrader Plasmids | Vectors for fusing E3 ligases to protein binders | Screening for E3s that degrade a specific POI [23] |
| FLAG-tag Antibodies | Detection and immunoprecipitation of tagged proteins | Validating expression and pull-down of transfected E3 biodegrader constructs [23] |
| Intracellular Protein Binders (e.g., sdAbs, DARPins) | High-affinity binding to a POI for recruitment to E3 ligases | Constructing targeted biodegraders/PROTACs [23] |
Frequently Asked Questions (FAQs): The Polyubiquitin Code
1. What is the "ubiquitin code"? The "ubiquitin code" refers to the complex biological language created by the diverse ways a protein can be modified by ubiquitin. A target protein can be modified by a single ubiquitin (monoubiquitination) or by polyubiquitin chains. These chains can be formed through different linkage sites on ubiquitin itself, creating distinct structures that are recognized differently by cellular machinery, leading to different functional outcomes for the modified protein [25] [26] [27].
2. How many polyubiquitin linkage types are there, and what are their primary functions? There are at least eight known types of homotypic polyubiquitin chains, formed via one of the seven lysine residues (K6, K11, K27, K29, K33, K48, K63) or the N-terminal methionine (M1) of a ubiquitin molecule [28] [26]. The function is largely determined by the chain linkage, as summarized in the table below.
Table 1: Primary Functions of Homotypic Polyubiquitin Chain Linkages
| Linkage Type | Known Primary Functions |
|---|---|
| K48-linked | The canonical signal for targeting proteins to the 26S proteasome for degradation [3] [29]. |
| K63-linked | Regulates non-proteolytic processes such as signal transduction, endocytosis, protein trafficking, DNA repair, and inflammation [30] [3] [29]. |
| K11-linked | Involved in cell cycle regulation and has been implicated in endoplasmic reticulum (ER)-associated degradation [25]. |
| K29 & K33-linked | Implicated in promoting ER retention and degradation of proteins [25]. |
| K6, K27-linked | Less characterized, but associated with mitophagy (K6) and immune signaling [26]. |
| M1-linked (Linear) | Important in NF-κB inflammatory signaling pathways [27]. |
3. What analytical challenges are associated with studying specific ubiquitin linkages? The high complexity and dynamic nature of ubiquitination make its study difficult. Key challenges include [28] [3]:
- Low Abundance: Ubiquitinated proteins are often present in low stoichiometry within the cell.
- Chain Diversity: The presence of eight linkage types, which can also be mixed or branched (forked), creates a complex mixture that is hard to decipher.
- Rapid Turnover: Ubiquitination is a reversible and highly dynamic modification.
- Lack of Specific Tools: Many antibodies lack the sensitivity and linkage-specificity required to detect endogenous ubiquitination events reliably.
4. What are TUBEs and how do they improve ubiquitination analysis? TUBEs (Tandem Ubiquitin Binding Entities) are engineered, high-affinity reagents composed of multiple ubiquitin-associated (UBA) domains linked together. They are designed to bind polyubiquitin chains with nanomolar affinity, protecting them from deubiquitinating enzymes (DUBs) during cell lysis. Chain-selective TUBEs are further engineered to preferentially bind specific linkage types (e.g., K48 or K63), enabling the selective enrichment and study of specific chain topologies from complex biological samples [28] [3] [29].
5. What is the functional consequence of "forked" or branched ubiquitin chains? Forked chains, where a single ubiquitin molecule is modified at two different lysine residues, add another layer of complexity to the ubiquitin code. For example, chains simultaneously linked through K29 and K33 have been detected. It is proposed that these forked chains can be poor substrates for proteasome-associated deubiquitinating enzymes, potentially delaying protein degradation and adding a regulatory checkpoint [31].
Troubleshooting Guides
Problem: Inability to Detect Specific Endogenous Polyubiquitin Linkages
Potential Causes and Solutions:
Cause 1: Degradation of chains during sample preparation.
- Solution: Use TUBE-based reagents in your lysis buffer. Their high affinity for polyubiquitin chains sterically hinders and protects them from the activity of deubiquitinating enzymes (DUBs), preserving the native ubiquitination state [3].
Cause 2: Lack of specificity or sensitivity in detection methods.
- Solution 1: Employ chain-selective TUBEs in an affinity pulldown assay. These can be used in a microtiter plate format for higher throughput. After capturing the chains, the target protein (e.g., RIPK2) can be detected by immunoblotting, confirming both the identity of the modified protein and the linkage type captured [3].
- Solution 2: Utilize a middle-down mass spectrometry approach. This involves partial tryptic digestion of polyubiquitin chains under native conditions, which cleaves exclusively at arginine 74 (R74). This generates large ubiquitin fragments (1-74 residues) that retain the linkage information, which can then be analyzed by high-resolution MS/MS to determine both chain length and the specific lysine residue involved in the linkage [31].
Cause 3: The linkages of interest are not present on your target protein under the experimental conditions.
- Solution: Apply appropriate physiological or pharmacological stimuli. For instance, to study K63-linked ubiquitination, induce an inflammatory signal (e.g., with L18-MDP for RIPK2). To study K48-linked ubiquitination, use a PROTAC molecule designed to target your protein of interest for proteasomal degradation [3].
Problem: Determining the Functional Outcome of a Specific Linkage on Your Protein
Potential Causes and Solutions:
- Cause: Traditional genetic or pharmacological inhibition of E3 ligases or DUBs affects global ubiquitination and is too broad.
- Solution: Use engineered Deubiquitinases (enDUBs). This technique involves fusing a catalytic domain from a linkage-selective DUB (e.g., OTUD1 for K63, OTUD4 for K48) to a nanobody that targets a specific protein (e.g., GFP-nanobody for GFP/YFP-tagged substrates). When expressed in live cells, these enDUBs will selectively remove only the specific polyubiquitin chain type from your target protein, allowing you to study the functional consequence (e.g., on trafficking, stability, or function) without disrupting the global ubiquitin landscape [25].
Key Experimental Protocols
Protocol 1: Middle-Down Mass Spectrometry for Linkage and Length Analysis
This protocol is adapted from the strategy described by Kim et al. for characterizing polyubiquitin chain structure [31].
1. Sample Preparation:
- Isolate polyubiquitin chains or ubiquitinated proteins from cells or tissues. This can be done under native conditions using affinity chromatography (e.g., His-tag pull-down) followed by glycerol gradient centrifugation for further purification [31].
2. Limited Proteolytic Digestion:
- Resuspend the purified polyubiquitin sample in a 50 mM ammonium bicarbonate buffer (pH 7.8).
- Use a low trypsin-to-substrate ratio (e.g., 1:1 w/w) and digest at 37°C for a limited time. Under these optimized conditions, native folded ubiquitin is cleaved almost exclusively at the C-terminal side of arginine 74 (R74), leaving the globular domain and its modifications intact [31].
3. LC-MS/MS Analysis:
- Separate the digested products using reverse-phase liquid chromatography (e.g., C8 column).
- Analyze the eluents with a high-resolution mass spectrometer (e.g., LTQ-Orbitrap).
- The cleavage generates two key products for each ubiquitin in the chain: a large fragment (Ub^1-74^) and its ubiquitinated form with a diglycine tag (Ub^1-74^-GG). The molar ratio of Ub^1-74^ to Ub^1-74^-GG indicates the chain length (e.g., 1:1 for dimer, 1:2 for trimer).
- The lysine residue used for chain linkage within the Ub^1-74^-GG fragment is identified through MS/MS and MS/MS/MS sequencing [31].
Protocol 2: Using Chain-Selective TUBEs to Probe Linkage-Specific Ubiquitination
This protocol is based on the high-throughput screening assay used to study RIPK2 ubiquitination [3].
1. Cell Stimulation and Lysis:
- Treat cells (e.g., THP-1 monocytic cells) with the desired stimulus. To study K63-linkages, use an inflammatory inducer like L18-MDP (200-500 ng/ml for 30 min). To study K48-linkages, use a PROTAC targeting your protein of interest.
- Lyse cells in a buffer optimized to preserve polyubiquitination, supplemented with protease and deubiquitinase inhibitors.
2. Linkage-Specific Capture:
- Use a microtiter plate coated with chain-selective TUBEs (e.g., K48-TUBE, K63-TUBE, or Pan-TUBE).
- Incubate the clarified cell lysate with the TUBE-coated plate to allow specific binding of polyubiquitin chains.
- Wash thoroughly to remove non-specifically bound proteins.
3. Detection and Quantification:
- Detect the captured target protein by immunoblotting with an antibody against the protein of interest (e.g., anti-RIPK2).
- For higher throughput quantification, use an electrochemiluminescence-based immunoassay. Detect the captured protein with a biotinylated antibody against your target, followed by a streptavidin-based readout [3].
The Scientist's Toolkit: Essential Research Reagents
Table 2: Key Reagents for Analyzing the Polyubiquitin Code
| Research Tool | Function and Application |
|---|---|
| Chain-Selective TUBEs | Engineered affinity reagents for the enrichment and protection of specific polyubiquitin linkages (K48, K63, etc.) from complex cell lysates. Essential for pull-down and HTS assays [28] [3]. |
| Linkage-Specific Antibodies | Traditional immunodetection tools for specific ubiquitin linkages via Western blot or immunofluorescence. Variability in specificity and affinity can be a limitation [28]. |
| Engineered DUBs (enDUBs) | Live-cell tool for substrate-specific, linkage-selective removal of polyubiquitin chains. Used to decipher the functional role of a specific chain type on a single protein target [25]. |
| Mutant Ubiquitin Plasmids | Ubiquitin genes where specific lysine codons are mutated to arginine (e.g., K48R). Used to block the formation of a particular chain type and study the resulting phenotypic effects [3]. |
| PROTACs/Molecular Glues | Heterobifunctional small molecules that recruit an E3 ligase to a target protein, inducing its polyubiquitination and degradation. Useful for studying K48-linked ubiquitination and targeted protein degradation [3] [29]. |
| Activity-Based Probes | Chemical tools that covalently bind to active-site residues of enzymes like E1, E2, or DUBs, allowing for the profiling of their activity in complex proteomes [32]. |
Visualizing the Polyubiquitin Code and Cellular Outcomes
The following diagram summarizes how different polyubiquitin chain linkages are interpreted by the cell to drive distinct functional outcomes, forming the basis of the "ubiquitin code."
Cutting-Edge Technologies for High-Specificity Ubiquitination Mapping
Troubleshooting Guide: Addressing Common Ubigo-X Experimental Challenges
Problem 1: Model Performance is Inconsistent or Poor on New Datasets
- Issue: Your independent test results show significantly lower metrics (e.g., MCC, Accuracy) than those reported in the Ubigo-X study.
- Solution:
- Verify Data Preprocessing: Ensure your new dataset undergoes the same rigorous filtering steps as the Ubigo-X training data. The original study used CD-HIT and CD-HIT-2d with a 40% sequence identity threshold to reduce redundancy and homology bias [33] [34]. Inconsistent preprocessing is a primary cause of performance drop.
- Check Data Balance: Ubigo-X demonstrated robust performance on imbalanced data (1:8 ratio), but extreme imbalance can affect outcomes. Analyze your dataset's positive-to-negative site ratio. The model achieved an AUC of 0.94 on imbalanced data, indicating a strong tolerance, but monitoring this is crucial [33].
- Confirm Feature Compatibility: Ensure that the feature extraction methods (e.g., AAC, AAindex, k-mer) are applied consistently to your new sequences. Mismatches in feature generation will lead to erroneous predictions.
Problem 2: Installation or Web Service Access Difficulties
- Issue: You cannot access the Ubigo-X web tool or encounter errors when running local scripts.
- Solution:
- Web Tool: The Ubigo-X web server is accessible at http://merlin.nchu.edu.tw/ubigox/ [33] [34]. If the page is unresponsive, first check your internet connection and try a different browser. The service status is typically operational, as it is an open-access research tool.
- Local Implementation: If you are working with the model architecture locally, confirm that all Python library dependencies are installed at their correct versions (e.g., PyTorch for ResNet34, XGBoost). Incompatible library versions are a common source of runtime errors.
Problem 3: Interpreting Model Outputs and Scores
- Issue: Uncertainty about how to interpret the prediction scores or reliability metrics provided by Ubigo-X.
- Solution:
- Understand the Voting System: Ubigo-X uses a weighted voting strategy to combine its three sub-models [33] [34]. A final score close to 1 indicates high confidence in ubiquitination site prediction. Familiarize yourself with the contribution weights of each sub-model as described in the original publication.
- Contextualize with Benchmarks: Compare your results' performance metrics against the benchmarks from the Ubigo-X paper (see Table 1). This will help you determine if the model is performing as expected on your data.
Frequently Asked Questions (FAQs) for the Ubigo-X Researcher
Q1: What is the core innovation of the Ubigo-X model compared to previous tools? A1: Ubigo-X's primary innovation is the integration of image-based feature representation with an ensemble learning framework using weighted voting [33] [34]. It transforms sequence-based features into a format processable by a deep Resnet34 model and combines this with structure-based features analyzed by XGBoost, achieving superior specificity and balance as measured by the Matthews Correlation Coefficient (MCC).
Q2: On what specific data was Ubigo-X trained and validated? A2: The model was developed using a comprehensive training strategy:
- Training Data: Sourced from the Protein Lysine Modification Database (PLMD 3.0), comprising 53,338 ubiquitination and 71,399 non-ubiquitination sites after sequence filtering [33] [34].
- Independent Testing: Validated on filtered data from PhosphoSitePlus (balanced and imbalanced sets) and GPS-Uber data, demonstrating its generalizability across different databases [33].
Q3: What performance metrics should I prioritize when evaluating Ubigo-X on my own data? A3: While Area Under the Curve (AUC) and Accuracy (ACC) are important, the Ubigo-X study highlights the Matthews Correlation Coefficient (MCC) as a key metric, especially for imbalanced datasets [33]. MCC provides a more reliable measure of the quality of binary classifications when class sizes are very different.
Q4: Is Ubigo-X a species-specific predictor? A4: No, Ubigo-X is designed as a species-neutral prediction tool [33] [34]. Its training and validation incorporated data from various sources without a species-specific focus, making it broadly applicable for ubiquitination site prediction across different organisms.
Data Interpretation Support: Ubigo-X Performance Metrics
The following tables summarize the key quantitative performance data of Ubigo-X from independent tests, providing a benchmark for your own experimental results.
Table 1: Ubigo-X Performance on Balanced Independent Test Data
| Dataset Source | Ubiquitination Sites | Non-ubiquitination Sites | AUC | Accuracy (ACC) | Matthews Correlation Coefficient (MCC) |
|---|---|---|---|---|---|
| PhosphoSitePlus (Filtered) | 65,421 | 61,222 | 0.85 | 0.79 | 0.58 |
| GPS-Uber Data | Information Not Explicitly Stated | Information Not Explicitly Stated | 0.81 | 0.59 | 0.27 |
Table 2: Ubigo-X Performance on Imbalanced Independent Test Data
| Dataset Source | Positive-to-Negative Ratio | AUC | Accuracy (ACC) | Matthews Correlation Coefficient (MCC) |
|---|---|---|---|---|
| PhosphoSitePlus (Imbalanced) | 1:8 | 0.94 | 0.85 | 0.55 |
Experimental Protocol & Workflow
For researchers seeking to reproduce the Ubigo-X methodology or adapt it for their own workflows, the core experimental pipeline is as follows:
- Data Collection & Curation: Acquire protein sequences and known ubiquitination sites from databases like PLMD or PhosphoSitePlus.
- Sequence Filtering: Apply CD-HIT and CD-HIT-2d to filter the dataset with a 40% sequence identity cutoff to remove redundant sequences and reduce homology bias [33] [34].
- Multi-Feature Representation:
- Single-Type SBF: Extract Amino Acid Composition (AAC), physicochemical properties via AAindex, and use one-hot encoding.
- Co-Type SBF: Apply k-mer encoding (e.g., 3-mer) to the Single-Type SBF features.
- S-FBF: Predict secondary structure, calculate Relative Solvent Accessibility (RSA) / Absolute Solvent-Accessible Area (ASA), and identify signal peptide cleavage sites.
- Model Training:
- Transform the Single-Type SBF and Co-Type SBF features into image-based representations.
- Train these image-based features using a Resnet34 deep learning model.
- Train the S-FBF features using the XGBoost algorithm.
- Ensemble Prediction: Combine the predictions from the three sub-models (Single-Type SBF, Co-Type SBF, S-FBF) using a pre-defined weighted voting strategy to generate the final ubiquitination site prediction [33] [34].
Table 3: Essential Computational Resources for Ubiquitination Site Prediction
| Resource Name | Type / Function | Relevance in Ubigo-X |
|---|---|---|
| PLMD 3.0 | Database | Primary source of training data (ubiquitination and non-ubiquitination sites) [33] [34]. |
| PhosphoSitePlus | Database | Used for independent testing and validation of the model's performance [33]. |
| CD-HIT Suite | Bioinformatics Tool | Used for sequence clustering and filtering to create non-redundant training and test sets [33] [34]. |
| Amino Acid Index (AAindex) | Database | Provides numerical indices of physicochemical properties for feature extraction in the Single-Type SBF sub-model [33]. |
| ResNet34 | Deep Learning Architecture | Used to train the image-based representations of sequence-based features [33] [34]. |
| XGBoost | Machine Learning Algorithm | Used to train the structure-based and function-based features (S-FBF sub-model) [33] [34]. |
Troubleshooting FAQs: Ubiquitination Site Analysis
This section addresses common challenges in mass spectrometry workflows for ubiquitination site identification, providing targeted solutions for researchers.
1. How can I improve the coverage of low-abundance ubiquitination sites in my analysis?
- Challenge: The low stoichiometry of endogenous ubiquitination makes many sites difficult to detect without specific enrichment strategies [35] [36].
- Solution: Implement a multi-faceted approach combining sample pre-fractionation and highly specific enrichment. Fractionate peptides using basic pH reversed-phase (bRP) chromatography prior to immunoenrichment to reduce sample complexity [37] [35]. For proteasome-inhibited samples, separate fractions containing the highly abundant K48-linked ubiquitin-chain derived diGly peptide to prevent competition during antibody enrichment [35]. Optimize antibody and peptide input ratios; typically, enrichment from 1 mg of peptide material using 31.25 µg of anti-diGly antibody provides optimal results [35].
2. Why am I getting high quantitative variability in my ubiquitination site quantification?
- Challenge: Inconsistent quantification across replicates, particularly with Data-Dependent Acquisition (DDA) methods [35].
- Solution: Transition to Data-Independent Acquisition (DIA) methods. DIA significantly improves reproducibility - in comparative studies, DIA identified approximately 36,000 distinct diGly peptides across replicates with 45% showing coefficients of variation (CVs) below 20%, compared to only 15% with CVs below 20% in DDA methods [35]. Ensure sufficient MS2 scan quality by using a fragment scan resolution of 30,000 and optimize DIA window placement based on empirical precursor distributions [35].
3. How can I reduce non-specific binding during enrichment of ubiquitinated peptides?
- Challenge: Contamination with non-ubiquitinated peptides reduces detection sensitivity for true ubiquitination sites [37] [36].
- Solution: Chemically cross-link the anti-K-ε-GG antibody to solid support beads. This substantially reduces contamination from antibody fragments and non-specific peptides in final enriched samples [37]. For protein-level enrichments using tagged ubiquitin systems, be aware that histidine-rich or endogenously biotinylated proteins can co-purify with Ni-NTA or Strep-Tactin resins respectively; include appropriate controls and consider alternative enrichment strategies [36].
Performance Comparison: DDA vs. DIA for Ubiquitinome Analysis
The table below summarizes quantitative performance data between Data-Dependent Acquisition (DDA) and Data-Independent Acquisition (DIA) methods for ubiquitination site analysis, based on studies with MG132-treated HEK293 cells [35].
| Parameter | Data-Dependent Acquisition (DDA) | Data-Independent Acquisition (DIA) |
|---|---|---|
| Distinct diGly Peptides Identified (single run) | ~20,000 | ~35,000 |
| Percentage with CV < 20% | 15% | 45% |
| Total Distinct Peptides Across 6 Replicates | ~24,000 | ~48,000 |
| Quantitative Accuracy | Lower | Higher |
| Data Completeness Across Samples | More missing values | Fewer missing values |
Experimental Protocol: K-ε-GG Ubiquitin Remnant Enrichment
This protocol enables large-scale identification of endogenous ubiquitination sites from cell lines or tissue samples, with detailed methodology adapted from established techniques [37].
Sample Preparation and Lysis
- Prepare fresh urea lysis buffer (8 M urea, 50 mM Tris HCl pH 8.0, 150 mM NaCl, 1 mM EDTA) supplemented with protease inhibitors (2 μg/mL Aprotinin, 10 μg/mL Leupeptin, 50 μM PR-619, 1 mM chloroacetamide or iodoacetamide, 1 mM PMSF). Add PMSF immediately before use due to its short half-life in aqueous buffers [37].
- Lyse cells or tissue samples in the prepared buffer. For tissue samples, mechanical disruption may be required.
- Determine protein concentration using a BCA Protein Assay Kit [37].
Protein Digestion and Peptide Cleanup
- Reduce proteins with 1-5 mM dithiothreitol (DTT) at room temperature for 30 minutes.
- Alkylate with 10-15 mM iodoacetamide (IAM) at room temperature for 30 minutes in the dark.
- Dilute the urea concentration to 2 M and digest first with LysC (1:100 enzyme-to-substrate ratio) for 2-3 hours at room temperature.
- Further digest with trypsin (1:100 enzyme-to-substrate ratio) overnight at room temperature.
- Acidify peptides with trifluoroacetic acid (TFA) to pH < 3 and desalt using C18 solid-phase extraction (SPE) columns. Wash with 0.1% TFA and elute with 50% acetonitrile/0.1% formic acid [37].
Basic pH Reversed-Phase Fractionation
- Fractionate peptides using basic pH reversed-phase chromatography to reduce complexity.
- Use solvent A (5 mM ammonium formate pH 10/2% MeCN) and solvent B (5 mM ammonium formate pH 10/90% MeCN) with a C18 column [37].
- For proteasome inhibitor-treated samples, identify and separately pool fractions containing the abundant K48-linked ubiquitin-chain derived diGly peptide to prevent interference [35].
- Concatenate fractions (typically from 96 to 8-9 pools) to reduce the number of samples for downstream processing [37] [35].
Anti-K-ε-GG Antibody Enrichment
- Chemically cross-link the anti-K-ε-GG antibody to protein A or G beads using dimethyl pimelimidate dihydrochloride (DMP) to prevent antibody leakage [37].
- Incubate fractionated peptides with cross-linked antibody beads for 2 hours at 4°C with gentle agitation.
- Wash beads extensively with ice-cold PBS to remove non-specifically bound peptides.
- Elute ubiquitinated peptides with 0.2% TFA [37].
Mass Spectrometric Analysis
- Analyze enriched peptides by LC-MS/MS using either DDA or optimized DIA methods.
- For DIA, use optimized parameters: 46 precursor isolation windows with MS2 resolution of 30,000 [35].
- For identification of ubiquitination sites, search for the characteristic 114.04293 Da mass shift on modified lysine residues, corresponding to the diGly remnant [38] [36].
Ubiquitination Site Identification Workflow
Research Reagent Solutions
The table below details essential reagents and materials for implementing advanced ubiquitination site analysis workflows.
| Reagent/Material | Function/Application | Example Product/Reference |
|---|---|---|
| Anti-K-ε-GG Antibody | Specific enrichment of tryptic peptides with ubiquitin remnant motif | PTMScan Ubiquitin Remnant Motif (K-ε-GG) Kit [37] |
| SILAC Amino Acids | Metabolic labeling for quantitative comparisons between samples [37] [35] | Stable Isotope Labeling by Amino acids in Cell culture kits |
| Cross-linking Reagent | Immobilize antibody to beads to reduce contamination | Dimethyl pimelimidate dihydrochloride (DMP) [37] |
| Protease Inhibitors | Maintain ubiquitination state during lysis (Aprotinin, Leupeptin, PMSF) [37] | Various commercial protease inhibitor cocktails |
| HeLa Protein Digest Standard | System performance testing and troubleshooting [39] | Pierce HeLa Protein Digest Standard (Cat. No. 88328) |
| Peptide Retention Time Calibration Mix | LC system diagnostics and troubleshooting [39] | Pierce Peptide Retention Time Calibration Mixture |
Methodology Comparison: Enrichment Strategies for Ubiquitinated Proteins
Each enrichment method offers distinct advantages and limitations for ubiquitination site analysis, as summarized in the table below.
| Enrichment Method | Mechanism | Advantages | Limitations |
|---|---|---|---|
| K-ε-GG Antibody [37] [35] | Immunoaffinity enrichment of diGly remnant after trypsin digestion | High specificity for ubiquitination sites; works with endogenous proteins; enables site-specific identification | Cannot distinguish ubiquitination from NEDD8ylation/ISG15ylation (<6% of sites) [35]; antibody cost |
| Tagged Ubiquitin Systems [40] [36] | Affinity purification using His/Strep-tagged ubiquitin | Efficient for low-abundance sites; genetic targeting to specific cells | Potential artifacts from tagged ubiquitin expression; not suitable for clinical/tissue samples [36] |
| Ubiquitin-Binding Domains (UBDs) [36] | Tandem UBDs bind ubiquitin chains with higher affinity | Enriches endogenous ubiquitinated proteins; can be linkage-specific | Lower specificity compared to antibody methods; potential for non-specific binding |
DIA vs. DDA Performance Comparison
Frequently Asked Questions (FAQs)
Q1: What is the core principle of the BioE3 system? BioE3 is a biotin-based proximity labeling method designed to identify the direct substrates of a specific E3 ubiquitin ligase. It works by fusing the E3 ligase of interest to the biotin ligase BirA and using a ubiquitin molecule fused to a modified, low-affinity biotin acceptor peptide (AviTag variant called bioGEF). When the BirA-E3 ligase fusion ubiquitinates a substrate using the bioGEF-tagged ubiquitin (bioGEFUb), it biotinylates the ubiquitin molecule in close proximity. This allows for the streptavidin-based capture and identification of the ubiquitinated substrates under denaturing conditions, distinguishing true substrates from mere interactors [41] [42].
Q2: Which types of E3 ligases is BioE3 compatible with? The BioE3 system is highly versatile and has been successfully validated with multiple types of E3 ligases, including:
- RING-type E3s: Such as RNF4 and MIB1 [41].
- HECT-type E3s: Such as NEDD4 [41].
- Multi-subunit Cullin-RING Ligases (CRLs): Such as the CRL4CRBN complex [42]. This makes it a broadly applicable tool for the ubiquitin research community.
Q3: Why is a low-affinity AviTag (bioGEF) crucial for the experiment? The widely used wild-type AviTag (bioWHE) has a high affinity for BirA, which leads to widespread, non-specific biotinylation of bioWHE-tagged ubiquitin, regardless of the BirA-E3's location [41]. The bioGEF variant contains mutations that lower its affinity for BirA. This ensures that biotinylation only occurs when the bioGEFUb is in very close proximity to the BirA-E3 fusion—that is, during the act of substrate ubiquitination. This spatial control dramatically reduces background signal and increases the specificity for genuine substrates [41].
Q4: My negative control shows high background biotinylation. What could be wrong? High background is often traced to incomplete biotin depletion. Ensure you are using biotin-depleted serum and pre-culture cells in biotin-free media for at least 24 hours before the biotin pulse [41] [42]. Furthermore, always include a catalytically inactive mutant of your E3 ligase (e.g., a RING domain mutant) as a negative control to identify and subtract any non-specific interactions [41].
Q5: The streptavidin signal is weak after pull-down. How can I optimize this? Weak signal can be improved by:
- Optimizing biotin pulse time: Test different durations (e.g., 0.5 to 2 hours) to find the optimal window for your specific E3 ligase [41].
- Proteasome inhibition: Treating cells with a proteasome inhibitor (e.g., MG132 or Bortezomib) can prevent the rapid degradation of ubiquitinated substrates, allowing for better accumulation and detection [42] [43].
- Confirming expression: Verify the robust expression of both the BirA-E3 fusion and the inducible bioGEFUb construct in your cell lines [41].
Troubleshooting Guide
The following table outlines common experimental problems, their potential causes, and recommended solutions.
| Problem | Potential Cause | Recommended Solution |
|---|---|---|
| High background biotinylation | Use of wild-type AviTag (bioWHE); Incomplete biotin depletion | Switch to the low-affinity bioGEF tag [41]; Use dialyzed FBS and biotin-free media; Extend pre-culture in biotin-free conditions [42]. |
| Weak or no specific signal | Short biotin pulse; Substrate degradation; Low transfection/induction efficiency | Increase biotin pulse time (e.g., up to 2 hours) [41]; Use proteasome inhibitors (e.g., MG132) [43]; Check and optimize DOX induction and transfection protocols [41]. |
| Failure to identify known substrates | Incorrect subcellular localization of BirA-E3 fusion; Catalytically impaired fusion protein | Fuse BirA to the N-terminus of the E3 to avoid steric hindrance with the C-terminal catalytic domain [41]; Verify catalytic activity of the E3 ligase in the fusion context. |
| Non-specific protein identification in MS | Inadequate washing during pull-down; Contamination from non-covalent interactors | Perform streptavidin pull-down under denaturing conditions [43]; Include a catalytic mutant control and use quantitative MS to filter out background binders [41] [42]. |
Key Experimental Protocols
Core Protocol: BioE3 Substrate Identification Workflow
The diagram below illustrates the step-by-step workflow for a typical BioE3 experiment.
Protocol Modifications for Different E3 Types
For Cullin-RING Ligases (CRLs):
- When studying CRLs like CRL4CRBN, the BirA tag is fused to the substrate receptor (e.g., CRBN) [42].
- To study endogenous activity, the neddylation of the cullin scaffold can be inhibited using MLN4924 as a control [42].
- This system is highly effective for identifying drug-induced neosubstrates. For example, when CRBN BioE3 is treated with pomalidomide, it can identify novel neosubstrates like CSDE1 alongside endogenous substrates [42].
For HECT-type E3 Ligases:
- The BioE3 protocol works with HECT ligases like NEDD4 without major modifications. The catalytic mechanism of HECT E3s, which involves a covalent E3~Ub intermediate, is still compatible with the proximity-dependent labeling by the BirA fusion [41].
Research Reagent Solutions
The table below lists essential reagents and their functions for implementing the BioE3 system.
| Reagent | Function in BioE3 System | Key Details / Examples |
|---|---|---|
| Low-Affinity AviTag Ub (bioGEFUb) | Biotin acceptor peptide fused to Ub; incorporated into substrates. | TRIPZ-bioGEFUbwt (Addgene #208045) or non-cleavable mutant TRIPZ-bioGEFUbnc (Addgene #208044) for reduced DUB recycling [41] [44]. |
| BirA-E3 Fusion Construct | Engineered E3 ligase that catalyzes both ubiquitination and proximity biotinylation. | BirA fused to N-terminus of E3 (e.g., Lenti-BirAopt-RNF4wt, Addgene #208046) [41] [44]. |
| BirA Control Vector | Critical negative control for non-specific biotinylation. | Empty BirA vector (e.g., Addgene #208048) or BirA fused to a catalytically dead E3 mutant [41] [44]. |
| Cell Culture Media | Controls biotin availability for specific labeling. | Biotin-free DMEM supplemented with 10% dialyzed FBS [41] [42]. |
| Streptavidin Beads | Capture biotinylated substrates. | Used for pull-down under denaturing conditions to disrupt non-covalent interactions [43]. |
| Proteasome Inhibitor | Stabilizes ubiquitinated substrates for detection. | MG132 or Bortezomib; added prior to cell lysis [42] [43]. |
Mechanism and Specificity Visualization
The following diagram illustrates the molecular mechanism of the BioE3 system and how it achieves specificity compared to a non-specific wild-type AviTag system.
Ubiquitination is a critical post-translational modification where a 76-amino acid protein, ubiquitin, is covalently attached to substrate proteins, regulating diverse cellular functions from protein degradation to DNA repair and immune signaling [36] [45]. The complexity of ubiquitin signaling arises from its ability to form chains through different lysine linkages (K6, K11, K27, K29, K33, K48, K63) and N-terminal methionine (M1), each generating distinct cellular signals [36] [45]. Antibody-based approaches have become indispensable tools for deciphering this complex ubiquitin code, offering specificity and versatility for researchers investigating ubiquitination in health and disease.
Despite their widespread use, researchers face significant challenges when employing antibody-based detection methods. The transient nature of ubiquitination, coupled with the low stoichiometry of modified proteins in normal physiological conditions, makes detection difficult [36]. Additionally, the high conservation of ubiquitin limits its immunogenicity, resulting in many ubiquitin antibodies being non-specific and binding large amounts of artifacts [46]. The selection of appropriate antibodies is further complicated by differences in epitope recognition characteristics, where antibodies recognizing "open" epitopes can bind to free ubiquitin and polyubiquitin chains, while those targeting "cryptic" epitopes only recognize free ubiquitin and monoubiquitination modifications [47]. Understanding these challenges is fundamental to improving specificity in ubiquitination site identification research.
Antibody Selection Guide
Types of Ubiquitin Antibodies and Their Applications
Selecting the appropriate ubiquitin antibody requires careful consideration of your research goals and experimental design. Antibodies for ubiquitin detection generally fall into three main categories, each with distinct advantages and applications:
Pan-ubiquitin antibodies (e.g., P4D1, FK1/FK2): These antibodies recognize all ubiquitinated proteins regardless of linkage type and are ideal for assessing global changes in protein ubiquitination [36]. They typically produce characteristic smeared bands in Western blot analysis, comprehensively reflecting the overall ubiquitination state of the sample [47]. These antibodies are particularly suitable for initial screening experiments or when assessing the effects of proteasome inhibitor treatments.
Linkage-specific antibodies: These reagents precisely recognize particular ubiquitin chain topologies, enabling researchers to investigate linkage-specific biological functions. For example, K48-linkage specific antibodies (e.g., ab140601) are essential for studying proteasomal degradation pathways, while K63-linkage specific antibodies help elucidate roles in DNA damage repair and inflammatory signaling [48] [46]. The anti-ubiquitin (linkage-specific K48) antibody [EP8589] exemplifies this category, demonstrating specificity for K48-linked ubiquitin chains without cross-reactivity with K6-, K11-, K27-, K29-, K33-, or K63-linked chains [48].
Ubiquitin-binding domains (UBDs): While not antibodies in the traditional sense, UBD-based tools like tandem hybrid ubiquitin-binding domains (ThUBD) and Ubiquitin-Traps offer high-affinity alternatives for capturing ubiquitinated proteins [2] [46]. ThUBD-coated plates demonstrate a 16-fold wider linear range for capturing polyubiquitinated proteins compared to traditional TUBE-coated plates, enabling unbiased enrichment of all ubiquitin chain types with significantly improved sensitivity [2] [49].
Table 1: Guide to Selecting Ubiquitin Antibodies Based on Research Objectives
| Research Goal | Recommended Antibody Type | Expected Results | Key Considerations |
|---|---|---|---|
| Global ubiquitination profiling | Pan-ubiquitin antibodies (e.g., FK1, FK2) | Smeared pattern across high molecular weights | Ideal for monitoring effects of proteasome inhibitors; indicates overall ubiquitination status |
| Proteasomal degradation studies | K48-linkage specific antibodies | Discrete bands or smears at specific molecular weights | Correlates with protein turnover; use with proteasome inhibitors for optimal results |
| DNA repair & inflammatory signaling | K63-linkage specific antibodies | Distinct banding patterns | Useful for studying NF-κB pathway activation and kinase regulation |
| Free ubiquitin pool dynamics | Antibodies recognizing "cryptic" epitopes | Discrete bands at low molecular weights | Suitable for immunoprecipitation; does not recognize polyubiquitin chains |
| Unbiased ubiquitome profiling | UBD-based tools (ThUBD, Ubiquitin-Trap) | Comprehensive capture of all ubiquitin linkages | Higher affinity and broader specificity than most antibodies; ideal for discovery studies |
Technical Considerations for Antibody Validation
When incorporating ubiquitin antibodies into your research workflow, rigorous validation is essential to ensure reliable and reproducible results. Consider the following technical aspects:
Epitope characterization: Understand whether your antibody recognizes "open" or "cryptic" epitopes, as this determines its ability to detect polyubiquitin chains versus free ubiquitin and monoubiquitination [47]. Antibodies against "open" epitopes produce continuous smeared bands in Western blots, while those targeting "cryptic" epitopes yield discrete single or multiple specific bands.
Specificity verification: For linkage-specific antibodies, confirm minimal cross-reactivity with non-target ubiquitin linkages. The manufacturer should provide validation data similar to that shown for anti-Ubiquitin (K48) antibody [EP8589], which demonstrates specificity for K48-linked ubiquitin chains without recognizing other linkage types [48].
Application compatibility: Verify that your chosen antibody has been validated for your specific experimental application (e.g., Western blot, immunohistochemistry, immunoprecipitation, flow cytometry). Performance can vary significantly across different platforms [48] [47].
Sample compatibility: Consider your sample type when selecting antibodies. Whole cell lysates, especially those treated with proteasome inhibitors, contain abundant polyubiquitinated proteins and are most suitable for detection using smear-type antibodies. In contrast, cell models overexpressing free ubiquitin or purified ubiquitin protein samples are more suitable for analysis using band-type antibodies [47].
Troubleshooting Guides
Common Experimental Issues and Solutions
Even with carefully selected antibodies, researchers frequently encounter technical challenges when detecting ubiquitination. The following troubleshooting guide addresses the most common issues and provides practical solutions:
Table 2: Troubleshooting Guide for Ubiquitination Detection
| Problem | Potential Causes | Solutions | Preventive Measures |
|---|---|---|---|
| No bands visible | Insufficient ubiquitinated protein | • Enrich using UBD-based tools (ThUBD, Ubiquitin-Trap) [2] [46]• Treat cells with proteasome inhibitors (e.g., MG-132) [46]• Immunoprecipitate prior to Western blot [50] | • Confirm protein concentration using Bradford assay [50]• Include positive control |
| High background | Non-specific antibody binding | • Optimize blocking conditions (5% normal serum, 5% non-fat milk, or 3% BSA) [50]• Increase wash stringency (0.05% Tween-20) [50]• Titrate antibody concentration [50] | • Avoid milk/BSA when using primary antibodies derived from goat or sheep [50]• Include detergent in dilution buffers |
| Unexpected bands | Protein degradation or non-specific binding | • Add fresh protease inhibitors during sample preparation [50]• Run negative control (non-transfected cell lysate) [50]• Use reducing agents (fresh BME or DTT) [50] | • Minimize freeze-thaw cycles [50]• Prepare fresh working dilutions |
| Smiling or uneven bands | Electrophoresis issues | • Reduce voltage during SDS-PAGE [50]• Ensure proper gel polymerization [50]• Use shaker during incubation steps [50] | • Load smaller protein amounts• Use pre-cast gels for reproducibility |
| Weak or no signal | Low antibody affinity or epitope masking | • Use antibodies with "open" epitopes for polyubiquitin chains [47]• Try different retrieval methods for IHC [48]• Increase antigen-antibody incubation time [50] | • Select antibodies validated for your specific application• Verify antibody recognition characteristics |
Special Considerations for Linkage-Specific Detection
When working with linkage-specific antibodies, additional technical considerations apply:
Validation of linkage specificity: Always confirm that your linkage-specific antibody does not cross-react with other ubiquitin chain types. For example, the anti-Ubiquitin (K48) antibody [EP8589] has been validated against K6-, K11-, K27-, K29-, K33-, and K63-linked ubiquitin chains, showing specificity only for K48 linkages [48].
Signal interpretation: Understand that different linkage types may produce distinct banding patterns. While K48-linked chains often appear as high-molecular-weight smears due to their heterogeneous nature, other linkages might produce more discrete bands depending on their cellular functions and typical chain lengths.
Experimental controls: Include appropriate controls for linkage-specific experiments, such as samples with known linkage types (when available) and samples where specific linkages have been enzymatically eliminated or reduced using linkage-specific deubiquitinases.
Detailed Experimental Protocols
High-Throughput Ubiquitination Detection Using ThUBD-Coated Plates
For researchers requiring high-throughput analysis of ubiquitination signals, the ThUBD-coated plate method offers significant advantages over traditional antibody-based approaches. This protocol enables sensitive, specific, and efficient detection of global ubiquitination profiles:
Workflow Overview: High-Throughput Ubiquitination Detection
Materials Required:
- ThUBD-coated 96-well plates (Corning 3603 type recommended) [2]
- Complex proteome samples (minimum 0.625 μg) [2]
- Appropriate washing buffers
- Detection reagents (ThUBD-HRP recommended) [2]
- Plate reader for signal quantification
Step-by-Step Procedure:
- Plate Preparation: Use commercially available ThUBD-coated plates or prepare your own by coating Corning 3603-type 96-well plates with 1.03 μg ± 0.002 of ThUBD [2].
- Sample Application: Apply complex proteome samples to the plates. The method demonstrates sensitivity for samples with as little as 0.625 μg of protein, representing a 16-fold improvement over traditional TUBE-based methods [2] [49].
- Incubation and Washing: Incubate samples to allow binding of ubiquitinated proteins to the immobilized ThUBD. Perform rigorous washing using optimized buffers to remove non-specifically bound proteins [2].
- Detection: Add detection reagents. The ThUBD-HRP conjugate is recommended for optimal sensitivity [2].
- Quantification: Measure signal intensity using appropriate instrumentation. The method provides a wide dynamic range for precise quantification of ubiquitination signals [2] [49].
Technical Notes:
- This method enables unbiased capture of all ubiquitin chain types, unlike linkage-specific antibodies [2].
- The platform supports studies on global ubiquitination profiles as well as target-specific ubiquitination status [2].
- Particularly useful for dynamic monitoring of ubiquitination in PROTAC drug development and other therapeutic applications [2].
Ubiquitin Immunoprecipitation Followed by Western Blotting
For specific protein analysis, ubiquitin immunoprecipitation combined with Western blotting remains a widely used approach. The following protocol details the optimal procedure:
Workflow Overview: Ubiquitin Immunoprecipitation and Western Blot
Materials Required:
- Ubiquitin antibody (choice depends on research goal - pan-specific or linkage-specific)
- Protein G agarose beads
- Lysis buffer (with protease inhibitors, N-ethylmaleimide/NEM, and benzonase) [51]
- Wash buffers (with 0.05% Tween-20) [50]
- Electrophoresis and transfer equipment
- Primary and secondary antibodies for detection
Step-by-Step Procedure:
- Cell Treatment and Lysis: Treat cells with proteasome inhibitors (e.g., MG-132 at 5-25 μM for 1-2 hours) before harvesting to preserve ubiquitination signals [46]. Prepare lysates using appropriate buffers supplemented with protease inhibitors, NEM (to inhibit deubiquitinases), and benzonase (to reduce viscosity) [51].
- Immunoprecipitation: Incubate lysates with your selected ubiquitin antibody followed by protein G beads. The amount of antibody should be optimized, but typically 10-20 μg of IP antibody per lane is recommended to avoid overloading [50].
- Washing: Perform stringent washing with buffers containing 0.05% Tween-20 to reduce non-specific binding [50].
- Elution and Denaturation: Elute bound proteins under denaturing conditions to disrupt antibody-antigen interactions.
- Western Blotting: Separate proteins by SDS-PAGE and transfer to membranes. For detecting the immunoprecipitating antibody heavy chain, use light chain-specific secondary antibodies to avoid interference in the 50 kDa range [50].
- Detection: Probe membranes with primary and secondary antibodies optimized for your specific needs.
Technical Notes:
- Always include appropriate controls: non-transfected cell lysates, secondary antibody-only controls, and positive controls when available [50].
- To avoid detecting the IP antibody heavy chain (50 kDa) in your Western blot, use an anti-IgG, Light Chain Specific secondary antibody [50].
- For mass spectrometry analysis following immunoprecipitation, use denaturing conditions for streptavidin pulldown to minimize non-specific interactions [51].
Advanced Methodologies
Ubiquitin-Specific Proximity-Dependent Labeling (Ub-POD)
For identifying novel substrates of specific E3 ligases, Ub-POD represents a cutting-edge approach that combines proximity-dependent labeling with the specificity of ubiquitin biochemistry. This method addresses the challenge of capturing transient E3 ligase-substrate interactions:
Principle: Ub-POD exploits the close proximity of a candidate E3 ligase to both its substrate and the E2~Ub complex. The E3 ligase is fused to wildtype BirA biotin ligase, while ubiquitin is tagged with a modified biotin acceptor peptide (-2)AP. When co-expressed in cells and exposed to biotin, the E3 ligase catalyzes biotinylation of (-2)AP-Ub when in complex with E2, leading to biotin-labeled ubiquitinated substrates that can be purified under denaturing conditions [51].
Workflow:
- Construct Preparation: Fuse candidate E3 ligase to BirA and ubiquitin to (-2)AP tag [51].
- Cell Transfection and Biotin Labeling: Co-transfect constructs into cells (e.g., HEK-293) and expose to biotin [51].
- Streptavidin Pulldown: Harvest cells and perform streptavidin-based purification under denaturing conditions [51].
- Substrate Identification: Identify candidate substrates through mass spectrometry or validate via immunoblotting [51].
Advantages Over Traditional Methods:
- Captures transient E3-substrate interactions that conventional co-immunoprecipitation misses [51].
- Provides higher specificity for ubiquitination substrates compared to other proximity labeling methods [51].
- Enables discovery of novel E3 ligase substrates in a physiological context.
Ubi-Tagging for Site-Specific Antibody Conjugation
Beyond detection, ubiquitin biochemistry can be harnessed for engineering antibody conjugates with precise control over labeling sites. The ubi-tagging technique enables site-directed multivalent conjugation of antibodies to ubiquitinated payloads:
Methodology: Ubi-tagging utilizes the enzymatic ubiquitination cascade to generate defined antibody conjugates. The system employs:
- Donor ubi-tag (Ubdon) with a free C-terminal glycine and a mutated conjugating lysine (e.g., K48R) to prevent homodimer formation
- Acceptor ubi-tag (Ubacc) containing the corresponding conjugation lysine residue and an unreactive C terminus
- Specific ubiquitination enzymes (E1 and appropriate E2-E3 fusion proteins) for the desired linkage type [52]
Applications:
- Generation of homogeneous antibody-drug conjugates
- Construction of bispecific T-cell engagers
- Fluorescent labeling of antibodies and nanobodies
- Formation of defined antibody multimers [52]
Benefits:
- Rapid reaction times (approximately 30 minutes)
- High conversion efficiency (93-96%)
- Excellent product homogeneity
- Preservation of antibody function and stability [52]
Research Reagent Solutions
Selecting appropriate reagents is crucial for successful ubiquitination studies. The following table summarizes key tools and their applications:
Table 3: Essential Research Reagents for Ubiquitination Studies
| Reagent Category | Specific Examples | Key Features | Optimal Applications |
|---|---|---|---|
| Linkage-specific antibodies | Anti-Ubiquitin (K48) [EP8589] (ab140601) [48] | Rabbit monoclonal; specific for K48 linkages; validated for WB, IHC, ICC/IF, Flow Cytometry | Studying proteasomal degradation pathways; monitoring protein turnover |
| Pan-ubiquitin antibodies | Ubiquitin Recombinant Rabbit mAb (SDT-R095) [47] | Recombinant rabbit monoclonal; recognizes free ubiquitin and ubiquitination modifications; validated for IP, WB, IF | Global ubiquitination profiling; protein ubiquitination identification in disease contexts |
| UBD-based capture reagents | ThUBD-coated plates [2] [49] | Unbiased capture of all ubiquitin chains; 16x sensitivity improvement over TUBE; high-throughput compatible | PROTAC development; dynamic monitoring of ubiquitination; drug screening applications |
| Ubiquitin traps | ChromoTek Ubiquitin-Trap [46] | Anti-ubiquitin nanobody/VHH coupled to agarose or magnetic beads; captures monomeric ubiquitin and ubiquitinated proteins | Immunoprecipitation of ubiquitinated proteins from diverse species; low-background pulldowns |
| Activity-based probes | Ub-POD system [51] | BirA-fused E3 ligases and Avi-tagged Ub constructs; enables proximity-dependent biotinylation of E3 substrates | Identification of novel E3 ligase substrates; mapping E3-substrate interactions |
| Enzymatic tools | Ubi-tagging system [52] | Recombinant E1, E2-E3 fusion proteins, and ubi-tagged proteins; enables site-specific protein conjugation | Generation of defined antibody conjugates; producing bispecific engagers; multivalent antibody formats |
Frequently Asked Questions (FAQs)
Q1: Why does my ubiquitin Western blot show a smear instead of discrete bands?
A: Smearing is expected and actually indicates successful detection of polyubiquitinated proteins. Ubiquitinated proteins form heterogeneous populations with different chain lengths and molecular weights, resulting in the characteristic smear pattern [46] [47]. If you observe discrete bands instead, your antibody may only recognize free ubiquitin or monoubiquitination due to targeting "cryptic" epitopes that become buried in polyubiquitin chains [47].
Q2: How can I increase ubiquitination signals in my samples?
A: Treat cells with proteasome inhibitors such as MG-132 (typically 5-25 μM for 1-2 hours before harvesting) to prevent degradation of ubiquitinated proteins [46]. Additionally, include deubiquitinating enzyme inhibitors like N-ethylmaleimide (NEM) in your lysis buffer to preserve ubiquitination signals during sample preparation [51].
Q3: What causes high background in ubiquitin Western blots, and how can I reduce it?
A: High background often results from non-specific antibody binding or insufficient blocking. Optimize your blocking conditions using 5% normal serum, 5% non-fat milk, or 3% BSA [50]. Increase wash stringency with buffers containing 0.05% Tween-20, and titrate your antibody concentration to find the optimal signal-to-noise ratio [50]. Avoid using milk or BSA when working with primary antibodies derived from goat or sheep due to potential cross-reactivity [50].
Q4: How do I choose between linkage-specific antibodies and pan-ubiquitin antibodies?
A: Select linkage-specific antibodies (e.g., K48-specific) when investigating specific biological processes like proteasomal degradation (K48) or DNA damage repair (K63). Choose pan-ubiquitin antibodies when you want to assess global changes in protein ubiquitination or when studying processes involving multiple linkage types [36] [47]. Consider your research question—linkage-specific antibodies provide mechanistic insights, while pan-ubiquitin antibodies offer broader overviews.
Q5: What are the advantages of UBD-based tools over traditional antibodies?
A: UBD-based tools like ThUBD and Ubiquitin-Trap offer several advantages: (1) they exhibit unbiased recognition of different ubiquitin chains without linkage preference; (2) they demonstrate higher affinity for polyubiquitinated proteins; (3) they enable more sensitive detection (16-fold improvement in some cases); and (4) they are particularly suitable for high-throughput applications [2] [46] [49].
Q6: How can I specifically detect endogenous ubiquitination without genetic manipulation?
A: Use antibody-based approaches with pan-ubiquitin or linkage-specific antibodies that recognize endogenous ubiquitination [36]. Unlike Ub-tagging methods that require expression of tagged ubiquitin, antibody-based approaches can be applied to native tissues and clinical samples without genetic manipulation [36]. For enhanced sensitivity, combine with UBD-based tools like Ubiquitin-Trap that capture endogenous ubiquitinated proteins from various biological sources [46].
Q7: My protein of interest runs at the same molecular weight as the IgG heavy chain (50 kDa). How can I avoid interference in Western blot after IP?
A: Use an anti-IgG, Light Chain Specific secondary antibody that recognizes only the light chains (25 kDa) of the immunoprecipitating antibody, thus avoiding detection of the heavy chain in the 50 kDa range [50]. Additionally, minimize the amount of IP antibody used (10-20 μg per lane recommended) to reduce background [50].
FAQs and Troubleshooting Guides
Frequently Asked Questions
Q1: What are the primary advantages of using non-hydrolyzable diubiquitin probes over first-generation Ub-based probes?
First-generation activity-based probes (ABPs) were based on a single ubiquitin (Ub) moiety and relied exclusively on interaction with the S1 binding pocket of deubiquitylating enzymes (DUBs). While instrumental in identifying many DUBs, these probes cannot assess linkage specificity conferred by additional Ub-binding pockets [53].
Non-hydrolyzable diubiquitin probes represent a more advanced toolset designed to target both S1 and S2 Ub-binding sites on DUBs. These probes contain a triazole linkage as a non-hydrolyzable isopeptide bond isostere, preventing cleavage between Ub moieties. They are equipped with a C-terminal reactive warhead (e.g., propargylamide) that covalently traps the DUB active site. This design allows researchers to monitor the linkage specificity of the S2 pocket and provides kinetic insights into polyubiquitin chain cleavage specificity, which is crucial for understanding DUB function in complex cellular signaling networks [53].
Q2: My diubiquitin probe shows poor reactivity in cell lysates. What could be the cause?
Poor reactivity in complex proteomes can stem from several factors:
- Probe Stability: Ensure the integrity of the triazole linkage and the C-terminal warhead. The propargylamide warhead is relatively stable, but improper storage or handling can degrade it [53].
- Competitive Inhibition: Endogenous ubiquitin chains, substrates, or inhibitors in the lysate may compete with the probe for DUB binding sites. Pre-clearing lysates or using higher probe concentrations can help overcome this.
- DUB Abundance/Activity: The target DUB might be expressed at low levels or be inactive under the experimental conditions. Always include positive and negative control probes (e.g., targeting different linkages) to validate your assay system. Running a positive control probe like a known reactive Ub-PA can confirm general DUB activity in your lysate [53] [54].
- Warhead Specificity: Although the propargylamide warhead has broad reactivity, some DUB subfamilies might not be efficiently targeted. Consider validating findings with complementary techniques.
Q3: How can I confirm the linkage specificity of a non-hydrolyzable diubiquitin probe?
Linkage specificity should be confirmed through multiple, orthogonal methods:
- Use Purified Recombinant DUBs: Test your panel of linkage-specific probes against a purified DUB of known specificity (e.g., OTUD3 for K11-linkages) as a positive control [53].
- Employ Mutant DUBs: Use DUBs with mutations in their S2 or other secondary binding pockets. A loss of reactivity with a specific linkage probe implicates that pocket in recognition.
- Competition Assays: Pre-incubate the DUB or lysate with native ubiquitin chains of a defined linkage. This should competitively inhibit the binding and labeling by the corresponding probe.
- Combine with Genetic Knockdown: Correlate probe reactivity in lysates with siRNA or CRISPR-mediated knockdown of specific DUBs.
Q4: What are the best practices for storing and handling these synthetic probes to maintain their activity?
- Storage: Store lyophilized probes at -80°C. After reconstitution, prepare small single-use aliquots to avoid repeated freeze-thaw cycles.
- Reconstitution: Use high-quality, DMSO or the buffer recommended by the manufacturer. Avoid aqueous buffers for long-term storage of stock solutions.
- Handling: Keep probes on ice when used. The triazole linkage is chemically stable, but the C-terminal warhead could be susceptible to hydrolysis or nucleophilic attack over time in aqueous solutions.
Troubleshooting Guide
| Problem | Potential Cause | Suggested Solution |
|---|---|---|
| No signal or weak signal | Probe degradation | Synthesize a new batch; verify probe integrity by MS. |
| Low DUB activity/expression | Check lysate quality; use fresh protease inhibitors; try different cell/tissue sources. | |
| Inefficient warhead reactivity | Test a different warhead (e.g., vinyl sulfone) if possible. | |
| High background labeling | Non-specific binding | Optimize blocking conditions; increase salt concentration in wash buffers. |
| Probe concentration too high | Titrate the probe to find the optimal signal-to-noise ratio. | |
| Inconsistent results between experiments | Variation in sample preparation | Standardize protein extraction protocols and protein quantification methods across experiments. |
| Inconsistent reaction conditions | Carefully control temperature, incubation times, and buffer pH for all assays. |
Experimental Protocols & Data Presentation
Key Protocol: Using Non-Hydrolyzable DiUb-PA Probes in Lysate Assays
This protocol outlines the use of non-hydrolyzable diubiquitin probes with a propargylamide (PA) warhead to profile DUB activity in cell lysates [53].
Materials:
- TAMRA-labeled non-hydrolyzable diUb-PA probes (various linkages).
- Cell lysate (e.g., from HEK293T cells), protein concentration 1-2 mg/mL.
- Reaction Buffer: 50 mM Tris-HCl (pH 7.5), 150 mM NaCl, 5 mM DTT.
- 4x Laemmli SDS-PAGE sample buffer.
- SDS-PAGE gel and electrophoresis system.
- Fluorescence scanner or gel imager capable of detecting TAMRA.
Method:
- Prepare Reactions: In a final volume of 20 μL, incubate 10 μg of total protein from cell lysate with 1–2 μM of the desired diUb-PA probe in Reaction Buffer.
- Incubate: Conduct the reaction at 37°C for 30–60 minutes.
- Stop Reaction: Add 7 μL of 4x Laemmli buffer to terminate the reaction.
- Denature: Heat samples at 95°C for 5 minutes.
- Separation and Analysis: Resolve proteins by SDS-PAGE.
- Visualization: Scan the gel directly for TAMRA fluorescence to detect labeled DUBs.
- Validation: For specific protein identification, the gel can subsequently be used for western blotting with antibodies against specific DUBs.
Expected Results: Distinct banding patterns will be visible, indicating DUBs that are covalently modified by the probe. Different linkage-specific probes will label different sets of DUBs, revealing their specificity.
Quantitative Data on DUB Specificity
The reactivity of different DUBs with linkage-specific probes can be quantified by measuring band intensity from fluorescence scans. Below is a summary of findings from the literature [53].
Table 1: Exemplary Linkage Specificity of Selected DUBs with Non-Hydrolyzable DiUb Probes
| DUB | Reactive Linkage(s) | Key Functional Insight |
|---|---|---|
| USP14 | Multiple, with differential reactivity | Shows distinct preferences for different linkages, regulated by its binding to the proteasome. |
| OTUD3 | K11-linked diUb | Binds K11-linked diUb in its S1-S2 binding pockets. |
| OTUD2 | K11- and K33-linked diUb | Binds both K11- and K33-linked diUb in its S1-S2 pockets, suggesting different polyUb cleavage mechanisms than OTUD3. |
The Scientist's Toolkit: Key Research Reagent Solutions
Table 2: Essential Reagents for Working with Non-Hydrolyzable Ubiquitin Probes
| Reagent | Function | Key Characteristics |
|---|---|---|
| Non-hydrolyzable DiUb-PA Probes | Covalently label active DUBs in a linkage-specific manner. | TAMRA-labeled, triazole-linked, C-terminal propargylamide warhead. Available in K11, K48, K63, etc. linkages [53]. |
| Ubiquitin-Aldehyde (Ub-al) | Reversible DUB inhibitor. | Useful in competition assays or to stabilize DUBs during purification. |
| Native Ubiquitin Chains | For competition and validation experiments. | Confirm probe specificity by pre-incubating with native K11, K48, K63, etc. chains. |
| N-Ethylmaleimide (NEM) | Cysteine protease alkylator. | Irreversibly inhibits many DUBs; useful as a negative control to confirm activity-based labeling [53]. |
| Propargylamine (PA) | Core component for warhead synthesis. | Used in the final substitution step to create the PA warhead on the synthetic probe [53]. |
Signaling Pathways and Workflow Visualization
Diagram: S1-S2 Binding Site Probe Design and Mechanism
Diagram: Experimental Workflow for DUB Profiling
Overcoming Specificity Barriers: Strategic Optimization and Problem-Solving
Troubleshooting Guides and FAQs
Frequently Asked Questions
Q: My mass spectrometry analysis failed to detect my protein of interest. How can I verify if it was present in the initial sample? A: Before mass spectrometry, check your input sample directly after cell harvesting by Western Blot. It is also good practice to take a sample at each experimental step (e.g., after lysis, digestion, enrichment) and verify the presence of your target protein via Western Blot or Coomassie staining to identify at which step the loss occurred [55].
Q: I am concerned about protein degradation during sample processing. What precautions should I take? A: Protein degradation can be minimized by adding a protease inhibitor cocktail to all buffers during sample preparation. The cocktail should be active against a broad range of aspartic, serine, and cysteine proteases. Use EDTA-free cocktails if possible, and PMSF is recommended. Remember to remove these inhibitors before proceeding with trypsin treatment. Always keep your protein samples at a low temperature (4°C during working steps, -20°C to -80°C for storage) [55].
Q: How can I improve the detection of low-abundance ubiquitinated peptides? A: Scaling up the initial experiment can help. Alternatively, increase the relative concentration of your target proteins by using a cell fractionation protocol prior to enrichment. The most effective method is to specifically enrich low-abundance ubiquitinated peptides using immunoaffinity techniques, such as with an anti-K-ε-GG antibody, which drastically improves the ability to detect endogenous ubiquitination sites by mass spectrometry [37] [55].
Q: What should I do if my peptide coverage is low after digestion? A: Low coverage can result from unsuitable peptide sizes due to over- or under-digestion or an abundance/lack of protease recognition sites. You can change the digestion time or the type of protease used. Double digestion, a combination of two different proteases (e.g., LysC and trypsin), is also an effective option to improve coverage and peptide count [37] [55].
Q: My mass spectrometry buffers are causing interference. How can I prevent this? A: Check the compatibility of all buffer components, including detergents, EDTA, reducing agents, salt concentration, and pH. To avoid chemical contaminants, use filter tips, single-use pipettes, and HPLC-grade water. Do not autoclave plastics and solutions, and avoid using washing detergents to clean glassware [55].
Troubleshooting Common Experimental Obstacles
| Problem | Potential Cause | Recommended Solution |
|---|---|---|
| Low protein yield | Protein degradation during processing [55] | Add broad-spectrum, EDTA-free protease inhibitor cocktails to all buffers; work at 4°C [37] [55]. |
| Loss of low-abundance targets | Sample loss during preparation steps; masking by high-abundance proteins [55] | Scale up the experiment; use fractionation protocols; employ specific enrichment (e.g., immunoaffinity) [37] [55]. |
| Poor peptide coverage | Unsuitable peptide sizes from digestion [55] | Optimize digestion time; use a different protease (e.g., LysC); perform a double digestion with two enzymes [37] [55]. |
| High background in MS | Buffer incompatibility or chemical contaminants [55] | Verify buffer component compatibility; use HPLC-grade water and filter tips; avoid autoclaving [55]. |
| Insufficient K-ε-GG enrichment | Non-specific binding; antibody contamination | Use basic pH reversed-phase (bRP) fractionation before enrichment; chemically cross-link the anti-K-ε-GG antibody to beads to reduce contamination [37]. |
Quantitative Data and Reagent Solutions
The following table compares the primary methodologies used for the enrichment of ubiquitinated substrates and sites, highlighting their key features and limitations.
| Method | Key Feature | Throughput | Key Limitation |
|---|---|---|---|
| Ub Tagging (e.g., His/Strep) [36] | Expression of affinity-tagged Ub in cells for purification. | High | Not feasible for animal or patient tissues; potential for artifacts. |
| Anti-Ubiquitin Antibodies (Protein-level) [36] | Enrichment of intact ubiquitinated proteins using general Ub antibodies (e.g., P4D1, FK2). | Medium | High cost; co-enrichment of non-ubiquitinated proteins. |
| Anti-K-ε-GG Antibodies (Peptide-level) [37] | Enrichment of tryptic peptides containing the di-glycine remnant on ubiquitinated lysines. | Very High | Requires specific antibody; cannot distinguish Ub from Nedd8/ISG15 by remnant alone. |
| Ub-Binding Domain (UBD)-Based [36] | Use of proteins with Ub-binding domains to enrich endogenous ubiquitinated proteins. | Medium | Low affinity of single UBDs; requires tandem UBDs for efficient enrichment. |
The Scientist's Toolkit: Essential Research Reagents
This table details key reagents and materials critical for successful enrichment and identification of ubiquitination sites, particularly using the anti-K-ε-GG protocol.
| Research Reagent | Function / Explanation |
|---|---|
| Anti-K-ε-GG Antibody | Core reagent for immunoaffinity enrichment of tryptic peptides derived from ubiquitinated proteins. Recognizes the di-glycine (GG) remnant left on lysine residues after trypsin digestion [37]. |
| SILAC Amino Acids | Enable Stable Isotope Labeling by Amino acids in Cell culture for relative quantification of ubiquitination changes across different cellular states [37]. |
| Urea Lysis Buffer | Efficiently lyses cells and denatures proteins while preserving ubiquitination states. Must be prepared fresh to prevent protein carbamylation [37]. |
| Protease Inhibitors (Aprotinin, Leupeptin, PMSF) | Essential for preventing protein degradation by cellular proteases during sample preparation. PMSF has a short half-life in aqueous solution and should be added immediately before use [37] [55]. |
| Chloroacetamide (CAM) / Iodoacetamide (IAM) | Alkylating agents used to block cysteine residues, preventing disulfide bond formation and ensuring complete protein denaturation [37]. |
| LysC & Trypsin | Proteases used for sequential protein digestion. LysC is active in urea and creates peptides suitable for subsequent trypsin digestion [37]. |
| Dimethyl Pimelimidate (DMP) | A cross-linker used to immobilize the anti-K-ε-GG antibody to solid support beads, which significantly reduces antibody fragment contamination in the final MS sample [37]. |
Experimental Protocols and Workflows
Detailed Protocol: K-ε-GG Peptide Enrichment for Ubiquitination Site Mapping
This protocol is designed for the large-scale identification of endogenous ubiquitination sites from cell lines or tissue samples and can be completed in approximately 5 days after sample preparation [37].
Stage 1: Sample Preparation and Lysis
- Lysis: Lyse cells or tissue using a freshly prepared urea lysis buffer (8 M urea, 50 mM Tris HCl pH 8.0, 150 mM NaCl) containing a suite of protease inhibitors (e.g., Aprotinin, Leupeptin, PMSF) and 1 mM chloroacetamide (CAM) or iodoacetamide (IAM) for alkylation [37].
- Protein Quantification: Determine the protein concentration using a BCA assay [37].
- Reduction and Alkylation: Reduce disulfide bonds with dithiothreitol (DTT) and then alkylate with CAM or IAM. Note that if CAM was already included in the lysis buffer, this alkylation step can be adjusted [37].
- Digestion: First, digest the proteins with LysC. Then, dilute the urea concentration and perform a second digestion with sequencing-grade trypsin to generate peptides [37].
- Desalting: Desalt the resulting peptide mixture using solid-phase extraction (SPE) with C18 material. Elute peptides in 50% acetonitrile/0.1% formic acid [37].
Stage 2: Peptide Fractionation (Optional but Recommended)
- Basic pH Reversed-Phase (bRP) Chromatography: Fractionate the desalted peptides using a high-pH (pH 10) buffer system (e.g., 5 mM ammonium formate) with an increasing acetonitrile gradient. This pre-fractionation step significantly reduces sample complexity and increases the number of ubiquitination sites identified [37].
Stage 3: Immunoaffinity Enrichment
- Antibody Cross-linking: To minimize contamination, immobilize the anti-K-ε-GG antibody to protein A- or G-agarose beads using the cross-linker dimethyl pimelimidate (DMP) in 100 mM sodium borate pH 9.0 [37].
- Peptide Enrichment: Incubate the fractionated or unfractionated peptide samples with the cross-linked antibody beads. Use phosphate-buffered saline (PBS) as the incubation buffer.
- Washing and Elution: After incubation, wash the beads extensively to remove non-specifically bound peptides. Elute the bound K-ε-GG peptides using a low-pH buffer [37].
Stage 4: Mass Spectrometric Analysis
- LC-MS/MS Analysis: Analyze the enriched K-ε-GG peptides by liquid chromatography coupled to tandem mass spectrometry (LC-MS/MS) [37].
- Data Analysis: Search the MS data against the appropriate protein database. Identify ubiquitination sites by detecting the characteristic K-ε-GG remnant (a GG modification on lysine, resulting in a +114.04 Da mass shift on the modified residue) on the peptide sequences [37] [36].
Experimental Workflow Diagram
Ubiquitination Signaling and Enrichment Pathways
Protein ubiquitination is a versatile post-translational modification that regulates nearly all cellular processes, from protein degradation and cell cycle progression to immune response and DNA repair [56] [6]. This modification involves the covalent attachment of ubiquitin—a small 76-amino acid protein—to target substrates via a sequential enzymatic cascade involving E1 (activating), E2 (conjugating), and E3 (ligating) enzymes [56] [18]. The complexity of ubiquitination arises from its ability to form diverse chain architectures, including monoubiquitination, multi-monoubiquitination, and polyubiquitin chains connected through different lysine residues (K6, K11, K27, K29, K33, K48, K63) or the N-terminus (M1) of ubiquitin itself [6] [57].
The specific cellular outcome of ubiquitination depends critically on the chain topology—the precise arrangement of ubiquitin molecules within a chain [58] [6]. For instance, K48-linked chains typically target substrates for proteasomal degradation, while K63-linked chains are involved in non-proteolytic signaling processes such as kinase activation and DNA repair [59]. More recently, the discovery of mixed or branched ubiquitin chains, where a single chain incorporates multiple linkage types, has added another layer of complexity to ubiquitin signaling [57]. This technical support document addresses the key challenges researchers face in deconvoluting this complexity and provides practical guidance for mapping ubiquitin chain topology with high specificity.
Key Research Reagent Solutions
The following table summarizes essential reagents and tools for studying multi-ubiquitination and chain topology:
Table 1: Key Research Reagent Solutions for Ubiquitination Studies
| Reagent Type | Specific Examples | Function and Application |
|---|---|---|
| Activity-Based Probes | Ubiquitin vinyl sulfone (Ub-VS), Ubiquitin propargylamide (Ub-PA) [60] | Covalently label active deubiquitinases (DUBs) for identification and characterization |
| Linkage-Specific Antibodies | K48-linkage specific, K63-linkage specific, K11-linkage specific antibodies [57] | Detect specific ubiquitin chain linkages by Western blot or immunofluorescence |
| Ubiquitin Variants | USP7-selective ubiquitin variants [60] | Engineered ubiquitin mutants that selectively target specific DUBs or E3 ligases |
| Diubiquitin Probes | K48-linked diUb, K63-linked diUb probes [60] | Full-length diubiquitin molecules with defined linkages to study DUB specificity |
| Enrichment Tools | TUBE (Tandem Ubiquitin Binding Entities), Ubiquitin-binding domains (UBDs) [18] | High-affinity reagents for purifying ubiquitinated proteins from complex mixtures |
| Mass Spectrometry Standards | SILAC (Stable Isotope Labeling with Amino Acids in Cell Culture), TMT (Tandem Mass Tag) reagents [18] | Enable quantitative comparison of ubiquitination levels across different conditions |
Experimental Workflows for Ubiquitination Site and Topology Mapping
Comprehensive Mass Spectrometry Workflow
Mass spectrometry has emerged as the cornerstone technology for mapping ubiquitination sites and determining chain topology. The following diagram illustrates a standardized workflow for ubiquitinomics:
Figure 1: Mass spectrometry workflow for ubiquitination site identification and topology mapping. Key steps (yellow) require optimization for specific research questions.
The standardized protocol involves:
Protein Extraction and Digestion: Isolate proteins from biological samples using appropriate lysis buffers. Digest proteins into peptides using specific proteases like trypsin, which cleaves after lysine and arginine residues, generating characteristic peptides with C-terminal glycine-glycine remnants from ubiquitin modification [18].
Ubiquitinated Peptide Enrichment: Due to the low stoichiometry of ubiquitination, enrichment is crucial. The most effective methods include:
LC-MS/MS Analysis and Data Interpretation: Analyze enriched peptides using high-resolution mass spectrometry. Data-dependent acquisition (DDA) is suitable for discovery studies, while data-independent acquisition (DIA) provides better sensitivity for low-abundance modifications [57]. Use software tools like MaxQuant, Proteome Discoverer, and PEAKS to identify ubiquitination sites based on the characteristic mass shift (8.5 kDa) and the di-glycine remnant on modified lysines [18].
Determining Ubiquitin Chain Topology
Understanding chain architecture is essential for deciphering ubiquitin signaling. The following methods are commonly employed:
Linkage-Specific Antibodies: Commercial antibodies that recognize specific ubiquitin linkages (e.g., K48, K63, K11) can be used for Western blotting or immunoprecipitation [57]. However, these may have limited utility for detecting mixed or branched chains.
Ubiquitin Chain Restriction (UbiCRest) Assay: This method uses linkage-specific deubiquitinases (DUBs) to digest ubiquitin chains in a linkage-selective manner, followed by Western blot analysis to infer chain topology [57].
Advanced Mass Spectrometry Approaches:
- Middle-down and Top-down MS: Analyze larger ubiquitin-containing fragments or intact ubiquitinated proteins to preserve information about chain connectivity [57] [18].
- Cross-linking MS: Stabilize non-covalent interactions within polyubiquitin chains to determine spatial arrangements.
- Branched Chain Analysis: Use ubiquitin mutants (e.g., R54A) that facilitate detection of branched ubiquitin chains by MS [57].
Troubleshooting Guides and FAQs
Frequently Asked Questions
Table 2: Frequently Asked Questions in Ubiquitination Research
| Question | Expert Answer | Key References |
|---|---|---|
| Why are ubiquitinated peptides difficult to detect by MS? | Ubiquitinated peptides are low in abundance, have lower ionization efficiency, and their signals are often masked by non-modified peptides. Comprehensive enrichment is essential. | [18] |
| How can I distinguish between different ubiquitin chain linkages? | Use a combination of linkage-specific antibodies, UbiCRest assays with specific DUBs, and advanced MS methods that analyze signature peptides for each linkage type. | [57] |
| What controls should I include in ubiquitination assays? | Always include E1/E2/E3 enzyme controls, ATP-depletion controls, and use catalytically inactive E3 ligase mutants to confirm specificity. | [18] |
| How does ubiquitin chain topology affect protein function? | Chain topology determines which "reader" proteins will bind, thus directing functional outcomes—K48 for degradation, K63 for signaling, K11 for cell cycle regulation. | [58] [6] [59] |
| Can ubiquitination sites be predicted computationally? | Tools like UbPred and Ubisite use machine learning to predict potential ubiquitination sites, but experimental validation is essential due to limited accuracy. | [18] |
Troubleshooting Common Experimental Issues
Problem: Low yield of ubiquitinated proteins after enrichment
- Potential Causes: Inefficient lysis, protease or DUB activity during preparation, insufficient binding capacity of enrichment reagents.
- Solutions:
- Use fresh protease and DUB inhibitors in all buffers
- Optimize the ratio of sample to enrichment reagent
- Include negative controls to monitor enrichment efficiency
- Consider using stronger denaturing conditions to preserve modifications [18]
Problem: Inconsistent results in in vitro ubiquitination assays
- Potential Causes: Improper enzyme ratios, insufficient ATP, suboptimal reaction conditions.
- Solutions:
- Use recombinant E1, E2, and E3 enzymes in systematic ratios (recommended starting point: 50nM E1, 1μM E2, 2μM E3)
- Ensure ATP regeneration systems are included for longer reactions
- Include all necessary components in control reactions (ubiquitin, ATP, E1/E2/E3) [18]
Problem: Unable to determine ubiquitin chain topology unambiguously
- Potential Causes: Heterogeneous chain populations, limitations of single methodological approaches.
- Solutions:
- Combine multiple complementary methods (e.g., UbiCRest + MS)
- Use ubiquitin mutants (K-only or R-only) to simplify chain analysis
- Employ cross-linking strategies to stabilize chains before analysis [57]
Problem: High background in ubiquitination detection assays
- Potential Causes: Non-specific antibody binding, incomplete blocking, endogenous ubiquitinated proteins in expression systems.
- Solutions:
Advanced Applications and Case Studies
Case Study: K48 to K11 Chain Topology Switch in Met4 Regulation
Research on the yeast transcription factor Met4 provides a compelling example of how ubiquitin chain topology determines functional outcomes. The following diagram illustrates this topology switch mechanism:
Figure 2: Ubiquitin chain topology switch regulating Met4 activity. K48-linked chains (red) repress transcription by competing with basal transcription machinery, while K11-enriched chains (green) permit transcription activation.
Key findings from this study:
- Met4 is modified with K48-linked ubiquitin chains under repressive conditions, which directly inhibit its transactivation function without triggering degradation [58].
- Upon activation, chain topology shifts toward K11-linked chains, which relieves competition for binding to the tandem ubiquitin-binding domain (tandem-UBD) in Met4 [58].
- This topology change permits recruitment of the basal transcription complex and activation of methionine biosynthesis genes [58].
- The tandem-UBD in Met4 functions as both a ubiquitin-binding module and a transactivation domain, illustrating how ubiquitin can directly regulate protein function beyond degradation [58].
Ubiquitination in Viral Infection: SARS-CoV-2 Case Study
A multi-omics study of SARS-CoV-2-infected lung epithelial cells revealed how viruses hijack the host ubiquitination system:
- SARS-CoV-2 infection significantly alters the host ubiquitinome, with 5,359 lysine sites on 2,124 proteins showing increased ubiquitination and 1,176 sites on 675 proteins showing decreased ubiquitination [61].
- Viral proteins, including the Spike protein, undergo ubiquitination at specific sites despite SARS-CoV-2 not encoding any E3 ligases itself [61].
- Ubiquitination at three specific sites on the Spike protein significantly enhances viral infection [61].
- High-throughput screening identified four host E3 ubiquitin ligases that influence SARS-CoV-2 infection, presenting potential antiviral targets [61].
This case study highlights the importance of comprehensive ubiquitin mapping for understanding host-pathogen interactions and identifying novel therapeutic targets.
The field of ubiquitin research continues to evolve with emerging technologies offering new capabilities for deconvoluting multi-ubiquitination complexity. Key future directions include:
Improved Methodologies for Branched Chain Analysis: New mass spectrometry approaches and computational tools are needed to better characterize the prevalence and functions of branched ubiquitin chains in cellular regulation [57].
Single-Cell Ubiquitinomics: Adapting current methodologies to single-cell analysis will reveal cell-to-cell heterogeneity in ubiquitin signaling [62].
Dynamic Monitoring of Ubiquitination: Developing real-time reporters for ubiquitin chain dynamics would enable researchers to observe topology changes during cellular processes [59].
Integration with Other Post-Translational Modifications: Understanding how ubiquitination cross-talks with other modifications like phosphorylation and acetylation will provide a more comprehensive view of cellular signaling networks [62].
The troubleshooting guides and methodologies presented here provide a foundation for addressing current challenges in ubiquitination research. As these advanced technologies mature, they will further enhance our ability to map and manipulate the ubiquitin code with unprecedented precision, opening new avenues for therapeutic intervention in cancer, neurodegenerative diseases, and infectious diseases.
Frequently Asked Questions (FAQs)
FAQ 1: What are the primary sources of false positives in ubiquitination site identification? False positives in ubiquitination site research primarily arise from non-specific binding during affinity enrichment, the low stoichiometry of endogenous ubiquitination, and the complexity of Ub chain architectures. Heuristic-based computational methods used to identify homologous sequences from incomplete data (e.g., from low-coverage RNA-seq) can also overestimate putative homologies, with one study reporting false positive rates of up to ~42% for some algorithms [63]. Experimental challenges include co-purification of non-ubiquitinated proteins (e.g., histidine-rich or endogenously biotinylated proteins) when using tagged Ub approaches, and the inability of some methods to distinguish genuine substrates from transient interactors [36] [41].
FAQ 2: How can I determine if my homology-based clustering results are reliable? Reliability can be assessed by implementing a post-processing machine learning step to identify and filter false positive clusters. One approach involves training a classifier on known homology clusters and randomly generated non-homologous sequence alignments. This classifier uses biologically informative features extracted from multiple sequence alignments to determine the quality of clusters generated by heuristic tools like InParanoid or HaMStR, successfully identifying a significant proportion of false positives [63] [64].
FAQ 3: What is the role of cross-validation in evaluating predictive models for ubiquitination sites, and which method should I use? Cross-validation (CV) is a data resampling method crucial for assessing a model's generalizability and preventing overfitting, especially when experimental validation is resource-intensive [65]. The choice of CV method depends on your dataset and goal. Standard Random CV (RCV) can produce over-optimistic performance estimates if test and training sets are too similar [66]. For a more realistic assessment, consider Clustering-based CV (CCV), which tests a model's ability to predict on qualitatively distinct data (e.g., different experimental conditions) [66]. For small or imbalanced datasets, Leave-One-Out CV (LOOCV) or Stratified K-Fold CV is often recommended [65].
FAQ 4: My ubiquitination site data is from different experimental conditions. How does this affect model evaluation? Data from different conditions can violate the standard assumption that test and training samples are independently and identically distributed. Using standard Random CV in such cases can lead to inflated performance metrics, as the model may be tested on conditions very similar to those it was trained on. To accurately assess generalizability, use Leave-One-Group-Out CV (LOGOCV), where all samples from one experimental condition (or "group") are left out as the test set. This ensures the model is evaluated on a truly independent context [66] [65].
FAQ 5: Are there specific experimental strategies to enhance the specificity of substrate identification for E3 ligases? Yes, innovative techniques like BioE3 significantly improve specificity. This method uses a fusion between the biotin ligase BirA and an E3 ligase of interest, combined with a bioUbL (biotinylatable ubiquitin-like protein) expressed in stable cell lines. By controlling biotin availability and using an optimized AviTag variant (bioGEF) with lower affinity for BirA, BioE3 enables time-limited, proximity-dependent biotinylation of ubiquitinated substrates specifically where the BirA-E3 fusion is active. This reduces non-specific background and allows for the precise streptavidin-based capture and identification of bona fide targets by LC-MS [41].
Troubleshooting Guides
Issue 1: High Background Noise in Ubiquitinated Protein Enrichment
Problem: Streptavidin/avidin pulldown results in many non-specifically bound proteins, obscuring genuine ubiquitination targets.
Solutions:
- Use Proximity-Dependent Labeling: Implement the BioE3 strategy with the bioGEF tag instead of the wild-type AviTag (bioWHE). The bioGEF tag has a lower affinity for BirA, which drastically reduces non-specific biotinylation while maintaining efficient labeling of true substrates near the BirA-E3 ligase fusion [41].
- Control Biotin Availability: Pre-incubate cells in biotin-depleted serum before transfection/induction. Add exogenous biotin for a short, defined labeling period (e.g., 2 hours) to limit biotinylation to a specific time window [41].
- Employ Linkage-Specific Antibodies: If studying a specific Ub chain type (e.g., K48 or K63-linked), use linkage-specific Ub antibodies for enrichment to reduce complexity and isolate a more specific subset of targets [36].
Issue 2: Over-optimistic Performance of Ubiquitination Site Prediction Models
Problem: Your model shows high accuracy during cross-validation but fails to predict effectively on new, unrelated datasets.
Solutions:
- Avoid Random CV Partitions: Do not rely solely on standard Random K-Fold CV. If your data contains groups (e.g., from different experimental batches or conditions), use Leave-One-Group-Out CV (LOGOCV) to ensure the model is tested on entirely unseen groups [66] [65].
- Quantify Test-Train Distinctness: Use a "distinctness" score to measure the dissimilarity between your training and test sets based on predictor variables. Evaluate your model across a spectrum of distinctness scores using methods like Simulated Annealing CV (SACV) to get a realistic performance profile [66].
- Implement Nested CV for Hyperparameter Tuning: Use Nested Cross-Validation (NCV) to perform all model selection and hyperparameter tuning within the training folds of an outer CV loop. This prevents information leakage from the test set and provides an unbiased estimate of model performance on unseen data [65].
Issue 3: Computational Homology Inference Yields Putative False Positive Clusters
Problem: Heuristic algorithms (e.g., InParanoid, HaMStR) produce clusters of putative homologous genes that contain unrelated sequences.
Solutions:
- Post-Process Clusters with Machine Learning: Train a supervised machine learning model to classify clusters as true homologs or false positives. Use features derived from multiple sequence alignments (MSAs) of the clusters. The model can be trained on known homology clusters from databases like OrthoDB and artificially generated non-homologous sequence alignments [63].
- Validate with Phylogenetic Information: When possible, supplement heuristic methods with evidence-based phylogenetic analyses to confirm homologous relationships, as heuristic methods are known to have higher false positive rates [63].
Quantitative Data on False Positive Reduction
The following table summarizes key quantitative findings from the literature on the effectiveness of various false-positive reduction strategies.
Table 1: Efficacy of Methods for Reducing False Positives in Homology and Ubiquitination Research
| Method / Strategy | Application Context | Quantitative Result / Improvement | Source |
|---|---|---|---|
| Machine Learning Post-Processing | Homology cluster inference from heuristic algorithms | Classified ~42% of InParanoid and ~25% of HaMStR predictions as false positives on an experimental dataset. | [63] [64] |
| BioGEF Tag (vs. bioWHE) | Proximity-dependent labeling in BioE3 | Eliminated non-specific biotinylation background, enabling specific detection of E3 ligase substrates. | [41] |
| Clustering-based CV (vs. Random CV) | Gene expression prediction model evaluation | Provided a more realistic and less optimistic estimate of model performance on unseen data conditions. | [66] |
Experimental Protocol: BioE3 for Specific E3 Ligase Substrate Identification
This protocol details the methodology for identifying specific substrates of ubiquitin E3 ligases while minimizing false positives, as described in the BioE3 approach [41].
Principle: A BirA-E3 ligase fusion protein and a bioGEF-tagged Ub (bioGEFUb) are co-expressed. In the presence of free biotin, the BirA-E3 fusion biotinylates the bioGEFUb in proximity as it conjugates onto substrates, allowing highly specific streptavidin-based pulldown.
Materials:
- Plasmids: Inducible lentiviral vector encoding
bioGEFUb(WT or non-cleavable L73P mutant), plasmid encodingBirAfused to your E3 ligase of interest (N-terminal fusion is often optimal). - Cell Line: HEK293FT or U2OS cells suitable for generating stable lines.
- Media: Dialyzed, biotin-depleted serum, exogenous biotin.
- Lysis & Capture Buffers: Standard RIPA lysis buffer, streptavidin-conjugated beads (e.g., Streptavidin-Tactin).
Procedure:
- Generate Stable Cell Line: Create a stable cell line (e.g., HEK293FT) with a doxycycline (DOX)-inducible
bioGEFUbconstruct. - Culture in Biotin-Depleted Conditions: Grow the stable cells in media supplemented with dialyzed, biotin-depleted serum for at least 24 hours to deplete endogenous biotin.
- Introduce BirA-E3 and Induce bioGEFUb: Transfect the cells with the
BirA-E3fusion plasmid. Simultaneously, inducebioGEFUbexpression with DOX for 24 hours. - Pulse with Biotin: Add exogenous biotin to the culture medium for a limited time (e.g., 2 hours) to allow proximity-dependent biotinylation of ubiquitinated substrates.
- Cell Lysis and Capture: Lyse cells using a stringent RIPA buffer. Incubate the clarified lysate with streptavidin-conjugated beads to capture biotinylated proteins.
- Stringent Washing: Wash beads extensively with lysis buffer to remove non-specifically bound proteins.
- Elution and Identification: Elute bound proteins (e.g., via boiling in SDS buffer) and identify them using Liquid Chromatography-Mass Spectrometry (LC-MS).
Visualization of Key Methodologies
Diagram 1: BioE3 Experimental Workflow for Specific Substrate Capture
Diagram 2: Cross-Validation Strategy Selection for Model Evaluation
The Scientist's Toolkit: Key Research Reagent Solutions
Table 2: Essential Reagents and Tools for Specific Ubiquitination Research
| Reagent / Tool | Function / Principle | Key Application in Specificity |
|---|---|---|
| bioGEF AviTag | An engineered peptide tag with lower affinity for BirA ligase. | Critical for proximity-dependent labeling in BioE3; drastically reduces non-specific biotinylation background compared to the standard bioWHE AviTag [41]. |
| Linkage-Specific Ub Antibodies | Antibodies that recognize a specific Ub chain linkage type (e.g., K48, K63, M1). | Enables enrichment of proteins modified by a specific Ub chain architecture, reducing the complexity of the proteomic analysis and increasing biological specificity [36]. |
| Tandem-Repeated UBDs | Multiple Ub-binding domains (UBDs) arranged in tandem. | Used to enrich endogenously ubiquitinated proteins with higher affinity and specificity than single UBDs, improving capture efficiency [36]. |
| Strep-Tactin Resin | An engineered streptavidin with extremely high affinity for Strep-tag II or biotin. | Used for highly specific pulldown of biotinylated proteins (e.g., in BioE3) under stringent washing conditions, minimizing non-specific binding [36] [41]. |
| Non-cleavable Ub (Ubnc) | Ubiquitin mutant (e.g., L73P) resistant to cleavage by deubiquitinating enzymes (DUBs). | Prevents recycling of biotinylated Ub, helping to ensure that the isolated proteins are direct substrates and that the biotin label remains at the original site of modification [41]. |
Technical FAQs: Core Mechanisms and Challenges
FAQ 1: How can phosphorylation and acetylation on a substrate protein directly interfere with the identification of its ubiquitination sites?
Phosphorylation and acetylation can interfere with ubiquitination site identification through several direct biochemical mechanisms. First, steric hindrance can occur; the addition of phosphoryl or acetyl groups can physically block the access of E3 ubiquitin ligases to the target lysine residue, thereby preventing ubiquitination. Second, these modifications can alter the charge properties of amino acid residues and surrounding sequences. For instance, phosphorylation adds a negative charge, which can disrupt multivalent electrostatic interactions necessary for the recognition and modification processes involved in ubiquitination [67]. This change in the local electrostatic environment can make it difficult for ubiquitination machinery to engage with the substrate. Finally, competitive binding can take place; the modified residues may create binding sites for reader proteins that are distinct from those recognized by the ubiquitination system, effectively diverting the substrate from the ubiquitination pathway [68].
FAQ 2: What is the molecular basis for the crosstalk where a proximal phosphorylation event promotes the ubiquitination of a specific lysine residue?
The promotion of ubiquitination by a nearby phosphorylation event often relies on the creation of a phospho-degron. This is a specific motif where phosphorylation creates a high-affinity binding site for a particular E3 ubiquitin ligase or an adaptor protein that subsequently recruits the ubiquitin machinery [68]. A classic example is the phosphorylation-dependent inactivation of a degron.\ For instance, the acetylation of Lys310 on the NF-κB subunit RELA interferes with the adjacent methylation of Lys314/315 by SETD7. Since this methylation is a prerequisite for RELA's ubiquitination and degradation, the acetylation event effectively stabilizes the protein by inactivating the methyl-activated degron [68]. This illustrates how one PTM can interfere with another to control ultimate protein fate.
FAQ 3: During mass spectrometric analysis, how do phosphorylation and acetylation complicate the confident identification of ubiquitinated peptides?
The complications in mass spectrometry (MS) analysis are both chemical and analytical. Phosphopeptides and, to a lesser extent, acetylated peptides can exhibit suppressed ionization efficiency, meaning they are less readily detected by the mass spectrometer compared to their unmodified counterparts, leading to lower coverage of these peptides [69]. Furthermore, the lability of the phosphoryl group is a major issue; during ionization, phosphoserine and phosphothreonine can undergo neutral loss (loss of 98 Da or 80 Da), which can complicate MS/MS spectra and lead to misidentification or complete failure to sequence the peptide [69]. From a data analysis perspective, allowing for too many variable modifications (e.g., phosphorylation on S/T/Y, acetylation on K, and ubiquitination remnant diGly on K) in a single database search exponentially increases search time and decreases statistical confidence in peptide-spectrum matches. Often, researchers must perform separate, targeted enrichment and analysis for each PTM type to achieve confident identifications [69] [70].
Troubleshooting Guides
Table 1: Troubleshooting PTM Cross-talk in Ubiquitination Experiments
| Problem | Potential Cause | Recommended Solution | Underlying Mechanism |
|---|---|---|---|
| Low ubiquitination site coverage in MS | Ion suppression from co-existing phosphopeptides/acetyl-peptides; Lability of PTMs during analysis. | Perform sequential PTM enrichment: first for phosphopeptides/acetyl-peptides, then for diGly remnants. Use "cold" MALDI matrices (e.g., DHB) for phospho-stability [69]. | Enrichment reduces sample complexity, allowing less abundant ubiquitinated peptides to be detected. Cold matrices reduce energy transfer, minimizing PTM loss [69]. |
| Inconsistent ubiquitination efficiency in vitro | Uncontrolled pre-existing PTMs on purified substrate interfering with E3 ligase binding. | Treat substrates with phosphatases (e.g., lambda phosphatase) and/or deacetylases (e.g., HDACs) prior to ubiquitination assays [69] [68]. | Eraser enzymes remove competing modifications, revealing the native lysine residue and allowing unambiguous assessment of E3 ligase activity [68]. |
| Difficulty discerning functional outcomes of specific PTMs | Complex, overlapping PTM codes on a single protein creating a convoluted signaling output. | Employ site-directed mutagenesis to create non-modifiable residues (Lys to Arg for ubiquitination/acetylation; Ser/Thr to Ala for phosphorylation) [68]. | Mutagenesis allows for the dissection of the individual contribution of a single PTM site to the overall protein stability and function, isolating it from the cross-talk network. |
| Unexpected protein stabilization | Acetylation or inhibitory phosphorylation creating a PTM-inactivated degron, blocking ubiquitin ligase recognition. | Probe for acetylation/methylation/phosphorylation status near known degrons via immunoblotting with modification-specific antibodies after cellular stimulation [68]. | PTMs like acetylation can sterically hinder or electrostatically repulse the ubiquitin machinery, acting as a protective shield that prevents degradation [68]. |
Experimental Protocol 1: Validating PTM-Driven Ubiquitination
This protocol outlines a co-immunoprecipitation (Co-IP) workflow to validate that a specific phosphorylation event is necessary for the ubiquitination of a protein of interest (POI).
- Plasmid Transfection: Transfect cells with constructs for the POI, a relevant E3 ubiquitin ligase, and a constitutively active kinase (or kinase-dead mutant as control). Include a plasmid for His- or HA-tagged ubiquitin.
- Proteasome Inhibition: Treat cells with a proteasome inhibitor (e.g., MG132, 10-20 µM for 4-6 hours) prior to harvesting to prevent the degradation of ubiquitinated proteins.
- Cell Lysis and Immunoprecipitation: Lyse cells in a mild, non-denaturing RIPA buffer. Immunoprecipitate the POI using a specific antibody.
- Western Blot Analysis: Analyze the immunoprecipitated samples by Western blotting.
- Membrane 1: Probe with an anti-Ubiquitin antibody (or anti-His/HA to detect tagged Ub) to visualize ubiquitinated POI species (appearing as high molecular weight smears).
- Membrane 2: Probe with a phospho-specific antibody against the POI to confirm successful phosphorylation.
- Membrane 3: Probe with a total antibody against the POI to control for loading.
Expected Outcome: A stronger ubiquitination signal should be observed in the presence of the active kinase compared to the kinase-dead control, indicating that phosphorylation is promoting ubiquitination.
Diagram: Experimental Workflow for Validating PTM-Driven Ubiquitination
Experimental Protocol 2: Differentiating Ubiquitin Chain Linkages in a PTM Context
This protocol uses linkage-specific tools to characterize the type of polyubiquitin chain formed on a substrate in response to an upstream PTM.
- In Vitro Ubiquitination Assay: Set up a reconstituted ubiquitination reaction containing E1, E2, E3, ubiquitin, ATP, and your purified POI. Pre-treat the POI with recombinant kinases or acetyltransferases to introduce the relevant PTM.
- Chain Linkage Deconvolution:
- Option A (DUB Treatment): After the reaction, split the sample and treat with linkage-specific deubiquitinases (DUBs). For example, OTUB1 is selective for Lys48-linked chains, while USP2 is more promiscuous but can cleave several types.
- Option B (Linkage-Specific Antibodies): Resolve the reaction by SDS-PAGE and perform Western blotting with a panel of linkage-specific ubiquitin antibodies (e.g., anti-K48, anti-K63, anti-K11).
- MS Confirmation (Optional): For highest precision, digest the ubiquitinated protein and analyze by LC-MS/MS using Absolute Quantification (AQUA) peptides with heavy isotopes to quantify the abundance of specific linkage signatures [71].
Expected Outcome: The pattern of DUB sensitivity or immunoreactivity with specific antibodies will reveal whether the upstream PTM (e.g., phosphorylation) directs the formation of a degradative K48-linked chain versus a non-degradative K63-linked chain.
The Scientist's Toolkit: Research Reagent Solutions
Table 2: Essential Reagents for Studying PTM Cross-Talk
| Reagent / Tool | Function in Experiment | Key Consideration |
|---|---|---|
| Linkage-Specific Ubiquitin Antibodies [71] | Detects specific polyubiquitin chain topologies (e.g., K48, K63) in Western blot or immunofluorescence. | Validation is critical. Confirm antibody specificity using cells expressing single linkage-type ubiquitin mutants. |
| Phosphatase & Deacetylase Inhibitors | Preserves the endogenous phosphorylation/acetylation state of proteins during cell lysis and protein purification. | Use broad-spectrum cocktails (e.g., PhosSTOP for phosphatases; Nicotinamide/Trichostatin A for deacetylases) to capture the native PTM landscape. |
| Tandem Ubiquitin-Binding Entities (TUBEs) [71] | Affinity purification of ubiquitinated proteins from cell lysates while shielding them from deubiquitinases (DUBs). | Prevents the loss of ubiquitin signals during sample preparation, providing a more accurate snapshot of the ubiquitome. |
| Recombinant Linkage-Specific DUBs [71] | Enzymatic tools to selectively cleave specific ubiquitin chain linkages from a substrate in vitro. | Used to deconvolute complex ubiquitin signals and confirm the chain type identified by antibodies or MS. |
| Isobaric Tagging Reagents (TMT, iTRAQ) [69] [70] | Enables multiplexed, quantitative proteomics for comparing PTM levels across multiple experimental conditions. | Allows simultaneous quantification of changes in phosphorylation, acetylation, and ubiquitination in a single experiment, ideal for cross-talk studies. |
Advanced Analytical Pathways
Diagram: PTM Cross-talk Interference on a Substrate Protein
Workflow: Integrated MS-Based Pipeline for Ubiquitin Site Mapping Amidst PTM Interference
This workflow details a mass spectrometry-based strategy to confidently identify ubiquitination sites while accounting for interference from phosphorylation and acetylation.
- Sample Preparation & Proteolytic Digestion: Generate complex protein lysates from your experimental conditions. Digest the proteins into peptides using trypsin, which cleaves C-terminal to arginine and lysine. Note: The ubiquitin remnant on a modified lysine (diGly) blocks tryptic cleavage at that site, yielding a characteristic signature peptide [69].
- Sequential PTM Enrichment (Critical Step):
- Step A: Depletion of Phosphopeptides/Acetyl-peptides. First, use immobilized metal affinity chromatography (IMAC) or titanium dioxide (TiO2) beads to enrich and remove phosphopeptides. Similarly, use anti-acetyl-lysine antibodies to deplete acetylated peptides. This streamlines the subsequent ubiquitin enrichment [69].
- Step B: Enrichment of Ubiquitinated Peptides. Use antibodies specific for the diGly lysine remnant to immunoaffinity purify the ubiquitinated peptides from the pre-cleared sample [70].
- LC-MS/MS Analysis: Separate the enriched peptides using nanoflow liquid chromatography and analyze them with a high-resolution tandem mass spectrometer.
- Data Analysis with Focused Searching:
- Search the MS/MS data against a protein database, specifying the diGly modification on lysine (+114.04293 Da) as a variable modification.
- To increase confidence and assignment speed, do not include common phosphorylation (S,T,Y) and acetylation (K) modifications in the same search. Instead, run separate searches for evidence of these potential interferers.
- Use AQUA (Absolute Quantification) peptides—synthetic heavy-isotope-labeled diGly peptides—as internal standards for absolute quantification of specific ubiquitination events [71] [69].
Expected Outcome: This sequential enrichment and focused data analysis strategy significantly reduces sample complexity and minimizes false-positive identifications, leading to a higher-confidence dataset of genuine ubiquitination sites.
Core Concepts: The Throughput-Specificity Trade-Off
What is the fundamental trade-off between throughput and specificity in ubiquitination site identification?
The core trade-off is between the number of ubiquitination sites you can identify (throughput) and the confidence you have that each identified site is genuine (specificity). High-throughput methods like immunoaffinity enrichment with pan-ubiquitin antibodies can capture thousands of potential sites but often include false positives from non-specific binding or co-enrichment of proteins from related signaling pathways (like the UPS). Conversely, highly specific methods, such as using linkage-specific antibodies (e.g., for K48 or K63 chains) or multiple sequential enrichment steps, yield higher confidence results but for a much smaller subset of sites, potentially missing biologically relevant but less abundant targets.
Why is improving specificity particularly crucial for drug discovery research?
Many diseases, including Alzheimer's and various cancers, are driven by specific dysregulated ubiquitination events [72] [73]. For example, targeting a specific deubiquitinase like USP11 requires a precise understanding of its substrate landscape [73]. If your identification method lacks specificity, you might pursue drug targets based on false-positive ubiquitination sites, leading to costly and time-consuming dead ends in the drug development pipeline. High-specificity data ensures that therapeutic interventions, such as small molecule inhibitors, are designed against biologically relevant pathways.
Experimental Methodologies for Balanced Workflows
The following table summarizes the key characteristics of common experimental approaches.
Table 1: Comparison of Ubiquitination Site Identification Methods
| Method | Typical Throughput | Specificity Level | Key Specificity Challenge |
|---|---|---|---|
| Pan-Ubiquitin Immunoaffinity | High (1000s of sites) | Low-Medium | Antibody cross-reactivity; co-purification of non-ubiquitinated proteins. |
| Linkage-Specific Immunoaffinity | Medium (100s of sites) | Medium-High | Limited to specific chain types (e.g., K48, K63); may miss other linkages. |
| Tandem Ubiquitin Binding Entities (TUBEs) | High | Low-Medium | Can protect chains from DUBs but may still bind non-specifically. |
| DiGly Antibody Enrichment (after trypsin digest) | High | Medium | Digestion may destroy context; antibody may not capture all modified peptides efficiently. |
Detailed Protocol: A Two-Stage Enrichment for Enhanced Specificity
This protocol aims to balance scale with confidence by combining a broad capture with a targeted refinement.
- Experiment: Sequential Ubiquitinome Enrichment for USP11 Substrate Identification [73].
- Objective: To identify high-confidence ubiquitination sites regulated by the deubiquitinase USP11, a target with implications in Alzheimer's disease and cancer.
Methodology:
- Cell Lysis and Protein Extraction: Lyse control and USP11-knockdown cells (using CRISPR-Cas9 as in [73]) in a buffer containing 50 mM Tris-HCl (pH 7.5), 150 mM NaCl, 1% Triton X-100, and protease/denaturant cocktail to preserve ubiquitination.
- Broad-Capture Immunoprecipitation (High-Throughput Phase): Incubate cleared lysates with agarose-conjugated pan-ubiquitin antibodies. Use control IgG beads to identify non-specific binders.
- Stringent Washes (Specificity Enhancement): Wash beads sequentially with lysis buffer, high-salt buffer (e.g., 500 mM NaCl), and a denaturing wash buffer (e.g., 0.5% SDS) to remove weakly associated proteins.
- On-Bead Trypsin Digestion: Digest the enriched proteins directly on the beads.
- Secondary Enrichment (High-Specificity Phase): Isolate the resulting peptides and subject them to a second round of enrichment using K-ε-GG (DiGly) remnant-specific antibodies. This step specifically isolates peptides that originally contained a ubiquitin modification.
- LC-MS/MS Analysis: Analyze the final peptide mixture using Liquid Chromatography with Tandem Mass Spectrometry.
Troubleshooting Guides and FAQs
FAQ 1: My ubiquitination site experiment identified a very high number of sites, but my negative controls also show many hits. What is the most likely cause and how can I fix it?
- Problem: Excessive non-specific binding, likely due to insufficiently stringent wash conditions or antibody cross-reactivity.
- Solution:
- Increase Wash Stringency: Add more rigorous wash steps, such as with high-salt buffers (e.g., 500 mM NaCl) or mild denaturants (e.g., 0.1-0.5% SDS).
- Optimize Antibody Amount: Use the minimum amount of antibody required for efficient capture to reduce non-specific binding.
- Include Better Controls: Always run a parallel sample with control IgG or from a ubiquitin-deficient system to baseline and subtract background signals.
FAQ 2: I am only interested in K48-linked polyubiquitination, but my data seems to contain other linkage types. How can I improve linkage specificity?
- Problem: The enrichment method (e.g., pan-ubiquitin antibody) is not selective for the ubiquitin linkage type of interest.
- Solution: Shift your primary enrichment strategy to use linkage-specific reagents. Employ antibodies or binding proteins (e.g., TUBEs) specifically validated for K48 linkages. This will drastically reduce the identification of sites modified with K63 or other chain types.
FAQ 3: My mass spectrometry data has low spectral counts for my peptides of interest, making it hard to validate targets. How can I improve recovery?
- Problem: Low abundance of ubiquitinated peptides due to poor enrichment efficiency, sample loss during multiple steps, or enzymatic deubiquitination during preparation.
- Solution:
- Use DUB Inhibitors: Include a broad-spectrum deubiquitinase (DUB) inhibitor (e.g., PR-619) in your lysis and initial incubation buffers.
- Scale Up Input Material: Increase the amount of starting protein (e.g., from 10 mg to 20 mg) to enhance the detection of low-abundance modifications.
- Evaluate Digestion Efficiency: Optimize trypsin digestion time and enzyme-to-substrate ratio to ensure complete digestion without excessive processing time that can lead to degradation.
The Scientist's Toolkit: Essential Research Reagents
Table 2: Key Reagent Solutions for Ubiquitination Site Identification
| Research Reagent | Function / Application | Key Consideration for Specificity |
|---|---|---|
| Pan-Ubiquitin Antibodies | Immunoaffinity enrichment of all ubiquitinated proteins/peptides. | A major source of cross-reactivity; requires rigorous validation and stringent washes. |
| K-ε-GG (DiGly) Antibodies | Enrichment of tryptic peptides containing the di-glycine remnant left after ubiquitination. | Critical for MS-based workflows; specificity is highly dependent on antibody quality. |
| Linkage-Specific Ubiquitin Antibodies | Selective isolation of proteins/peptides with specific polyubiquitin linkages (K48, K63). | Directly addresses the specificity requirement for linkage-dependent biological questions. |
| Tandem Ubiquitin Binding Entities | High-affinity capture of polyubiquitinated proteins; can protect chains from DUBs. | Can improve yield but may not differentiate between linkage types as well as antibodies. |
| Deubiquitinase (DUB) Inhibitors | Prevents the loss of ubiquitin signals during sample preparation by inhibiting endogenous DUBs. | Essential for maintaining the native ubiquitome and improving throughput by preventing signal loss. |
| USP11 Inhibitors (e.g., UC495) | A specific pharmacological tool to modulate USP11 activity in functional studies [73]. | Allows for validation of substrates by observing changes in ubiquitination upon inhibition. |
Workflow and Pathway Visualizations
Ubiquitin Proteasome System Pathway
Benchmarking Ubiquitination Tools: Performance Metrics and Validation Frameworks
In the field of ubiquitination site identification, researchers increasingly rely on machine learning models to predict modification sites from protein sequences. The assessment of these models often hinges on key performance metrics such as the Area Under the ROC Curve (AUC-ROC), Matthews Correlation Coefficient (MCC), and Accuracy. However, a significant challenge arises from the natural imbalance in biological datasets, where ubiquitination sites (positive class) are vastly outnumbered by non-ubiquitination sites (negative class). This technical guide addresses common experimental issues and provides clarity on selecting the right evaluation metrics for both balanced and imbalanced data scenarios in ubiquitination research.
Frequently Asked Questions & Troubleshooting
FAQ 1: My model for predicting ubiquitination sites achieves 98% accuracy. Why is my biologist collaborator unsatisfied with this result?
- Problem: High accuracy can be misleading on imbalanced datasets. In ubiquitination prediction, non-sites (majority class) may constitute over 90% of your data. A model that simply predicts "non-site" for every sequence can achieve high accuracy but is scientifically useless.
- Diagnosis: You are likely relying solely on Accuracy, which is a poor metric for imbalanced datasets [74]. Your model is probably failing to identify the ubiquitination sites (the minority class of interest), a fact masked by the high accuracy.
- Solution: Shift your focus to metrics that are robust to class imbalance.
- Primary Recommendation: Use the Matthews Correlation Coefficient (MCC). It considers all four categories of the confusion matrix (true positives, true negatives, false positives, false negatives) and provides a reliable score even when the class sizes are very different [75] [76]. A value of +1 represents a perfect prediction, 0 represents no better than random, and -1 represents total disagreement.
- Secondary Recommendation: Analyze the Precision-Recall Curve (PR-AUC). Unlike ROC-AUC, the PR curve is highly sensitive to class imbalance and directly reflects the model's performance on the positive class (ubiquitination sites), making it ideal for "needle in a haystack" problems [77] [76].
FAQ 2: I've read that ROC-AUC is the best metric. Why does it consistently give me a high score (~0.95) even when my model performs poorly in practice?
- Problem: The Receiver Operating Characteristic Area Under the Curve (ROC-AUC) can produce "overly optimistic" or inflated scores on imbalanced datasets [76].
- Diagnosis: ROC-AUC measures the model's ability to rank a positive instance higher than a negative instance. In a severe imbalance, a large number of true negatives can dominate the calculation, making the score appear high even if the model misses a significant number of true positives (ubiquitination sites) [76] [78]. This creates a ceiling effect, obscuring differences between models.
- Solution: Do not use ROC-AUC alone. For a comprehensive assessment on imbalanced data:
- Use MCC or F2-score for a single-threshold evaluation that aligns with deployment costs [76].
- Use PR-AUC for a threshold-independent evaluation focused on the positive class [77] [78].
- Consider the H-measure, which explicitly incorporates the costs of misclassification, providing a more realistic performance estimate for real-world applications [76].
FAQ 3: How do I know if my dataset is "imbalanced" enough to require these alternative metrics?
- Problem: The line between "moderately balanced" and "severely imbalanced" is not always clear.
- Diagnosis & Solution: As a rule of thumb, if the minority class (e.g., ubiquitination sites) constitutes less than 5-10% of your total data, you are likely in a severely imbalanced regime where standard accuracy becomes unreliable [76]. For instance, in a benchmark study, metrics like MCC and F2-score showed higher discriminative power than ROC-AUC for positive class ratios below 3% [76]. It is always good practice to report multiple metrics to provide a complete picture of your model's performance.
The table below summarizes the core characteristics and recommended use cases for each metric.
| Metric | Full Name | Value Range | Ideal for Balanced Data? | Ideal for Imbalanced Data? | Key Consideration in Ubiquitination Research |
|---|---|---|---|---|---|
| Accuracy | Accuracy | 0 to 1 | Yes | No [74] | Misleadingly high if non-sites dominate the dataset. Avoid as a primary metric. |
| ROC-AUC | Receiver Operating Characteristic - Area Under Curve | 0 to 1 (0.5=random) | Yes | Use with caution [76] | Can be optimistic; less discriminative for rare ubiquitination sites [76]. |
| PR-AUC | Precision-Recall - Area Under Curve | 0 to 1 | Yes | Yes [77] [74] | Directly evaluates performance on the ubiquitination site class. Preferred over ROC-AUC for imbalance. |
| MCC | Matthews Correlation Coefficient | -1 to +1 (0=random) | Yes | Yes [75] [76] | A balanced metric that considers all confusion matrix categories. Highly recommended. |
The following table illustrates how these metrics can tell different stories on the same dataset, using a real-world example from ubiquitination site prediction.
Table 2: Case Study - Ubigo-X Model Performance on Different Data Distributions
This table synthesizes findings from a 2025 study on the Ubigo-X ubiquitination site prediction tool, tested on independent datasets with different class ratios [79].
| Test Dataset Description | Positive:Negative Ratio | Accuracy | ROC-AUC | PR-AUC | MCC |
|---|---|---|---|---|---|
| Balanced Test Data | ~1:1 (65k:61k) | 0.79 | 0.85 | Not Reported | 0.58 |
| Imbalanced Test Data | 1:8 | 0.85 | 0.94 | Not Reported | 0.55 |
| Interpretation | |||||
| The increase in Accuracy and ROC-AUC on the imbalanced data could be misleading, suggesting better performance. | :arrowupsmall: | :arrowupsmall: | |||
| The stability of the MCC score provides a more truthful assessment, indicating consistent model quality across different data distributions. | :heavyminussign: |
| Item / Resource | Function in Research | Example in Context |
|---|---|---|
| PLMD 3.0 | A specialized database providing comprehensive protein lysine modification data, used as a gold standard for training models. | Served as the primary source of verified ubiquitination sites for training the Ubigo-X predictor [79]. |
| PhosphoSitePlus | A knowledge base of post-translational modifications, often used as an independent test set to validate model predictions on unseen data. | Used to benchmark the generalizability of the Ubigo-X model on both balanced and imbalanced data splits [79]. |
| CD-HIT / CD-HIT-2d | Bioinformatics tools for sequence filtering and redundancy reduction. Critical for creating non-redundant training and test sets to prevent model overfitting. | Applied to filter out sequences with >30% identity and remove negative samples highly similar to positives in the Ubigo-X study [79]. |
| SMOTE & ADASYN | Algorithms for synthetic minority oversampling. They generate artificial positive-class instances to balance imbalanced training datasets. | Can be used in preprocessing to artificially increase the number of ubiquitination sites, helping the model learn the minority class better [74] [76]. |
Experimental Protocols & Workflows
Protocol 1: A Robust Model Evaluation Framework for Imbalanced Data
This protocol outlines a comprehensive strategy for evaluating ubiquitination site prediction models, moving beyond a single metric.
- Data Preparation: Partition your data into training, validation, and test sets. Ensure the test set reflects the true, imbalanced class distribution expected in nature [74].
- Model Training: Train your model (e.g., CNN, SVM, XGBoost) on the training set. Consider applying techniques like class weighting in the loss function to penalize misclassifications of the minority class more heavily [74].
- Multi-Metric Evaluation on Validation Set: Calculate all the following metrics on the validation set:
- MCC: For a holistic, single-value assessment [75].
- Fβ-score (e.g., F2-score): If recall is more critical than precision (i.e., finding all true sites is more important than a few false positives), use a β>1 [76].
- PR-AUC: For a threshold-independent view of the trade-off between precision and recall [77].
- ROC-AUC: Report it, but interpret it cautiously alongside the other metrics [76].
- Threshold Selection: Based on the PR curve and your research goal (maximizing precision vs. recall), select an optimal classification threshold. Do not blindly use 0.5 [74].
- Final Assessment: Apply the final model and chosen threshold to the held-out test set and report all metrics from Step 3 to provide a complete, unbiased performance picture.
Diagram 1: Metric Selection for Imbalanced Datasets
Accurately identifying ubiquitination sites and their functional outcomes is fundamental to understanding cellular regulation and developing targeted therapies. Traditional methods often struggle with specificity due to the complex cross-reactivity of the ubiquitination machinery and the low stoichiometry of this modification. This technical support guide outlines contemporary orthogonal methods and confirmatory assays designed to overcome these challenges, providing a framework for robust experimental validation within a thesis focused on improving the specificity of ubiquitination site identification.
Core Principles of Orthogonal Validation
An orthogonal validation strategy uses multiple, independent experimental lines of evidence to confirm a specific ubiquitination event. This multi-pronged approach is critical for distinguishing true substrates from background noise and indirect effects.
Key Questions to Guide Experimental Design:
Q1: What is the core principle behind using orthogonal methods for ubiquitination studies?
- A: Orthogonal methods isolate the ubiquitination activity of a specific E1-E2-E3 enzyme cascade from the highly interconnected native cellular network. By creating engineered, non-cross-reacting components, researchers can exclusively track ubiquitin transfer from a single E3 ligase to its direct substrates, eliminating false positives from indirect regulation or overlapping enzyme activities [80] [81].
Q2: When should I consider implementing an orthogonal strategy in my research?
- A: You should consider an orthogonal approach when:
- Identifying direct substrates of a specific E3 ligase.
- Working with E3 ligases that have overlapping functions with other enzymes.
- Traditional methods, such as co-immunoprecipitation or global ubiquitin profiling, yield a high number of potential hits that require rigorous validation.
- You need to rule out that observed ubiquitination is not an indirect consequence of downstream signaling or compensatory cellular mechanisms.
- A: You should consider an orthogonal approach when:
Key Orthogonal Methodologies and Protocols
This section details two powerful orthogonal methods, their workflows, and the essential reagents required.
Methodology 1: Orthogonal Ubiquitin Transfer (OUT)
The OUT cascade is a fully engineered system that uses mutant ubiquitin and enzymes to track substrates of a single E3 ligase [80] [81].
Experimental Workflow:
Detailed Protocol:
- Component Engineering: Generate mutant ubiquitin (xUB) with residues like R42E and R72E to prevent activation by wild-type E1. Engineer matching xE1, xE2, and xE3 enzymes with complementary mutations to create a closed, functional cascade [80] [81].
- Cellular Expression: Co-express the engineered OUT components (xUB, xE1, xE2, xE3) in your cell model (e.g., HEK293 cells).
- Cascade Operation: The orthogonal cascade activates and transfers xUB exclusively to the substrates of the engineered xE3 ligase.
- Substrate Pull-Down: Harvest cells and perform affinity purification under denaturing conditions using tags on xUB (e.g., His-tag, Strep-tag) to isolate proteins conjugated with xUB [36].
- Substrate Identification: Digest purified proteins and analyze peptides by liquid chromatography-tandem mass spectrometry (LC-MS/MS). Identify xUB-modified substrates by searching for peptides containing the xUB sequence or the characteristic diglycine (K-ε-GG) remnant on substrate lysines [36] [82].
Methodology 2: Ubi-Tagging for Defined Conjugates
Ubi-tagging is a modular technique that uses natural ubiquitination enzymes to create site-specific, multivalent antibody conjugates or labeled proteins [52].
Experimental Workflow:
Detailed Protocol:
- Design Building Blocks:
- Donor Ubi-tag (Ubᴅᴏɴ): A protein of interest (e.g., Fab’ fragment, nanobody) fused to a ubiquitin mutant (e.g., K48R) that has a free C-terminal glycine but cannot form homopolymers [52].
- Acceptor Ubi-tag (Ubᴀᴄᴄ): A payload (e.g., fluorescent dye, peptide, another protein) fused to a ubiquitin mutant with an active conjugation lysine (e.g., K48) but a blocked C-terminus (e.g., ΔGG, His-tag) [52].
- Conjugation Reaction: Incubate Ubᴅᴏɴ and Ubᴀᴄᴄ with recombinant E1 enzyme and a linkage-specific E2-E3 fusion enzyme (e.g., gp78RING-Ube2g2 for K48-linkage) in reaction buffer with ATP for 30-60 minutes at 30°C [52].
- Product Purification: Purify the conjugated product using standard techniques like protein G or nickel-NTA affinity chromatography [52].
- Validation: Confirm conjugation efficiency and homogeneity using SDS-PAGE, Western blotting, and ESI-TOF mass spectrometry. Validate functionality using flow cytometry or other activity assays [52].
Troubleshooting Guides and FAQs
Common Issues and Solutions in Orthogonal Ubiquitination Studies
| Problem Area | Specific Issue | Potential Cause | Suggested Solution |
|---|---|---|---|
| Low Yield/ Efficiency | Poor conjugation in ubi-tagging | Incorrect enzyme stoichiometry | Titrate E1 and E2/E3 enzymes. Use a 5:1 molar excess of Ubᴀᴄᴄ to Ubᴅᴏɴ [52]. |
| No substrate identification in OUT | Inefficient cellular expression of OUT components | Optimize transfection; use codon-optimized genes; verify component expression with Western blot [80]. | |
| Specificity Concerns | High background in MS | Non-specific binding during affinity purification | Include stringent washes (e.g., with 6 M Guanidine-HCl); use control cells lacking the xE3 [36] [80]. |
| Off-target ubiquitination | Incomplete orthogonality of engineered components | Re-engineer interface mutations; use more specific E2-E3 pairs [81]. | |
| Technical Challenges | Low abundance of ubiquitinated peptides | Masking by non-modified peptides | Enrich modified peptides using K-GG immunoaffinity purification prior to MS [36] [82]. |
| Difficulty detecting labile sites | Rapid deubiquitination | Treat cells with deubiquitinase (DUB) inhibitors prior to lysis [14]. |
Frequently Asked Questions
Q3: My orthogonal system validates an E3 substrate in cells, but I cannot detect its ubiquitination in vitro. Why?
- A: The cellular environment provides essential co-factors, specific phosphorylation events, or optimal subcellular localization that may be absent in a purified in vitro system. Confirm that your in vitro reaction contains all necessary components and that the substrate is in its native, properly folded state.
Q4: How can I confirm that the ubiquitination sites I mapped are functional and not bystander modifications?
- A: Combine site-specific mutagenesis with functional assays. Mutate the identified lysine residue(s) to arginine and test for functional consequences, such as changes in protein stability (via cycloheximide chase assays), localization, or interaction with binding partners. Low stoichiometry (often <1%) is common, so functional readouts are key [14] [10].
Q5: What are the best practices for quantifying ubiquitination site occupancy?
- A: Use quantitative proteomics methods like SILAC (Stable Isotope Labeling by Amino Acids in Cell Culture) or TMT (Tandem Mass Tagging) in conjunction with K-GG enrichment. This allows you to compare ubiquitination levels at specific sites across different conditions (e.g., with/without proteasome inhibitor, wild-type vs. E3 knockout) [18] [14]. Remember that occupancy is typically very low, spanning over four orders of magnitude with a median much lower than phosphorylation [14].
Research Reagent Solutions
A summary of key reagents used in the featured methodologies is provided below for easy reference.
| Reagent / Tool | Function in Experiment | Key Considerations |
|---|---|---|
| Engineered Ubiquitin (xUB) | Core component of OUT; contains mutations (e.g., R42E, R72E) for orthogonality [80] [81]. | Must be paired with matching engineered E1. |
| Recombinant E1, E2, E3 Enzymes | Catalyze the ubiquitination cascade. E2-E3 fusions (e.g., gp78RING-Ube2g2) enhance efficiency and linkage specificity [52]. | Purity and activity are critical for in vitro efficiency. |
| Linkage-Specific Antibodies | Immuno-enrichment of proteins or peptides with specific ubiquitin chain linkages (e.g., K48, K63) [36] [18]. | Quality varies between vendors; check specificity for enrichment, not just blotting. |
| K-GG Motif Antibodies | Immunoaffinity enrichment of ubiquitinated peptides from complex digests for mass spectrometry [36] [82]. | Essential for high-sensitivity site mapping. |
| Tandem Ubiquitin-Binding Entities (TUBEs) | Affinity resins to enrich polyubiquitinated proteins from lysates, protecting them from deubiquitinases [36]. | Useful for stabilizing labile ubiquitination events. |
| Deubiquitinase (DUB) Inhibitors | Added to cell lysis buffers to prevent loss of ubiquitin signals during sample preparation [14]. | A cocktail of inhibitors is often necessary. |
Frequently Asked Questions: Troubleshooting Your Ubiquitination Site Prediction
Q1: My research focuses on human proteins. Which predictor is most suitable and why? A1: For human-specific research, hCKSAAPUbSite is the most suitable choice. It was specifically trained to address the fact that sequence patterns around ubiquitination sites are not conserved across species [83] [84]. A predictor trained on yeast data, for instance, will yield lower accuracy on human proteins. hCKSAAPUbSite integrates multiple feature encodings optimized for human ubiquitination site contexts, providing a more reliable prediction for this specific organism [84].
Q2: I am getting too many false positives. How can I improve the specificity of my predictions? A2: You can tackle this by:
- Utilizing Confidence Scores: Tools like UbPred provide low, medium, and high-confidence predictions. Filtering your results to include only medium or high-confidence scores can significantly improve specificity. For example, UbPred's high-confidence threshold (score ≥ 0.84) offers a specificity of 98.9%, albeit with a trade-off in sensitivity [85].
- Leveraging Ensemble Methods: The newest tool, Ubigo-X, uses a weighted voting strategy that combines multiple models. This approach has demonstrated superior performance on balanced datasets, achieving an AUC of 0.85 and an MCC of 0.58, which indicates a better balance between sensitivity and specificity compared to older tools [79] [33].
Q3: I need to analyze a proteome-scale dataset. Are there any tools designed for high-throughput prediction? A3: Yes, UbPred offers a stand-alone version for Linux and Windows that you can download and install on your local workstation [85]. This allows you to run large-scale predictions without being limited by web server queue restrictions. Additionally, the algorithm behind CKSAAP_UbSite is noted for its computational efficiency, making it suitable for processing large numbers of sequences [83].
Q4: What is the most advanced predictor currently available, and what makes it different? A4: Ubigo-X (2025) represents the current state-of-the-art. Its key innovation is the use of image-based feature representation. It transforms protein sequence features into image-like formats, which are then processed by a deep Resnet34 model. This allows the algorithm to capture spatial and hierarchical relationships in the data that are missed by traditional methods. Its ensemble design, which also includes structural and functional features trained with XGBoost, contributes to its robust performance across different testing scenarios [79].
Experimental Protocols for Cited Tools
Protocol 1: Ubiquitination Site Prediction Using Ubigo-X This protocol outlines the steps to use the Ubigo-X web server for predicting ubiquitination sites using its ensemble learning model [79] [34].
- Access the Tool: Navigate to the Ubigo-X webserver at http://merlin.nchu.edu.tw/ubigox/.
- Input Sequence: Paste your protein sequence in FASTA format into the designated input field. The sequence should be at least 25 residues long and contain at least one lysine (K).
- Submit for Analysis: Initiate the prediction. The server will process the sequence through its three sub-models:
- Single-Type SBF: Uses AAC, AAindex, and one-hot encoding, transformed into image-based features.
- Co-Type SBF: Uses k-mer encoding of sequence features, also transformed into images.
- S-FBF: Uses structural and functional features (secondary structure, solvent accessibility).
- Receive Results: The final prediction is generated by a weighted voting strategy of the three sub-models. Interpret the results, which typically include a binary classification (ubiquitination/non-ubiquitination) and a prediction score.
Protocol 2: Ubiquitination Site Prediction Using UbPred This protocol describes the procedure for using the UbPred predictor, which is based on a random forest algorithm [11] [85].
- Access the Tool: Go to the UbPred website at http://www.ubpred.org.
- Input Sequence: Submit a single protein sequence in FASTA format. The sequence must be 25 residues or longer and contain at least one lysine (K). Note that only the 20 conventional amino acids are supported; ambiguous symbols (B, J, O, U, X, Z) will cause an error.
- Await Processing: As UbPred uses evolutionary features from PSSM profiles generated by PSI-BLAST, processing may take up to 45 minutes for a new sequence. Results are typically sent via email.
- Interpret Results: The output includes the position, a ubiquitination score (0-1), and a binary annotation. Use the provided confidence thresholds (Low: 0.62-0.69, Medium: 0.69-0.84, High: 0.84-1.00) to filter your results based on the required specificity [85].
The Scientist's Toolkit: Research Reagent Solutions
Table: Essential Resources for Ubiquitination Site Prediction Research
| Item | Function in Research | Example / Key Feature |
|---|---|---|
| PLMD 3.0 Database | A key source of training data for predictors; contains protein sequences with known ubiquitination sites [79]. | Used to train Ubigo-X [79] [33]. |
| PhosphoSitePlus Data | Serves as a resource for independent testing and validation of prediction algorithms [79]. | Used for independent testing of Ubigo-X performance [79]. |
| CD-HIT & CD-HIT-2d | Software utilities for sequence filtering to reduce redundancy and minimize overfitting in training datasets [79]. | Used to filter positive and negative training samples for Ubigo-X [79]. |
| AAindex Database | A compilation of numerical indices representing the physicochemical and biochemical properties of amino acids [79] [86]. | Used for feature encoding in Ubigo-X, CKSAAP_UbSite, and others [79] [84]. |
| ESM2 (Model) | A large, pretrained protein language model used to extract rich, informative features from amino acid sequences without manual engineering [87]. | Used by the EUP tool for cross-species ubiquitination prediction [87]. |
Performance and Algorithm Comparison
Table 1: Comparative Analysis of Ubiquitination Site Prediction Tools
| Feature | Ubigo-X (2025) | UbPred (2010) | CKSAAPUbSite (2011) / hCKSAAPUbSite |
|---|---|---|---|
| Core Algorithm | Ensemble (Weighted Voting) of ResNet34 & XGBoost [79] | Random Forest [11] | Support Vector Machine (SVM) [83] [84] |
| Key Innovation | Image-based feature representation from sequences [79] | Integration of sequence attributes and evolutionary profiles [11] | Composition of k-spaced amino acid pairs (CKSAAP) [83] |
| Feature Encoding | Integrated: AAC, AAindex, one-hot, k-mer, structural & functional features [79] | AA composition, PCPs, PSSM conservation scores, disorder scores [11] [86] | CKSAAP, Binary encoding, AAindex physicochemical properties, aggregation propensity [84] |
| Typical Performance (Balanced Data) | AUC: 0.85, ACC: 0.79, MCC: 0.58 [79] | AUC: 0.80, CBA: 0.72 [11] | Yeast: ACC: 73.40%, MCC: 0.47 [83]; Human: AUC: 0.757 [84] |
| Primary Strength | High performance on balanced data; novel image-based approach captures complex patterns [79] | Provides well-calibrated confidence levels for predictions; stand-alone version available [85] | Computational efficiency; effective for species-specific prediction (e.g., hCKSAAP_UbSite for human) [83] [84] |
| Primary Limitation | Model complexity may reduce interpretability for end-users. | Older model; may not incorporate latest data and deep learning advancements. | Performance can be limited compared to modern ensemble or deep learning methods [79]. |
Table 2: Summary of Key Performance Metrics from Search Results
| Tool | Key Metric 1 | Key Metric 2 | Key Metric 3 | Testing Dataset |
|---|---|---|---|---|
| Ubigo-X | AUC: 0.94 (Imbalanced) [79] | MCC: 0.58 (Balanced) [79] | ACC: 0.85 (Imbalanced) [79] | PhosphoSitePlus (Filtered) |
| UbPred | AUC: 0.80 [11] | Class-Balanced Accuracy: 72% [11] | High-Confidence Specificity: 98.9% [85] | Yeast Proteome |
| CKSAAP_UbSite | Accuracy: 73.40% [83] | MCC: 0.47 [83] | N/A | Yeast (Radivojac dataset) |
Workflow and Logical Diagrams
Ubigo-X Ensemble Prediction Workflow
CKSAAP_UbSite and hCKSAAP_UbSite Methodology
The precise identification of ubiquitination sites is fundamental to understanding the complex regulatory networks that govern protein degradation, signaling, and cellular homeostasis. Researchers in drug development face a challenging landscape when selecting the optimal methodological approach, as each technique offers distinct advantages and limitations. This technical support resource compares three core methodologies—Mass Spectrometry (MS), Antibody-Based, and Proximity Labeling (PL) approaches—framed within the context of improving specificity in ubiquitination site identification.
The following diagram illustrates the logical decision pathway for selecting the appropriate method based on key research objectives:
Technical Comparison of Core Methodologies
Performance Characteristics at a Glance
Table 1: Quantitative Comparison of Key Methodological Performance Metrics
| Performance Metric | Mass Spectrometry | Antibody-Based | Proximity Labeling |
|---|---|---|---|
| Specificity | High (sequence-level) | Moderate to High (epitope-dependent) | Moderate (nanometer proximity) |
| Temporal Resolution | Minutes (APEX) to hours (BioID) [88] [89] | Hours | 1 minute (APEX2) to 24 hours (BioID) [90] [89] |
| Spatial Resolution | Not inherent (requires fractionation) | ~10-15 nm (for AAPL) [91] | 10-20 nm radius [88] [89] |
| Labeling Radius | Not applicable | Not applicable | 10-20 nm [88] [89] |
| Ability to Capture Weak/Transient Interactions | Limited | Limited | Excellent [88] [92] |
| Required Starting Material | High (mg range) | Moderate | Low (2×10⁷ cells for AMPL-MS) [93] |
| Endogenous Context Preservation | Low (cell lysis required) | Low to Moderate | High (works in living cells) [94] [92] |
Operational Characteristics and Requirements
Table 2: Method-Specific Operational Requirements and Outputs
| Operational Aspect | Mass Spectrometry | Antibody-Based | Proximity Labeling |
|---|---|---|---|
| Primary Enzymes/Tags | Not applicable | Primary & secondary antibodies | BioID, TurboID, APEX/APEX2, HRP [95] [92] |
| Key Reagents | Trypsin, LC columns | Specific antibodies, Protein A/G | Biotin-phenol (APEX), Biotin (BioID) [95] [89] |
| Typical Labeling Time | Not applicable | 1-2 hours | 1 min (APEX) - 24 hrs (BioID) [89] |
| Enrichment Strategy | SCX, TiO₂, immunoaffinity | Immunoprecipitation | Streptavidin/neutravidin beads [88] [89] |
| Compatibility with Live Cells | No | No (except membrane targets) | Yes [94] [92] |
| Key Output | Peptide sequences & modifications | Protein identification & localization | Proteomic neighborhood maps |
Frequently Asked Questions (FAQs) and Troubleshooting Guides
Method Selection and Experimental Design
FAQ 1: How do I choose between BioID, APEX, and TurboID for my ubiquitination proximity labeling study?
Each system has distinct advantages depending on your experimental needs and model system. TurboID offers rapid labeling (10 minutes) but can cause background due to endogenous biotinylation and potential cell stress [94] [89]. APEX/APEX2 provides excellent temporal control (1-minute labeling) but requires hydrogen peroxide, which can be toxic to cells [90] [89]. BioID has slower kinetics (18-24 hours) but uses non-toxic biotin and is well-established for many applications [95] [89]. For sensitive systems or in vivo work, TurboID may be preferable despite its background issues, while APEX2 is ideal for capturing rapid, dynamic interactions in robust cell systems.
FAQ 2: What are the key considerations for improving specificity in ubiquitination site identification?
- For Mass Spectrometry: Utilize peptide-level enrichment rather than protein-level enrichment to directly identify biotinylation sites and reduce false positives [88] [94].
- For Antibody-Based Approaches: Ensure antibody specificity through proper validation, including knockdown/knockout controls when possible.
- For Proximity Labeling: Implement stringent controls including bait-free controls, catalytically dead enzymes, and subcellular localization controls to distinguish true interactors from background [88].
- Across All Methods: Combine complementary approaches (e.g., PL for discovery followed by MS validation) to confirm findings and reduce false positives.
Technical Troubleshooting
FAQ 3: I'm observing high background labeling in my proximity labeling experiment. How can I address this?
High background is a common challenge in PL experiments. Implement these troubleshooting steps:
- Optimize Expression Levels: High expression of your bait-PL fusion protein can increase non-specific labeling. Titrate expression to the lowest detectable level that still provides sufficient signal [88].
- Adjust Labeling Time: For TurboID, reduce labeling time from 10 minutes to 5 minutes; for BioID, reduce from 24 hours to 6-8 hours [94] [89].
- Use Cleavable Biotin Probes: These allow more stringent washing conditions to reduce background [88].
- Remove Endogenous Biotinylated Proteins: Mitochondrial carboxylases contribute significantly to background. Consider genetic tagging or antibody-based depletion strategies for these proteins [94].
- Validate with Orthogonal Methods: Confirm putative interactions through co-immunoprecipitation or other complementary approaches [94].
FAQ 4: My antibody-based proximity labeling yields insufficient signal. What optimization steps should I take?
Antibody-mediated proximity labeling (such as AMPL-MS) requires careful optimization:
- Antibody Validation: Ensure your primary antibody specifically recognizes the target epitope in native conditions. Test multiple antibodies if available [93].
- Enzyme Conjugation Efficiency: For pre-conjugated systems, verify the enzyme-to-antibody ratio and enzymatic activity.
- Substrate Concentration: Titrate biotin-phenol (for APEX-based) or biotin (for BioID-based) concentrations to find the optimal signal-to-noise ratio [93] [90].
- Permeabilization Conditions: For intracellular targets, optimize permeabilization to allow antibody and substrate access while maintaining cellular integrity [93].
Essential Research Reagent Solutions
Table 3: Key Research Reagents for Proximity Labeling Applications
| Reagent Category | Specific Examples | Function & Application |
|---|---|---|
| Proximity Enzymes | BioID, TurboID, APEX2 [95] [92] | Genetically encodable enzymes that catalyze biotinylation of proximate proteins |
| Biotin Substrates | Biotin (for BioID/TurboID), Biotin-phenol (for APEX) [95] [89] | Enzyme substrates that become reactive intermediates for labeling |
| Enrichment Matrices | Streptavidin-coated beads, Neutravidin beads [88] [89] | High-affinity capture of biotinylated proteins for purification |
| Activation Reagents | Hydrogen peroxide (APEX), D-alanine (iAPEX) [90] | Triggers enzymatic activity for controlled labeling |
| Specificity Controls | Catalytically dead mutants, Empty vector controls [88] | Essential for distinguishing specific labeling from background |
Advanced Applications and Integrated Workflows
Emerging Technologies and Future Directions
Recent advancements are addressing key limitations in proximity labeling technologies. The newly developed iAPEX (in situ APEX activation) system uses a D-amino acid oxidase (DAAO) to locally generate hydrogen peroxide, eliminating the need for toxic exogenous H₂O₂ addition and reducing background from endogenous peroxidases [90]. This system enables applications in cell types previously incompatible with conventional APEX2 labeling and shows promise for in vivo applications [90].
For ubiquitination studies specifically, integrating multiple approaches provides the most comprehensive insights. The following workflow diagram illustrates how these methods can be combined for optimal results:
The Antibody-Mediated Proximity Labeling coupled to Mass Spectrometry (AMPL-MS) protocol offers particular advantages for studying ubiquitination in specific chromatin domains [93]. This method does not require expression of fusion proteins, making it versatile for various targets.
Key Protocol Steps:
- Cell Preparation: Isolate nuclei and permeabilize to allow antibody access.
- Antibody Incubation: Apply primary antibody against your target protein or specific histone modification.
- Enzyme Conjugation: Incubate with protein A–Apex2 fusion protein.
- Proximity Labeling: Activate with biotin-phenol and hydrogen peroxide (1 minute).
- Protein Extraction and Capture: Lyse cells and enrich biotinylated proteins using streptavidin beads.
- Mass Spectrometry Analysis: Process enriched proteins for LC-MS/MS identification.
Critical Optimization Parameters:
- Use extensive washing after pA-APEX2 incubation to reduce background [93]
- Compare results to controls without primary antibody to identify specific interactions
- Process samples from as few as 2×10⁷ cells due to high sensitivity of the method [93]
This technical support resource provides a foundation for selecting and optimizing methodological approaches for ubiquitination site identification. The rapidly evolving landscape of these technologies, particularly proximity labeling, continues to offer new opportunities for enhancing specificity and physiological relevance in ubiquitination research.
FAQs: Ubiquitination Site Identification
FAQ 1: What are the most common causes of low ubiquitinated protein yield during enrichment?
Low yield is frequently due to the low natural stoichiometry of protein ubiquitination and the rapid reversal of this modification by deubiquitinases (DUBs) during sample preparation [36]. To mitigate this, include DUB inhibitors in your lysis buffer, perform rapid sample processing at low temperatures, and use sufficient amounts of affinity resin relative to your protein lysate.
FAQ 2: How do I choose between ubiquitin tagging, antibody-based, and Ub-binding domain (UBD)-based enrichment methods?
The choice depends on your experimental system and goals. Ubiquitin tagging (e.g., His- or Strep-tagged Ub) is cost-effective and easy but requires genetic manipulation and may not perfectly mimic endogenous Ub [36]. Antibody-based approaches (e.g., using P4D1 or FK2 antibodies) work on endogenous proteins and native tissues and can be used with linkage-specific antibodies, though they can be costly and prone to non-specific binding [36]. UBD-based approaches use tandem-repeated Ub-binding domains to enrich native ubiquitinated proteins, but single UBDs may have low affinity [36].
FAQ 3: My mass spectrometry data shows many non-ubiquitin peptides after enrichment. How can I improve specificity?
High background noise often stems from non-specific binding to the enrichment resin. Increase the number and stringency of wash steps. For His-tag purifications, include low concentrations of imidazole in wash buffers to reduce co-purification of histidine-rich proteins. For Strep-tag systems, ensure the Strep-Tactin resin is fresh and not overloaded [36].
FAQ 4: What are the key controls for validating a putative ubiquitination site?
Essential controls include mutating the putative lysine residue to arginine (K-to-R) to see if ubiquitination is abolished, and treating samples with a deubiquitinase (DUB) post-enrichment as a negative control [36]. A positive control, such as a known ubiquitinated protein, should be included in the experimental setup.
Troubleshooting Guide
Problem 1: Inconsistent Ubiquitination Site Identification by MS
Symptoms: Large variation in the number of identified ubiquitination sites between technical replicates of the same sample.
| Possible Cause | Diagnostic Steps | Corrective Action |
|---|---|---|
| Incomplete Proteolytic Digestion | Check MS data for missed cleavage sites; run SDS-PAGE to visualize digestion efficiency. | Optimize trypsin-to-protein ratio; ensure denaturation and reduction/alkylation steps are complete. |
| Sample Loss During Desalting | Measure peptide recovery using a colorimetric assay. | Use low-binding tubes; do not over-dry peptides; use appropriate desalting columns. |
| LC-MS/MS Instrument Variability | Run a standard ubiquitinated protein digest to assess instrument performance. | Schedule instrument maintenance; calibrate MS; use consistent LC gradients. |
Problem 2: Failure to Detect Specific Ubiquitin Linkage Types
Symptoms: Unable to characterize Ub chain architecture despite successful protein ubiquitination detection.
| Possible Cause | Diagnostic Steps | Corrective Action |
|---|---|---|
| Insufficient Enrichment for Specific Linkage | Use linkage-specific antibodies in a western blot to confirm presence. | Employ linkage-specific Ub-binding domains or antibodies for enrichment [36]. |
| Labile Linkages During Sample Prep | Check buffer pH and avoid strong reducing agents. | Use gentler lysis buffers; avoid high temperatures; analyze samples quickly. |
| Limitations of MS Fragmentation | Analyze MS2 spectra of Ubiquitin remnants for diagnostic ions. | Use alternative fragmentation methods (e.g., EThcD); enrich for Ubiquitin peptides with K-ε-GG antibody. |
General Troubleshooting Framework for Experimental Research
When encountering problems in ubiquitination experiments, a systematic approach is effective [96]:
- Identify the Problem: Clearly define if the issue lies in experimental design, data collection, or analysis. Review objectives, hypotheses, and methods against actual outcomes [96].
- Diagnose the Cause: Use theoretical knowledge and analytical tools. Consider types of error (random, systematic, human) and their impact on data quality [96].
- Implement a Solution: Based on your diagnosis, apply problem-solving skills. This may involve redesigning the experiment, collecting more data, or adjusting the analysis [96].
- Document the Process: Meticulously record all troubleshooting steps, rationale, and outcomes in a lab notebook for you and your team [96] [12].
- Learn and Share: Reflect on the experience to improve future work. Share findings with colleagues to contribute to collective knowledge [96].
Experimental Protocols & Data
Detailed Methodology: Enrichment of Ubiquitinated Proteins using Strep-Tagged Ubiquitin
This protocol is adapted from Danielsen et al., which identified 753 ubiquitination sites in human cells [36].
- Cell Culture and Transfection: Culture HEK293T cells in standard DMEM medium. Transfect with a plasmid encoding N-terminal Strep-tag II-tagged Ubiquitin using a standard transfection reagent. Incubate for 24-48 hours.
- Cell Lysis: Wash cells with ice-cold PBS. Lyse cells in a denaturing lysis buffer (e.g., 6 M Guanidine-HCl, 100 mM NaH₂PO₄, 10 mM Tris-HCl, pH 8.0) supplemented with DUB inhibitors (e.g., 10 mM N-Ethylmaleimide) and protease inhibitors. Sonicate to reduce viscosity.
- Affinity Purification: Clarify the lysate by centrifugation. Incubate the supernatant with pre-equilibrated Strep-Tactin Sepharose resin for 2-3 hours at room temperature with gentle rotation.
- Washing: Pellet the resin and transfer to a chromatography column. Wash sequentially with:
- 10 column volumes of Lysis Buffer.
- 10 column volumes of Wash Buffer I (8 M Urea, 100 mM NaH₂PO₄, 10 mM Tris-HCl, pH 8.0).
- 10 column volumes of Wash Buffer II (8 M Urea, 100 mM NaH₂PO₄, 10 mM Tris-HCl, pH 6.3).
- Elution: Elute the bound ubiquitinated proteins with 5 column volumes of Elution Buffer (Wash Buffer II supplemented with 2.5 mM Desthiobiotin). Collect 1 mL fractions.
- Processing for MS: Pool the protein-containing fractions. Reduce, alkylate, and digest the proteins with trypsin. Desalt the resulting peptides using a C18 StageTip before LC-MS/MS analysis.
Quantitative Data on Ubiquitination Site Identification
Table 1: Number of Ubiquitination Sites Identified in Selected High-Throughput Studies
| Study / Method | Cell Line / Organism | Ubiquitination Sites Identified | Key Enrichment Technique |
|---|---|---|---|
| Peng et al. (2003) [36] | S. cerevisiae | 110 sites on 72 proteins | 6x-His-tagged Ubiquitin & Ni-NTA |
| Akimov et al. (2018) [36] | HeLa Cells | 277 sites on 189 proteins | Stable His-tagged Ubiquitin Exchange (StUbEx) |
| Danielsen et al. (2011) [36] | HEK293T & U2OS | 753 sites on 471 proteins | Strep-tagged Ubiquitin & Strep-Tactin |
Table 2: Comparison of Key Enrichment Methodologies for Ubiquitinated Proteins
| Method | Principle | Advantages | Limitations |
|---|---|---|---|
| Ubiquitin Tagging [36] | Ectopic expression of affinity-tagged Ub (His/Strep) | Easy, relatively low-cost, good for high-throughput screening in cell lines. | Cannot be used in native tissues; potential artifacts from tag; co-purification of endogenous proteins. |
| Antibody-Based [36] | Immuno-enrichment with anti-Ub antibodies (e.g., P4D1, FK2) | Works on endogenous proteins and clinical samples; linkage-specific antibodies available. | High cost; potential for non-specific binding. |
| UBD-Based [36] | Enrichment using tandem-repeated Ub-Binding Domains | High affinity for endogenous ubiquitinated proteins; can be linkage-selective. | Development of high-affinity binders can be complex. |
The Scientist's Toolkit
Table 3: Key Research Reagent Solutions for Ubiquitination Site Identification
| Reagent / Material | Function / Application |
|---|---|
| Strep-Tag II Ubiquitin Plasmid | Genetic construct for expressing Strep-tagged Ub in mammalian cells for affinity purification [36]. |
| Strep-Tactin Sepharose | High-affinity resin for purifying Strep-tagged ubiquitin and its conjugated proteins [36]. |
| Linkage-Specific Ub Antibodies | Antibodies that recognize specific Ub chain linkages (e.g., K48, K63) for Western blot validation or enrichment [36]. |
| Tandem Ubiquitin Binding Entities (TUBEs) | Engineered proteins with multiple UBDs to protect polyUb chains from DUBs and enrich ubiquitinated proteins [36]. |
| Deubiquitinase (DUB) Inhibitors | Small molecules (e.g., N-Ethylmaleimide, PR-619) added to lysis buffers to prevent loss of ubiquitination during preparation [36]. |
| K-ε-GG Remnant Antibody | Immune-affinity reagent that specifically recognizes the diglycine (Gly-Gly) remnant left on lysines after tryptic digest, used for MS-based enrichment [36]. |
Workflow Diagrams
Experimental Workflow for Ubiquitinated Protein Identification
Ubiquitination Signaling and Analysis Complexity
Conclusion
The field of ubiquitination site identification has made remarkable progress in enhancing specificity through integrated computational and experimental approaches. The development of sophisticated tools like Ubigo-X demonstrates the power of combining multiple feature representations and ensemble learning, while innovative methods such as BioE3 provide unprecedented resolution for mapping E3 ligase-specific substrates. Successful ubiquitination studies now require strategic implementation of complementary technologies—leveraging computational predictions for hypothesis generation followed by rigorous experimental validation with optimized mass spectrometry and proximity-dependent labeling. Future directions will focus on single-cell ubiquitinomics, dynamic monitoring of site-specific modifications in live cells, and leveraging structural insights into ubiquitin-induced conformational changes. These advances will accelerate the translation of ubiquitination research into clinical applications, particularly in targeted protein degradation therapeutics and personalized medicine approaches for cancer and neurodegenerative diseases. The continued refinement of specificity in ubiquitination site mapping will undoubtedly uncover novel regulatory mechanisms and therapeutic opportunities in the complex landscape of ubiquitin signaling.
References
- 1. UbiSite Approach for Comprehensive Mapping of Lysine ... [https://pubmed.ncbi.nlm.nih.gov/29967540/]
- 2. A High-Throughput Method for Specific, Rapid, Precise and ... [https://www.sciencedirect.com/science/article/abs/pii/S0039914025015681]
- 3. Unraveling chain specific ubiquitination in cells using tandem ... [https://pmc.ncbi.nlm.nih.gov/articles/PMC12217038/]
- 4. Selective ubiquitination of drug-like small molecules by the ... [https://www.nature.com/articles/s41467-025-63442-x]
- 5. Emerging drug development technologies targeting ... [https://pmc.ncbi.nlm.nih.gov/articles/PMC7112620/]
- 6. Site-specific ubiquitination: Deconstructing the degradation ... [https://pmc.ncbi.nlm.nih.gov/articles/PMC9208700/]
- 7. Non-proteolytic ubiquitylation in cellular signaling and ... [https://www.nature.com/articles/s42003-022-03060-1]
- 8. Regulation of Signaling by Non-degradative Ubiquitination [https://pmc.ncbi.nlm.nih.gov/articles/PMC2659175/]
- 9. How to Better Study Ubiquitination [https://www.ptglab.com/news/blog/how-to-better-study-ubiquitination/?srsltid=AfmBOopMEpSATyHJk4thXHElgLrtpaowoissVHADBJmkZA41OM98NVN5]
- 10. How to Determine Ubiquitination Sites [https://www.mtoz-biolabs.com/how-to-determine-ubiquitination-sites.html]
- 11. Identification, Analysis and Prediction of Protein Ubiquitination ... [https://pmc.ncbi.nlm.nih.gov/articles/PMC3006176/]
- 12. Troubleshooting Protocols - Biological Sciences: Summer ... [https://guides.library.cmu.edu/biologicalsciencesSRI/troubleshooting]
- 13. Proteomic Identification of Protein Ubiquitination Events - PMC [https://pmc.ncbi.nlm.nih.gov/articles/PMC3937853/]
- 14. Global, site-resolved analysis of ubiquitylation occupancy ... [https://www.sciencedirect.com/science/article/pii/S0092867424003155]
- 15. Current methodologies in protein ubiquitination characterization [https://cellandbioscience.biomedcentral.com/articles/10.1186/s13578-022-00870-y]
- 16. Quantifying Ubiquitin Signaling - PMC - PubMed Central [https://pmc.ncbi.nlm.nih.gov/articles/PMC4441763/]
- 17. Dynamic ubiquitin signaling in cell cycle regulation - PMC [https://pmc.ncbi.nlm.nih.gov/articles/PMC5551716/]
- 18. Protein Ubiquitination : Assays, Sites ... - Creative Proteomics [https://www.creative-proteomics.com/resource/protein-ubiquitination-detection-assays-site-identification-proteomics.htm]
- 19. Structural Diversity of Ubiquitin E3 Ligase - PMC [https://pmc.ncbi.nlm.nih.gov/articles/PMC8586995/]
- 20. ubiquitin E : styles, 3 and ligases - PMC structures functions [https://pmc.ncbi.nlm.nih.gov/articles/PMC8607428/]
- 21. Peptide Level Immunoaffinity Enrichment Enhances Ubiquitination ... [https://pmc.ncbi.nlm.nih.gov/articles/PMC3879610/]
- 22. Combinatorial mapping of E3 ubiquitin ligases to their ... [https://www.sciencedirect.com/science/article/pii/S1097276525000516]
- 23. Protocol to identify E3 ligases amenable to biodegraders ... [https://pmc.ncbi.nlm.nih.gov/articles/PMC11541768/]
- 24. - Improve Prediction Using... | Preprints.org Ubiquitination site [https://www.preprints.org/manuscript/202206.0397/v1]
- 25. Decoding polyubiquitin regulation of KV7. 1 (KCNQ1) ... [https://www.nature.com/articles/s41467-025-60893-0]
- 26. The diversity of linkage-specific polyubiquitin chains and their ... [https://pmc.ncbi.nlm.nih.gov/articles/PMC7484030/]
- 27. The diversity of linkage-specific polyubiquitin chains and ... [https://www.sciencedirect.com/science/article/abs/pii/S1074742720301301]
- 28. [Advances in the application of affinity separation for ... [https://pubmed.ncbi.nlm.nih.gov/34227356/]
- 29. HTS Screening of Poly-Ubiquitin Linkage-Specific ... [https://lifesensors.com/hts-screening-of-poly-ubiquitin-linkage-specific-molecular-glues-and-protein-degraders/]
- 30. Polyubiquitination by HECT E3s and the determinants of chain type... [https://pubmed.ncbi.nlm.nih.gov/19364824/]
- 31. Characterization of Polyubiquitin Chain Structure by Middle ... [https://pmc.ncbi.nlm.nih.gov/articles/PMC2663523/]
- 32. 开发用于治疗应用的HECT 型泛素连接酶小分子抑制剂 [https://suppr.wilddata.cn/browses/detail/pubmed/30088849]
- 33. Ubigo-X: Protein ubiquitination site prediction using ... [https://www.sciencedirect.com/science/article/pii/S2001037025002910]
- 34. Ubigo-X: Protein ubiquitination site prediction using ... [https://pubmed.ncbi.nlm.nih.gov/40727425/]
- 35. Data-independent acquisition method for ubiquitinome ... [https://www.nature.com/articles/s41467-020-20509-1]
- 36. Current methodologies in protein ubiquitination ... [https://pmc.ncbi.nlm.nih.gov/articles/PMC9373315/]
- 37. Large-Scale Identification of Ubiquitination Sites by Mass ... [https://pmc.ncbi.nlm.nih.gov/articles/PMC4725055/]
- 38. Mass Spectrometric Determination of Protein Ubiquitination [https://pubmed.ncbi.nlm.nih.gov/31256381/]
- 39. Mass Spectrometry Standards and Calibrants Support ... [https://www.thermofisher.com/us/en/home/technical-resources/technical-reference-library/mass-spectrometry-support-center/mass-spectrometry-reagents-support/ms-standards-calibrants-support/ms-standards-calibrants-support-troubleshooting.html]
- 40. Weighing in on Ubiquitin: The Expanding Role of Mass ... [https://pmc.ncbi.nlm.nih.gov/articles/PMC1224607/]
- 41. BioE3 identifies specific substrates of ubiquitin E3 ligases [https://www.nature.com/articles/s41467-023-43326-8]
- 42. Cullin-RING ligase reveals molecular-glue-induced... BioE 3 [https://biosignaling.biomedcentral.com/articles/10.1186/s12964-025-02091-5]
- 43. Ub-POD: A Ubiquitin- Specific Proximity-Dependent Labeling... [https://bio-protocol.org/en/bpdetail?id=5351&type=0]
- 44. Addgene: BioE specific substrates of 3 E3 ligases. identifies ubiquitin [https://www.addgene.org/browse/article/28243085/]
- 45. Ubiquitination detection techniques - PMC - PubMed Central [https://pmc.ncbi.nlm.nih.gov/articles/PMC10625345/]
- 46. How to Better Study Ubiquitination [https://www.ptglab.com/news/blog/how-to-better-study-ubiquitination/?srsltid=AfmBOorUyE3vEFunfFmZou7tMrrNi7uMi_3YoGsRHgNkkHqBFG9svgAG]
- 47. Ubiquitination Antibodies: How to Precisely Select ... - ANT Bio [https://www.antbioinc.com/blogs/technical-articles/ubiquitination-antibodies-how-to-precisely-select-the-appropriate-clone-based-on-research-needs]
- 48. Anti-Ubiquitin (linkage-specific K48) antibody [EP8589] [https://www.abcam.com/en-us/products/primary-antibodies/ubiquitin-linkage-specific-k48-antibody-ep8589-ab140601]
- 49. [Evaluation of high-throughput detection technology for ... [https://pubmed.ncbi.nlm.nih.gov/40873330/]
- 50. Western blot troubleshooting guide! [https://www.jacksonimmuno.com/secondary-antibody-resource/technical-tips/western-blot-trouble-shooting/]
- 51. Ub-POD: A Ubiquitin-Specific Proximity-Dependent ... [https://pmc.ncbi.nlm.nih.gov/articles/PMC12222633/]
- 52. Site-directed multivalent conjugation of antibodies to ... [https://www.nature.com/articles/s41551-024-01342-z]
- 53. Non-hydrolyzable Diubiquitin Probes Reveal Linkage ... [https://pmc.ncbi.nlm.nih.gov/articles/PMC4850247/]
- 54. Activity-based protein profiling: applications to biomarker ... [https://pubmed.ncbi.nlm.nih.gov/15651898/]
- 55. Tips and tricks for successful Mass spec experiments [https://www.ptglab.com/news/blog/tips-and-tricks-for-successful-mass-spec-experiments/?srsltid=AfmBOop976eQscHbkvchue7n2sQeizl3zprD246sofQNDPw9atf0eSYQ]
- 56. Targeting the ubiquitination/deubiquitination process to ... [https://pmc.ncbi.nlm.nih.gov/articles/PMC7819986/]
- 57. Analysis of ubiquitin signaling and chain topology cross-talk [https://www.sciencedirect.com/science/article/abs/pii/S1874391920300026]
- 58. Proteomics links ubiquitin chain topology change to ... [https://pmc.ncbi.nlm.nih.gov/articles/PMC7751889/]
- 59. Frontiers | Polyubiquitin chain assembly and organization determine the... [https://www.frontiersin.org/journals/physiology/articles/10.3389/fphys.2014.00004/full]
- 60. Strategies to Target Specific Components of the Ubiquitin ... [https://www.frontiersin.org/journals/chemistry/articles/10.3389/fchem.2019.00914/full]
- 61. Multiomics approach reveals the ubiquitination-specific ... [https://www.nature.com/articles/s41392-022-01156-y]
- 62. Site-specific proteomic strategies to identify ubiquitin and ... [https://www.sciencedirect.com/science/article/pii/S1084952121002822]
- 63. Detecting false positive sequence homology: a machine ... [https://pmc.ncbi.nlm.nih.gov/articles/PMC4765110/]
- 64. Detecting false positive sequence homology – a machine ... [https://www.rna-seqblog.com/detecting-false-positive-sequence-homology-a-machine-learning-approach/]
- 65. Cross-Validation - an overview [https://www.sciencedirect.com/topics/medicine-and-dentistry/cross-validation]
- 66. A closer look at cross-validation for assessing the accuracy ... [https://pmc.ncbi.nlm.nih.gov/articles/PMC5920056/]
- 67. Crosstalk between protein post-translational modifications and ... [https://pmc.ncbi.nlm.nih.gov/articles/PMC10860296/]
- 68. Control of protein stability by post-translational modifications [https://www.nature.com/articles/s41467-023-35795-8]
- 69. Mass Spectrometry for Post-Translational Modifications - NCBI [https://www.ncbi.nlm.nih.gov/books/NBK56012/]
- 70. Identification and characterization of post-translational ... [https://www.sciencedirect.com/science/article/pii/S0098299722000036]
- 71. Ubiquitin modifications - PMC [https://pmc.ncbi.nlm.nih.gov/articles/PMC4822133/]
- 72. Breakthrough: Brain Protein May Revolutionize Alzheimer's [https://www.miragenews.com/breakthrough-brain-protein-may-revolutionize-1577330/]
- 73. Identification of chemical scaffolds for targeting ubiquitin ... [https://pmc.ncbi.nlm.nih.gov/articles/PMC12210405/]
- 74. Imbalanced Dataset: Strategies to Fix Skewed Class ... [https://labelyourdata.com/articles/imbalanced-dataset]
- 75. Understanding the Matthews ( Correlation )... | Medium Coefficient MCC [https://koshurai.medium.com/understanding-the-matthews-correlation-coefficient-mcc-in-machine-learning-26e8049f8572]
- 76. Why ROC-AUC Alone Is Insufficient for Highly Imbalanced Data [https://sciety-labs.elifesciences.org/articles/by?article_doi=10.20944/preprints202510.0958.v1]
- 77. The receiver operating characteristic curve accurately ... [https://www.sciencedirect.com/science/article/pii/S2666389924001090]
- 78. Why ROC-AUC Alone Is Insufficient for Highly Imbalanced ... [https://www.preprints.org/manuscript/202510.0958]
- 79. Ubigo-X: Protein ubiquitination site prediction using ... [https://pmc.ncbi.nlm.nih.gov/articles/PMC12303043/]
- 80. Identifying the ubiquitination targets of E6AP by orthogonal ... [https://www.nature.com/articles/s41467-017-01974-7]
- 81. Engineering a cell-based orthogonal ubiquitin transfer ... [https://pmc.ncbi.nlm.nih.gov/articles/PMC12271601/]
- 82. Characterizing Ubiquitination Sites by Peptide-based ... [https://pmc.ncbi.nlm.nih.gov/articles/PMC3518114/]
- 83. Prediction of Ubiquitination Sites by Using the Composition of ... [https://pmc.ncbi.nlm.nih.gov/articles/PMC3146527/]
- 84. Improved prediction of human ubiquitination sites by ... [https://www.sciencedirect.com/science/article/abs/pii/S157096391300160X]
- 85. UbPred: predictor of protein ubiquitination sites [https://thetruth.ccs.neu.edu/ubpred/help.html]
- 86. Computational methods for ubiquitination site prediction using ... [https://bmcbioinformatics.biomedcentral.com/articles/10.1186/s12859-016-0959-z]
- 87. EUP: Enhanced cross-species prediction of ubiquitination ... [https://pmc.ncbi.nlm.nih.gov/articles/PMC12266453/]
- 88. Overcoming Analytical Challenges in Proximity Labeling ... [https://pmc.ncbi.nlm.nih.gov/articles/PMC11976124/]
- 89. In vivo interactome profiling by enzyme‐catalyzed proximity labeling [https://cellandbioscience.biomedcentral.com/articles/10.1186/s13578-021-00542-3]
- 90. An enzymatic cascade enables sensitive and specific ... [https://www.nature.com/articles/s41467-025-65405-8]
- 91. A proximity for protein–protein interactions on cell... labeling method [https://pubs.rsc.org/en/content/articlelanding/2022/sc/d1sc06898a]
- 92. The development of proximity labeling technology and its ... [https://biosignaling.biomedcentral.com/articles/10.1186/s12964-023-01310-1]
- 93. The role of RNA in the maintenance of chromatin domains as revealed... [https://pmc.ncbi.nlm.nih.gov/articles/PMC11147508/]
- 94. Bridging molecular and cellular neuroscience with ... [https://www.nature.com/articles/s12276-025-01491-4]
- 95. : A Powerful Tool for Protein Complex Purification... Proximity Labeling [https://blog.addgene.org/proximity-labeling-a-powerful-tool-for-protein-complex-purification-and-proteomic-mapping]
- 96. Troubleshooting Problems in Experimental Research [https://www.linkedin.com/advice/1/what-most-effective-ways-troubleshoot-problems-experimental]