Ubiquitination Signatures in Cancer: Prognostic Biomarkers and Therapeutic Targets
This article explores the rapidly evolving field of ubiquitination-based prognostic signatures in cancer.
Ubiquitination Signatures in Cancer: Prognostic Biomarkers and Therapeutic Targets
Abstract
This article explores the rapidly evolving field of ubiquitination-based prognostic signatures in cancer. It details how bioinformatics analyses of ubiquitination-related genes (URGs) are enabling the construction of powerful risk models that predict patient survival, therapy response, and tumor microenvironment features across diverse cancers, including lung adenocarcinoma, diffuse large B-cell lymphoma, ovarian cancer, and sarcoma. The content covers foundational concepts of the ubiquitin-proteasome system, methodologies for signature development, strategies to address analytical challenges, and extensive multi-cancer validation. Aimed at researchers and drug development professionals, it synthesizes current evidence to highlight the clinical potential of these signatures in personalizing cancer treatment and guiding the development of novel therapeutics like PROTACs.
The Ubiquitin-Proteasome System: From Basic Biology to Cancer Prognosis
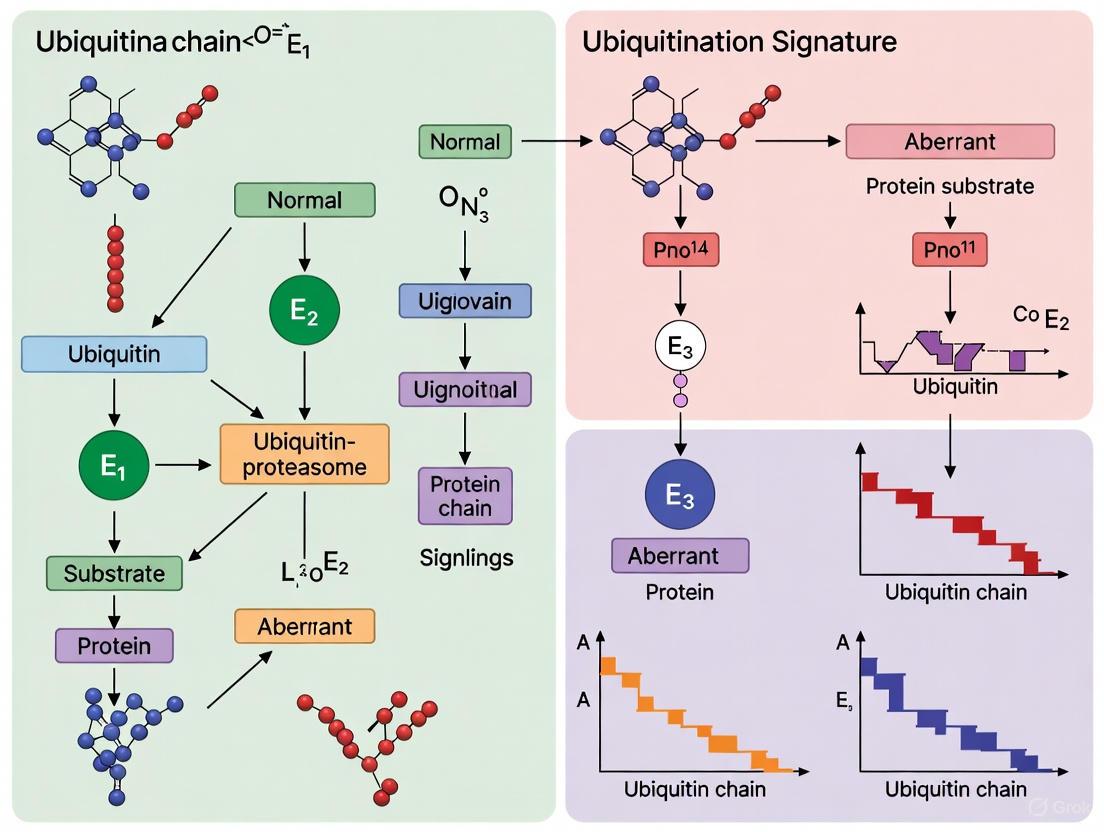
The ubiquitin-proteasome system (UPS) is a crucial regulatory mechanism in eukaryotic cells, controlling the stability, function, and localization of a vast array of proteins [1]. At its core, the system involves the covalent attachment of a small protein, ubiquitin, to lysine residues on substrate proteins [1]. This post-translational modification is a highly orchestrated process carried out by a sequential enzymatic cascade involving E1 activating, E2 conjugating, and E3 ligating enzymes [1]. The type of ubiquitin chain formed—determined by which of the seven lysine residues in ubiquitin itself is used for linkage—dictates the biological fate of the modified protein. K48 and K11-linked chains typically target substrates for proteasomal degradation, whereas K63 and linear chains play prominent roles in non-proteolytic signaling processes such as inflammation [1]. Countering this process is a family of proteases known as deubiquitinases (DUBs), which cleave ubiquitin from substrates, providing reversibility and dynamic regulation to ubiquitin signaling [2] [3].
The following diagram illustrates the core enzymatic cascade of the ubiquitination process and its reversal by DUBs:
Comparative Analysis of Ubiquitination System Components
E1 Activating Enzymes: Gatekeepers of the Ubiquitin Cascade
E1 enzymes sit at the apex of the ubiquitination cascade, initiating the process through an ATP-dependent mechanism that forms a thioester bond between the C-terminal carboxyl group of ubiquitin and the catalytic cysteine of the E1 itself [1]. Humans possess two primary ubiquitin E1 enzymes—UBA1 and UBA6—that control ubiquitination of all downstream targets [1]. The significance of E1 enzymes as therapeutic targets is exemplified by inhibitors such as PYR-41 and PYZD-4409, which preferentially induce cell death in malignant cells [1]. MLN4924, an inhibitor of the NEDD8 activating enzyme (NAE), has shown particular promise in clinical settings by disrupting cullin RING ligase (CRL) activity and is currently being evaluated in multiple phase II studies [1].
E2 Conjugating Enzymes: Specificity and Chain Formation
E2 enzymes serve as crucial intermediaries, receiving activated ubiquitin from E1 enzymes and collaborating with E3 ligases to transfer ubiquitin to substrate proteins [1]. With approximately 38 E2 enzymes in mammals, this enzyme class offers greater potential for specificity than E1 enzymes [1]. E2 enzymes not only function as "ubiquitin carriers" but also dictate ubiquitin chain linkage specificity and length [1]. Notable E2 inhibitors include CC0651, an allosteric inhibitor of CDC34 that interferes with ubiquitin discharge [1], and NSC697923, which inhibits UBE2N~Ub thioester formation, thereby blocking K63-specific polyubiquitin chain synthesis [1].
E3 Ubiquitin Ligases: The Substrate Recognition Specialists
E3 ubiquitin ligases constitute the largest and most diverse family within the ubiquitin system, with approximately 700 members predicted to possess ligase activity in humans [1]. These enzymes are categorized into three main subfamilies: RING E3s (which act as scaffolds bringing E2~Ub complexes in contact with substrates), HECT E3s (which form a thioester intermediate with ubiquitin before transferring it to substrates), and RING-Between-RING (RBR) E3s that function as hybrids [1]. The F-box protein SKP2, which forms the SCFSKP2 complex with CUL1, SKP1, and RBX1, exemplifies the importance of E3 ligases in cancer, as it ubiquitinates critical cell cycle regulators like p27KIP1 and is overexpressed in various human malignancies [1].
Deubiquitinases (DUBs): Regulators of Ubiquitin Signaling
DUBs constitute a superfamily of proteases that reverse ubiquitination by cleaving the isopeptide bond between ubiquitin and substrate proteins [2] [3]. In mammals, DUBs are classified into seven major families based on their catalytic domains: ubiquitin carboxy-terminal hydrolases (UCH), ubiquitin-specific proteases (USP), Machado-Josephin domain-containing proteases (MJD), ovarian tumor proteases (OTU), JAMM/MPN+ metalloproteases (JAMM), MINDY, and ZUP1 [3]. Most DUBs are cysteine proteases featuring a catalytic triad with cysteine and histidine residues, while JAMM/MPN+ DUBs are zinc-dependent metalloproteases [3]. DUBs are regulated through complex mechanisms including intramolecular interactions, oligomerization, binding partners, and post-translational modifications [3]. For example, USP7 utilizes its C-terminal UBL domains to stabilize and coordinate its catalytic site, switching between active and inactive conformations [3].
Table 1: Key Enzyme Classes in the Human Ubiquitin System
| Enzyme Class | Representative Members | Core Function | Catalytic Mechanism | Therapeutic Targeting Examples |
|---|---|---|---|---|
| E1 Activating Enzymes | UBA1, UBA6 | Ubiquitin activation & transfer to E2s | ATP-dependent thioester formation | PYR-41, PYZD-4409, MLN4924 (NAE inhibitor) |
| E2 Conjugating Enzymes | CDC34, UBE2N, UBE2V1 | Ubiquitin chain formation & elongation | Thioester intermediate with ubiquitin | CC0651 (CDC34 inhibitor), NSC697923 (UBE2N inhibitor) |
| E3 Ligating Enzymes | SKP2, PARKIN, BAP1 | Substrate recognition & ubiquitin transfer | RING: scaffold; HECT: intermediate | Multiple in development targeting specific E3s |
| Deubiquitinases (DUBs) | USP7, BAP1, UCHL5 | Ubiquitin removal & signal reversal | Cysteine protease (most); Metalloprotease (JAMM) | Research compounds targeting USP28, BAP1 |
Ubiquitination Signatures in Cancer Prognosis: Experimental Evidence
Prognostic Ubiquitination Signatures in Lymphoma and Breast Cancer
Recent bioinformatics approaches have revealed that ubiquitination-related gene expression signatures hold significant prognostic value in cancer patients. In Diffuse Large B-Cell Lymphoma (DLBCL), a three-gene ubiquitination signature comprising CDC34, FZR1, and OTULIN effectively stratified patients into high-risk and low-risk groups [4]. Elevated expression of CDC34 and FZR1 coupled with low OTULIN expression correlated with poor prognosis, with significant differences in immune scores and drug sensitivity observed between risk groups [4]. Similarly, in breast cancer, a six-gene ubiquitination signature (ATG5, FBXL20, DTX4, BIRC3, TRIM45, and WDR78) demonstrated robust prognostic power across multiple validation datasets, outperforming traditional clinical indicators [5].
The experimental workflow for developing and validating these prognostic signatures typically follows a standardized bioinformatics pipeline, as detailed below:
Methodologies for Ubiquitination Kinetics and Proteomic Profiling
The experimental study of ubiquitination kinetics employs sophisticated biochemical approaches to quantify degron functionality and ubiquitin transfer rates. In one representative methodology [6], researchers synthesized a library of degron-based substrates incorporating known degradation sequences from various E3 ligase substrates. These substrates were designed with four components: a fluorophore (5,6-carboxyfluorescein) for detection, a flexible polyethyleneglycol spacer, the portable degron sequence, and a C-terminal lysine residue as the ubiquitination site [6]. Ubiquitination kinetics were then measured by incubating these substrates in rabbit reticulocyte lysate containing the complete ubiquitination machinery, followed by capillary electrophoresis analysis to separate and quantify ubiquitinated species [6]. Computational modeling incorporating first-order reaction kinetics helped distinguish between multi-monoubiquitination and polyubiquitination mechanisms [6].
For proteome-wide ubiquitination profiling, affinity reagents such as the GST-qUBA protein—consisting of four tandem repeats of the ubiquitin-associated domain from UBQLN1 fused to GST—enable large-scale identification of endogenous ubiquitination sites without proteasome inhibition or ubiquitin overexpression [7]. This approach has identified hundreds of endogenous ubiquitination sites from human cells, revealing unexpected prevalence of mitochondrial protein ubiquitination [7].
Table 2: Experimental Protocols for Ubiquitination Analysis
| Methodology | Key Reagents & Tools | Experimental Steps | Output & Applications |
|---|---|---|---|
| Ubiquitination Kinetics Assay [6] | Degron-based peptide substrates, Reticulocyte lysate, Capillary electrophoresis | 1. Substrate synthesis with fluorophore & degron2. Incubation with ubiquitination machinery3. Separation & quantification of ubiquitinated species4. Computational modeling of kinetics | Quantification of ubiquitination rates, Identification of efficient degrons for proteasome targeting |
| Prognostic Signature Development [4] [5] | GEO/TCGA datasets, R packages (limma, survminer, glmnet) | 1. Differential gene expression analysis2. Survival-associated gene filtering3. LASSO Cox regression for feature selection4. Multi-dataset validation5. Immune/drug sensitivity correlation | Risk stratification models, Identification of ubiquitination-related biomarkers for cancer prognosis |
| Proteomic Ubiquitination Site Mapping [7] | GST-qUBA affinity reagent, Mass spectrometry | 1. Affinity purification of ubiquitinated proteins2. Trypsin digestion3. LC-MS/MS analysis4. Database search & false discovery rate control | System-wide identification of endogenous ubiquitination sites, Discovery of novel ubiquitination targets |
Table 3: Essential Research Reagents for Ubiquitination Studies
| Reagent / Resource | Category | Function & Application | Example Sources / Identifiers |
|---|---|---|---|
| MLN4924 (Pevonedistat) | Small Molecule Inhibitor | NEDD8 activating enzyme (NAE) inhibitor; disrupts cullin RING ligase activity | Clinical phase II studies [1] |
| CC0651 | Small Molecule Inhibitor | Allosteric E2 (CDC34) inhibitor; interferes with ubiquitin discharge | Research compound [1] |
| NSC697923 | Small Molecule Inhibitor | UBE2N inhibitor; blocks K63-specific polyubiquitin chain formation | Research compound [1] |
| GST-qUBA Affinity Reagent | Proteomic Tool | Tandem UBA domains for enrichment of ubiquitinated proteins; mass spectrometry identification of ubiquitination sites | Recombinant protein [7] |
| Degron-Based Substrates | Kinetic Assay Tool | Custom peptides with portable degrons for measuring ubiquitination kinetics & proteasome targeting | Synthetic peptides [6] |
| Public Genomics Datasets | Bioinformatics Resource | Gene expression and clinical data for prognostic signature development | GEO (GSE10846, GSE181063, GSE56315), TCGA [4] [5] |
The intricate interplay between E1, E2, E3 enzymes, and DUBs creates a sophisticated regulatory network that maintains cellular homeostasis. Dysregulation of this system contributes significantly to cancer pathogenesis, making its components attractive therapeutic targets. While proteasome inhibitors like bortezomib have demonstrated clinical success, the development of targeted agents against specific E3 ligases and DUBs represents the next frontier in targeting the ubiquitin system for cancer therapy [1]. The emergence of ubiquitination-based prognostic signatures in cancers like DLBCL and breast cancer further highlights the clinical translatability of understanding this vital biological system, offering opportunities for personalized treatment approaches based on the ubiquitination status of individual tumors [4] [5].
Ubiquitination Dysregulation as a Hallmark of Cancer Progression and Metastasis
Ubiquitination, a fundamental and reversible post-translational modification, has emerged as a critical regulator in cellular homeostasis, governing protein stability, localization, and function [8]. This enzymatic process involves the coordinated action of E1 activating enzymes, E2 conjugating enzymes, and E3 ligases, which conjugate ubiquitin to target proteins, while deubiquitinases (DUBs) remove these modifications [8]. The ubiquitin-proteasome system (UPS) controls approximately 80-90% of intracellular proteolysis, positioning it as a master regulator of vital cellular processes including cell cycle progression, DNA damage repair, and signal transduction [9] [10]. In oncology, dysregulation of the ubiquitin system has been increasingly recognized as a hallmark of cancer progression and metastasis, driving tumorigenesis through multiple mechanisms including stabilization of oncoproteins, degradation of tumor suppressors, and modulation of the tumor immune microenvironment [8] [9] [11]. This review comprehensively analyzes the prognostic value of ubiquitination signatures across cancer types and explores emerging therapeutic strategies targeting the ubiquitin system.
Ubiquitination-Related Prognostic Signatures Across Cancers
Robust prognostic models based on ubiquitination-related genes (URGs) have been developed across various malignancies, demonstrating consistent value in stratifying patient survival and informing treatment approaches.
Table 1: Ubiquitination-Based Prognostic Signatures in Solid Tumors
| Cancer Type | Key Ubiquitination-Related Genes | Statistical Performance | Clinical Implications | Reference Dataset |
|---|---|---|---|---|
| Lung Adenocarcinoma (LUAD) | DTL, UBE2S, CISH, STC1 | HR = 0.54, 95% CI: 0.39-0.73, p < 0.001; Validated in 6 external cohorts | High risk score associated with worse prognosis, higher PD1/L1 expression, TMB, and TNB | TCGA-LUAD, GEO validation sets [12] |
| Ovarian Cancer | 17-gene signature including FBXO45 | 1-year AUC = 0.703, 3-year AUC = 0.704, 5-year AUC = 0.705 | High-risk group had significantly lower overall survival (P < 0.05) | TCGA-OV, GTEx [13] |
| Diffuse Large B-Cell Lymphoma (DLBCL) | CDC34, FZR1, OTULIN | Elevated CDC34/FZR1 with low OTULIN predicted poor prognosis | Correlation with immune microenvironment and drug sensitivity | GSE181063, GSE56315, GSE10846 [4] |
| Pan-Cancer Analysis | OTUB1-TRIM28 axis | Stratified patients across 5 cancer types with distinct survival | Predictive of immunotherapy response; associated with macrophage infiltration | 26 cohorts across 5 cancer types [9] |
Table 2: Immune and Therapeutic Correlations of Ubiquitination Signatures
| Cancer Type | Immune Microenvironment Features | Drug Sensitivity Correlations | Mutation Associations |
|---|---|---|---|
| Ovarian Cancer | Higher CD8+ T cells (P < 0.05), M1 macrophages (P < 0.01), and follicular helper T cells (P < 0.05) in low-risk group | N/A | High-risk: More MUC17 and LRRK2 mutations; Low-risk: More RYR2 mutations [13] |
| Lung Adenocarcinoma | Higher TME scores (p < 0.001) in high-risk group | Lower IC50 values for various chemotherapy drugs in high-risk group | Higher TMB (p < 0.001) and TNB (p < 0.001) in high-risk group [12] |
| DLBCL | Significant differences in immune scores between risk groups | Increased sensitivity to Boehringer Ingelheim compound 2536 and Osimertinib in risk groups | Correlated with endocytosis-related mechanisms [4] |
| Pan-Cancer | Association with macrophage infiltration | Predictive of immunotherapy response across multiple cancers | Linked to squamous/neuroendocrine transdifferentiation in adenocarcinoma [9] |
Methodologies for Ubiquitination Signature Development
Bioinformatics Workflow for Prognostic Model Construction
The development of ubiquitination-related prognostic signatures follows a standardized bioinformatics pipeline that integrates multi-omics data and rigorous statistical validation.
Detailed Experimental Protocols
Differential Gene Expression and Ubiquitination Gene Screening
Differentially expressed genes (DEGs) between tumor and normal tissues are identified using the limma R package with standard thresholds (Fold Change > 2, FDR < 0.05) [4]. The ubiquitination-related gene universe is typically compiled from established databases such as the Ubiquitin and Ubiquitin-like Conjugation Database (UUCD), encompassing E1 (approximately 8 genes), E2 (approximately 39 genes), and E3 (approximately 882 genes) enzymes [13]. Intersection of DEGs with ubiquitination-related genes yields ubiquitination-associated DEGs for further analysis. Survival-associated URGs are identified through univariate Cox regression analysis with significance threshold of P < 0.05 [13].
Feature Selection and Model Construction
LASSO Cox regression analysis is performed using the glmnet R package with ten-fold cross-validation to determine the optimal penalty parameter (lambda) and identify the most prognostic genes while preventing overfitting [4] [12]. The ubiquitination-related risk score is calculated using the formula: Risk score = Σ(βi * Expi), where β represents the coefficient from multivariate Cox regression and Exp denotes the gene expression level [13]. Patients are stratified into high-risk and low-risk groups based on the median risk score. Model performance is assessed using Kaplan-Meier survival analysis with log-rank tests and time-dependent receiver operating characteristic (ROC) curves at 1, 3, and 5 years [13] [12].
Immune Microenvironment and Drug Sensitivity Analysis
The composition of immune cell infiltration is evaluated using CIBERSORT or ESTIMATE algorithms to calculate stromal and immune scores [4] [13]. Drug sensitivity analysis is performed using the oncoPredict R package to calculate the half maximal inhibitory concentration (IC50) of various therapeutic compounds [4]. Significant differences in drug sensitivity between risk groups are identified using Wilcoxon rank-sum tests.
Key Signaling Pathways Regulated by Ubiquitination
Ubiquitination exerts its profound influence on cancer progression through regulation of critical oncogenic signaling pathways and cellular processes.
Epithelial-Mesenchymal Transition (EMT) Regulation
Ubiquitination precisely controls EMT through dynamic regulation of key EMT transcription factors (EMT-TFs) including Snail, Slug, ZEB1, ZEB2, Twist1, and Twist2 [8]. The stability of Snail, a critical EMT-TF, is dynamically controlled by opposing ubiquitination and deubiquitination activities. In colorectal cancer, mitogen and stress-activated protein kinase 1 (MSK1) recruits USP5 to deubiquitinate and stabilize Snail, facilitating EMT and metastasis [8]. Conversely, in triple-negative breast cancer, the E3 ligase MARCH2 ubiquitinates Snail, driving its degradation and suppressing tumor growth and metastasis [8]. Multiple signaling pathways that regulate EMT, including TGF-β, Wnt/β-catenin, Notch, and Hedgehog, are themselves subject to ubiquitination regulation, creating complex feedback loops that control cancer cell plasticity and metastatic potential [8].
Cancer Stem Cell (CSC) Maintenance
The ubiquitin system governs CSC functionality by modulating transcription factors essential for self-renewal and differentiation, including SOX2, OCT4, KLF4, and c-Myc [11]. E3 ubiquitin ligases and DUBs interact with key signaling pathways that regulate stem-like properties in cancer cells, including Notch, Wnt/β-catenin, Hedgehog, and Hippo-YAP pathways [11]. Dysregulation of these ubiquitination-dependent mechanisms enhances CSC maintenance, contributing to tumor initiation, recurrence, and therapy resistance. The involvement of the UPS in maintaining CSC characteristics highlights an opportunity for drug development focused on modulating ubiquitin ligases and DUBs to selectively degrade or stabilize proteins essential for CSC survival [11].
Apoptosis Evasion via Bcl-2 Regulation
The UPS plays a pivotal role in determining the fate of pro- and anti-apoptotic Bcl-2 family members through targeted degradation [10]. Several E3 ubiquitin ligases specifically target different Bcl-2 family proteins for degradation, thereby fine-tuning apoptotic responses. Anti-apoptotic members including Bcl-2, Bcl-xL, and Mcl-1 are frequently overexpressed in cancer cells through disrupted ubiquitination, tipping the balance toward cell survival [10]. In breast cancer cells, estrogen receptor alpha activation directly induces Bcl-2 transcription by binding to the Bcl-2 promoter, while in gastric cancer, miR-383 negatively regulates Bcl-2 by targeting its 3'-untranslated region [10]. Dysregulation of the UPS leads to accumulation of anti-apoptotic proteins and degradation of pro-apoptotic proteins, amplifying cell survival and tumor growth.
RAS and MYC Pathway Modulation
RAS proteins, the most frequently mutated oncoproteins in human cancers, are regulated by ubiquitination which dynamically controls their stability, membrane localization, and signaling transduction [14]. A series of ubiquitination sites, E3 ligases, deubiquitinases, and regulatory proteins are involved in RAS ubiquitination, exhibiting heterogeneity across different RAS isoforms (KRAS4A, KRAS4B, NRAS, and HRAS) [14]. The OTUB1-TRIM28 ubiquitination regulatory axis influences cancer cell fate by modulating MYC and its downstream pathways, altering oxidative stress, ultimately leading to immunotherapy resistance and poor prognosis [9]. Targeting these ubiquitination pathways offers novel strategies to overcome RAS-driven and MYC-driven malignant phenotypes.
The Scientist's Toolkit: Essential Research Reagents
Table 3: Essential Research Reagents for Ubiquitination Studies
| Reagent Category | Specific Examples | Research Application | Key Functions |
|---|---|---|---|
| Bioinformatics Tools | limma R package, ConsensusClusterPlus, CIBERSORT, ESTIMATE | Differential expression analysis, clustering, immune microenvironment characterization | Identifies ubiquitination-related DEGs, stratifies molecular subtypes, quantifies immune infiltration [4] [13] [12] |
| Survival Analysis Packages | survminer, survival, glmnet | Prognostic model development, LASSO Cox regression | Performs survival analysis, feature selection, and risk score calculation [4] [13] |
| Ubiquitination Databases | UUCD, iUUCD 2.0 | Comprehensive ubiquitination gene compendium | Provides reference sets of E1, E2, E3 enzymes and DUBs [13] [12] |
| Drug Sensitivity Tools | oncoPredict R package | In silico drug response prediction | Calculates IC50 values for various therapeutic compounds [4] |
| Single-Cell Analysis Tools | Seurat, SingleR | Single-cell RNA sequencing analysis | Cell type annotation and gene expression distribution at single-cell resolution [4] [13] |
Emerging Therapeutic Strategies and Clinical Implications
Targeted Protein Degradation Approaches
Molecular glues represent a new generation of small molecules that reshape an E3 ubiquitin ligase surface to promote novel protein-protein interactions, triggering ubiquitination and proteasomal degradation of target proteins [15]. These monovalent compounds offer advantages over bivalent proteolysis-targeting chimeras (PROTACs) through their smaller size, enhanced drug-like properties, and oral bioavailability [15]. Clinically validated molecular glues including lenalidomide and next-generation cereblon E3 ligase modulators (CELMoDs) redirect the CRL4CRBN complex to degrade transcription factors IKZF1 and IKZF3, producing durable responses in multiple myeloma [15]. Emerging programs are targeting historically "undruggable" oncoproteins including STAT3 and MYC, with early compounds showing promise in collapsing oncogene-dependent transcriptional programs [15].
Proteasome Inhibitors and Combination Strategies
Proteasome inhibitors including bortezomib and carfilzomib disrupt the proteasome-Bcl-2 axis, leading to accumulation of pro-apoptotic factors that push cancer cells toward apoptosis [11] [10]. These agents have demonstrated clinical efficacy in hematological malignancies, though their application in solid tumors remains challenging. Emerging combination strategies seek to enhance therapeutic efficacy while overcoming resistance mechanisms. The potential of combining ubiquitin-targeted therapies with traditional chemotherapy, immunotherapy, and targeted drugs represents a novel frontier in oncological treatment strategies [11]. Research efforts are increasingly focused on developing inhibitors against specific E3 ligases and DUBs that regulate EMT, metastasis, and chemoresistance, offering promising approaches to reverse aggressive cancer phenotypes [8].
Immunotherapy Response Prediction
Ubiquitination-related prognostic signatures demonstrate growing utility in predicting immunotherapy response across multiple cancer types [9] [12]. The URPS signature effectively stratified patients receiving immunotherapy in pan-cancer analysis, with potential to identify patients most likely to benefit from immune checkpoint inhibition [9]. In lung adenocarcinoma, patients with higher ubiquitination-related risk scores had significantly higher PD1/L1 expression levels (p < 0.05), tumor mutation burden (p < 0.001), and tumor neoantigen burden (p < 0.001), suggesting enhanced responsiveness to immunotherapy [12]. These findings position ubiquitination signatures as valuable biomarkers for guiding immunotherapy selection and optimizing treatment outcomes.
Ubiquitination dysregulation represents a fundamental hallmark of cancer progression and metastasis, with ubiquitination-related gene signatures providing robust prognostic value across diverse malignancies. The intricate regulation of oncogenic pathways including EMT, apoptosis, stemness maintenance, and immune responses by the ubiquitin system underscores its central role in cancer biology. Standardized bioinformatics pipelines have enabled development of clinically relevant prognostic models that stratify patient survival and inform therapeutic approaches. Emerging targeted protein degradation strategies, particularly molecular glues and PROTACs, offer promising avenues for targeting previously "undruggable" oncoproteins. As research continues to unravel the complexity of the ubiquitin code in cancer, ubiquitination-focused biomarkers and therapies are poised to significantly advance precision oncology and improve patient outcomes.
Defining Ubiquitination-Related Genes (URGs) and Their Expression Landscapes in Tumors
Ubiquitination, a fundamental post-translational modification, has emerged as a critical regulator of oncogenesis and tumor progression. This process involves the coordinated activity of E1 (activating), E2 (conjugating), and E3 (ligating) enzymes that attach ubiquitin molecules to target proteins, determining their stability, localization, and activity [16] [13]. The ubiquitin-proteasome system (UPS) degrades approximately 80% of intracellular proteins, thereby maintaining genomic stability and modulating signaling pathways that regulate cell proliferation and apoptosis [16]. Dysregulation of ubiquitination-related genes (URGs) has been implicated across diverse cancer types, offering new avenues for prognostic assessment and therapeutic intervention. This review synthesizes current research defining URGs and their expression landscapes across tumors, providing a comparative analysis of their prognostic value and potential clinical applications.
URG Expression Landscapes Across Major Cancers
Comprehensive genomic profiling studies have revealed distinct URG expression patterns across cancer types, with therapeutic actionability observed in approximately 92.0% of solid tumor samples [17]. The expression landscapes of key URGs demonstrate both tissue-specific patterns and common themes across malignancies, reflecting the complex role of the ubiquitin-proteasome system in cancer biology.
Table 1: Ubiquitination-Related Gene Signatures and Their Prognostic Value Across Cancers
| Cancer Type | Key Ubiquitination-Related Genes Identified | Prognostic Value | Associated Biological Processes |
|---|---|---|---|
| Cervical Cancer | MMP1, RNF2, TFRC, SPP1, CXCL8 [16] | AUC >0.6 for 1/3/5-year survival [16] | Immune cell infiltration, immune checkpoint regulation [16] |
| Diffuse Large B-Cell Lymphoma | CDC34, FZR1, OTULIN [4] | Poor prognosis with elevated CDC34/FZR1 and low OTULIN [4] | Endocytosis, T-cell correlation, drug sensitivity [4] |
| Colon Cancer | ARHGAP4, MID2, SIAH2, TRIM45, UBE2D2, WDR72 [18] | Stratified patient risk groups [18] | Epithelial-mesenchymal transition, immune escape, immunosuppressive cell infiltration [18] |
| Ovarian Cancer | 17-gene signature including FBXO45 [13] | 1-year AUC = 0.703, 3-year AUC = 0.704, 5-year AUC = 0.705 [13] | Wnt/β-catenin pathway, immune microenvironment modulation [13] |
| Lung Adenocarcinoma | DTL, UBE2S, CISH, STC1 [12] | HR = 0.54, 95% CI: 0.39-0.73, p < 0.001 [12] | Immune infiltration, tumor mutation burden, PD1/L1 expression [12] |
The contrasting expression patterns and prognostic associations of these URGs across cancer types highlight the tissue-specific nature of ubiquitination signaling. For instance, in lung adenocarcinoma, elevated expression of STC1, UBE2S, and DTL correlates with poorer outcomes, while higher CISH expression appears protective [12]. Similarly, in DLBCL, CDC34 and FZR1 overexpression coupled with OTULIN underexpression defines a high-risk profile [4]. These patterns underscore the potential of URG signatures to refine prognostic stratification beyond conventional clinicopathological parameters.
Methodological Framework for URG Identification and Validation
Bioinformatics Approaches for URG Discovery
The identification of prognostic URG signatures typically follows a structured bioinformatics pipeline that integrates multiple datasets and analytical methods. A representative workflow begins with data acquisition from public repositories such as The Cancer Genome Atlas (TCGA) and Gene Expression Omnibus (GEO) [16] [18] [13]. Differential expression analysis between tumor and normal tissues identifies significantly dysregulated genes, which are then intersected with curated URG lists from databases like the Integrated Annotations for Ubiquitin and Ubiquitin-like Conjugation Database (iUUCD) or Molecular Signatures Database (MSigDB) [18] [19].
Following URG identification, unsupervised clustering methods such as non-negative matrix factorization (NMF) often reveal molecular subtypes with distinct clinical outcomes [18]. Prognostic feature selection employs multiple algorithms including univariate Cox regression, Least Absolute Shrinkage and Selection Operator (LASSO) Cox regression, and Random Survival Forests to identify the most predictive gene subsets [16] [12]. Risk models are subsequently constructed using multivariate Cox regression coefficients, with patients stratified into high- and low-risk groups based on median risk scores [4] [13]. Validation in independent datasets confirms model robustness, with performance assessed through Kaplan-Meier survival analysis, time-dependent receiver operating characteristic (ROC) curves, and concordance indices [16] [13].
Experimental Validation Strategies
Bioinformatic discoveries require experimental validation to confirm both expression patterns and functional roles. Common validation approaches include:
Reverse Transcription Quantitative Polymerase Chain Reaction (RT-qPCR): Used to verify differential gene expression in patient tissues, cell lines, or animal models [16] [20] [12]. For example, in cervical cancer, RT-qPCR confirmed upregulation of MMP1, TFRC, and CXCL8 in tumor tissues compared to normal controls [16].
Western Blot Analysis: Provides protein-level confirmation of URG expression and assesses functional consequences. In IPF research, Western blot validated increased ITCH and CDC20 expression in TGF-β1-treated MRC-5 cells [19].
Functional Assays: Include colony formation, EdU staining, xenograft tumorigenesis, and cell migration/invasion assays to elucidate biological roles. In ovarian cancer, FBXO45 was experimentally demonstrated to promote cancer growth, spread, and migration via the Wnt/β-catenin pathway [13].
Immunohistochemistry (IHC): Enables spatial localization of URG expression in tissue sections and correlation with pathological features. In colon cancer, IHC confirmed the diagnostic potential of ARHGAP4 and SIAH2 [18].
The Ubiquitination Machinery in Cancer
The ubiquitination process involves a sequential enzymatic cascade that regulates numerous cellular processes. Understanding this machinery provides context for interpreting URG expression patterns in cancer.
The ubiquitination cascade begins with E1 activating enzymes that initiate the process through ATP-dependent ubiquitin activation. E2 conjugating enzymes then carry the activated ubiquitin, while E3 ligating enzymes facilitate substrate recognition and catalyze ubiquitin transfer to specific target proteins [16] [13]. The human genome encodes approximately 8 E1s, 39 E2s, and over 800 E3s, enabling exquisite substrate specificity [13]. This system regulates critical cancer-relevant processes including cell cycle control, DNA damage repair, signal transduction, and protein degradation [16]. Dysregulation of specific components—particularly E3 ligases and deubiquitinating enzymes—has been identified across multiple cancers, underscoring their importance in tumor pathogenesis [16] [18].
URG Associations with Tumor Microenvironment and Therapy Response
URG expression patterns significantly influence tumor immune microenvironments and therapeutic responses. In cervical cancer, immune microenvironment analysis revealed that 12 immune cell types, including memory B cells and M0 macrophages, showed significant differences between high-risk and low-risk groups defined by URG signatures [16]. Similarly, in ovarian cancer, the low-risk URG group exhibited higher infiltration of CD8+ T cells, M1 macrophages, and follicular helper cells, suggesting a more immunologically active microenvironment [13].
Table 2: URG Associations with Therapeutic Response and Immune Features
| Cancer Type | URG Influence on Immune Microenvironment | Therapeutic Implications |
|---|---|---|
| Cervical Cancer | Differential infiltration of 12 immune cell types between risk groups; 4 immune checkpoints significantly different [16] | Risk model may guide immunotherapy approaches |
| Ovarian Cancer | Low-risk group: higher CD8+ T cells, M1 macrophages, follicular helper cells [13] | Enhanced immune surveillance in low-risk patients |
| Colon Cancer | High-risk group: enhanced EMT, immune escape, MDSC, Treg infiltration [18] | Low-risk group better response to CTLA4 inhibitors [18] |
| Lung Adenocarcinoma | High URRS group: higher PD1/L1, TMB, TNB, TME scores [12] | Lower IC50 values for various chemotherapy drugs [12] |
| DLBCL | Correlation with endocytosis mechanisms, T-cell function, and drug sensitivity [4] | Differential sensitivity to Boehringer Ingelheim compound 2536 and Osimertinib [4] |
The connection between URGs and therapy response extends beyond immune modulation. In lung adenocarcinoma, patients with higher ubiquitination-related risk scores (URRS) showed lower IC50 values for various chemotherapy drugs, suggesting enhanced susceptibility to conventional chemotherapies [12]. Similarly, in DLBCL, significant differences in drug sensitivity for Boehringer Ingelheim compound 2536 and Osimertinib were observed between URG-defined risk groups [4]. These findings highlight the potential of URG signatures to inform treatment selection across therapeutic modalities.
Research Reagent Solutions for URG Investigation
The experimental investigation of URGs requires specialized reagents and tools. The following table summarizes key resources for studying ubiquitination processes in cancer models.
Table 3: Essential Research Reagents for URG Investigation
| Reagent/Tool | Function | Application Examples |
|---|---|---|
| RT-qPCR Systems | Gene expression validation | Confirming URG differential expression in tumor vs. normal tissues [16] [20] |
| Western Blot Reagents | Protein expression and modification analysis | Detecting ubiquitination changes and URG protein levels [19] |
| CRISPR/Cas9 Systems | Gene knockout and editing | Functional validation of specific URGs in cancer models |
| Immunohistochemistry Kits | Spatial protein localization in tissues | Determining URG expression patterns in tumor sections [18] |
| Cell Culture Models | In vitro cancer systems | Functional assays (proliferation, migration, drug sensitivity) [13] [19] |
| Xenograft Mouse Models | In vivo tumor studies | Assessing URG effects on tumor growth and metastasis [18] [13] |
| Ubiquitination Databases | URG reference resources | iUUCD, MSigDB, UUCD for gene set identification [18] [13] [12] |
The systematic definition of ubiquitination-related genes and their expression landscapes across tumors represents a significant advance in cancer biology with direct translational implications. URG signatures provide robust prognostic information across diverse malignancies, often surpassing conventional clinicopathological parameters in predictive accuracy. These signatures consistently correlate with distinct tumor microenvironment features and therapy responses, highlighting their potential as biomarkers for treatment selection. The integration of bioinformatic discovery with experimental validation has established credible frameworks for continued exploration of the ubiquitin-proteasome system in cancer. As therapeutic strategies targeting ubiquitination pathways continue to emerge, particularly with the development of proteolysis-targeting chimeras (PROTACs), comprehensive understanding of URG expression patterns will become increasingly essential for advancing precision oncology approaches [13]. Future research directions should focus on validating these signatures in prospective clinical trials and developing standardized assays for implementation in routine oncologic practice.
Protein ubiquitination, a crucial post-translational modification, regulates fundamental cellular processes including proteasomal degradation, cell cycle progression, and DNA damage repair. Recent advances in transcriptomic analysis have revealed that specific ubiquitination-related gene (URG) signatures provide powerful prognostic value across diverse cancer types. These signatures reflect underlying tumor biology and microenvironment interactions, offering insights beyond conventional histopathological classifications. This guide compares key URG exemplars—OTULIN in diffuse large B-cell lymphoma (DLBCL) and FBXO45 in ovarian cancer—highlighting their prognostic significance, experimental validation, and clinical implications for researchers and drug development professionals.
URG Prognostic Signatures at a Glance
Table 1: Comparative Overview of Key Ubiquitination-Related Genes in Cancer Prognosis
| Feature | OTULIN in DLBCL | FBXO45 in Ovarian Cancer |
|---|---|---|
| Gene Function | Linear linkage-specific deubiquitinase [4] | F-box protein, substrate recognition component of E3 ubiquitin ligase [13] |
| Expression in Tumor | Low expression correlated with poor prognosis [4] | Overexpressed in tumor tissues [13] |
| Prognostic Value | Favorable prognostic marker [4] | Poor prognostic marker [13] |
| Risk Association | Low expression → High risk [4] | High expression → High risk [13] |
| Key Pathways | Endocytosis-related mechanisms, T-cell function [4] | Wnt/β-catenin signaling pathway [13] |
| Therapeutic Implications | Correlated with sensitivity to Boehringer Ingelheim compound 2536 and Osimertinib [4] | Potential target for proteolysis-targeting chimeras (PROTACs) [13] |
Table 2: Multi-Gene Ubiquitination Signatures in Cancer Prognosis
| Cancer Type | Signature Genes | Prognostic Performance | Biological Associations |
|---|---|---|---|
| Ovarian Cancer | HSP90AB1, FBXO9, SIGMAR1, STAT1, SH3KBP1, EPB41L2, DNAJB6, VPS18, PPM1G, AKAP12, FRK, PYGB [21] | 1-year AUC: 0.737, 3-year AUC: 0.762, 5-year AUC: 0.793 [21] | B-cell receptor signaling, ECM receptor interaction, focal adhesion [21] |
| DLBCL | CDC34, FZR1, OTULIN [4] | Validated in GSE10846 and GSE181063 datasets [4] | Endocytosis-related mechanisms, T-cell function, drug sensitivity [4] |
| Ovarian Cancer | FBXO9, UBD [22] | Accurate OS prediction in TCGA-OV and GSE32062 datasets [22] | DNA damage repair activity, immunocyte infiltration [22] |
OTULIN in DLBCL: Mechanisms and Methodologies
Biological Functions and Prognostic Significance
OTULIN (OTU Deubiquitinase with Linear Linkage Specificity) functions as a deubiquitinating enzyme with specificity for linear ubiquitin chains. In DLBCL, decreased OTULIN expression associates with significantly poorer patient outcomes, positioning it as a favorable prognostic biomarker [4]. The gene participates in endocytosis-related mechanisms and T-cell function, with its expression pattern correlating with differential responses to targeted therapeutics including Boehringer Ingelheim compound 2536 and Osimertinib [4].
Experimental Protocols and Analytical Workflows
Data Acquisition and Processing: Researchers analyzed three DLBCL datasets (GSE181063, GSE56315, and GSE10846) encompassing 1,800 DLBCL samples. The GSE10846 dataset served as the training set, while GSE181063 provided independent validation [4].
Differential Gene Screening: Using the limma package, investigators identified differentially expressed genes (DEGs) between tumor and normal tissue groups with thresholds of Fold Change > 2 and FDR < 0.05. Survival-associated ubiquitination-related genes were selected through univariate Cox regression analysis [4].
Prognostic Model Construction: LASSO Cox survival analysis implemented via the "glmnet" package identified the most valuable prognostic genes. Ten-fold cross-validation determined the optimal penalty parameter. Risk scores were calculated using the formula: β1 * Exp1 + β2 * Exp2 + βi * Expi, where β represents coefficients from multivariate Cox regression and Exp denotes gene expression levels [4].
Immune Microenvironment Assessment: The CIBERSORT package analyzed immune cell infiltration in DLBCL samples, with Wilcoxon rank-sum tests identifying differences between risk groups. Drug sensitivity analysis employed the oncoPredict package to calculate IC50 values for 198 therapeutic compounds [4].
FBXO45 in Ovarian Cancer: Mechanisms and Methodologies
Biological Functions and Prognostic Significance
FBXO45 functions as a critical substrate-recognition component of E3 ubiquitin ligase complexes. In ovarian cancer, FBXO45 overexpression promotes tumor growth, spread, and migration through activation of the Wnt/β-catenin pathway [13]. Experimental evidence confirms FBXO45 enhances cell viability and glycolysis in cancer models through DUSP2 ubiquitination-mediated ERK1/2 activation [23]. The high-risk group defined by URG signatures demonstrates significantly lower overall survival (P < 0.05) and distinct immune microenvironment characteristics, including altered CD8+ T cell and macrophage infiltration patterns [13].
Experimental Protocols and Analytical Workflows
Transcriptomic Data Processing: Researchers obtained transcriptomes and clinical profiles for 376 tumor and 88 normal ovarian tissue samples from TCGA-OV and GTEx databases. Differential gene expression analysis used the 'edgeR' package with thresholds of |logFC| ≥ 1 and corrected p-value < 0.01 [13].
Ubiquitination Gene Selection: The ubiquitin-related gene set (929 genes) came from the UUCD database, categorized into E1 (8 genes), E2 (39 genes), and E3 (882 genes) enzyme classes. Intersection with DEGs identified 162 co-expressed ubiquitination-related genes for model construction [13].
Prognostic Model Development: LASSO regression analysis and DEVIANCE test applied to candidate genes identified 17 genes for the final prognostic model. The risk score calculation formula: Risk score = Σ(Coefi × Ai), where Coefi represents regression coefficient and Ai represents gene expression level [13].
Immune and Mutation Analysis: ESTIMATE algorithm calculated stromal and immune scores, while "maftools" package analyzed somatic mutation data. Single-cell RNA sequencing data from E-MTAB-8381 dataset enabled cellular resolution analysis of the tumor microenvironment [13].
Experimental Validation: Cell culture studies using A2780 and HEY ovarian cancer cell lines included STR analysis and mycoplasma testing. Functional assays measured cell viability (CCK-8), metabolic characteristics (Seahorse assays), lactate production, and protein expression (Western blotting). Mouse xenograft models validated in vivo effects [13].
The Scientist's Toolkit: Essential Research Reagents
Table 3: Key Research Reagent Solutions for URG Investigation
| Reagent/Category | Specific Examples | Research Application |
|---|---|---|
| Cell Lines | A2780, HEY (ovarian cancer); DLBCL-derived lines | In vitro functional validation of URG mechanisms [13] |
| Culture Media | DMEM, RPMI 1640 (Gibco) | Cell maintenance and propagation [13] |
| Antibodies | Anti-Ubiquitin linkage-specific K48 (Abcam); FBXO9 Rabbit Polyclonal Antibody (ORIGENE) | Immunohistochemistry, Western blot analysis [22] |
| Transfection Reagent | Lipo8000 | Genetic manipulation (knockdown/overexpression) [13] |
| Analysis Packages | limma, edgeR, glmnet, survminer, ClusterProfiler (R/Bioconductor) | Bioinformatics analysis of differential expression, survival, enrichment [13] [4] |
| Database Resources | TCGA, GTEx, GEO, UUCD, iUUCD 2.0, STRING | Data source for model building and validation [13] [4] [22] |
| Animal Models | Mouse xenograft models | In vivo validation of URG functions [13] |
The systematic comparison of OTULIN in DLBCL and FBXO45 in ovarian cancer reveals both shared and distinct patterns of ubiquitination-related gene function in cancer prognosis. While both genes enable risk stratification and inform therapeutic approaches, they operate at different regulatory levels—OTULIN as a deubiquitinating enzyme and FBXO45 as an E3 ligase component. These exemplars demonstrate how ubiquitination signatures reflect fundamental cancer biology while offering clinically actionable insights. The experimental methodologies outlined provide a framework for extending similar analyses to other cancer types and ubiquitination-related genes, potentially accelerating the development of ubiquitination-targeted therapies across oncology.
Ubiquitination is a crucial post-translational modification process that regulates specific protein degradation in eukaryotes through a highly-specific, adenosine triphosphate-dependent pathway. This reversible process is mediated by three enzyme types: E1 ubiquitin-activating enzyme, E2 ubiquitin-conjugating enzyme, and E3 ubiquitin ligase, which collectively recognize substrate proteins and catalyze ubiquitin transfer [24]. The ubiquitin-proteasome system plays important roles in numerous cell signaling pathways and biological processes, including protein activation, DNA replication and repair, cell cycle control, chromatin dynamics, transcription signaling transduction, autophagy, and immune response [24]. Given these fundamental functions, ubiquitination-related genes (URGs) have emerged as important biomarkers and therapeutic targets in cancer research.
In recent years, numerous studies have demonstrated that aberrant expression of URGs correlates with clinical outcomes across various cancer types. The development of prognostic signatures based on URG expression patterns represents a promising approach for improving risk stratification and clinical decision-making for cancer patients. This guide comprehensively compares published URG-based prognostic signatures, their experimental validation, and clinical applications to provide researchers and drug development professionals with an objective assessment of this rapidly evolving field.
Comparative Analysis of URG Prognostic Signatures Across Cancers
Signature Composition and Performance Metrics
Table 1: Comparison of URG Prognostic Signatures Across Cancer Types
| Cancer Type | Signature Genes | Patient Cohort | Performance (AUC) | Clinical Utility | Reference |
|---|---|---|---|---|---|
| Breast Cancer | CDC20, PCGF2, UBE2S, SOCS2 | GSE42568 (104 BC + 17 normal), TCGA (1089 tumors + 112 normal) | Favorable in test set (GSE20685) | Independent risk factor; Classifies high/low-risk groups | [24] |
| Diffuse Large B-Cell Lymphoma | CDC34, FZR1, OTULIN | GSE181063, GSE56315, GSE10846 (1,800 DLBCL samples) | Validated in independent sets | Correlates with immune microenvironment; Drug sensitivity predictor | [4] |
| Pancreatic Ductal Adenocarcinoma | 3-gene signature (unspecified) | TCGA-PAAD (178 tumors + 4 normal), GTEx, ICGC-PACA-AU (88 samples) | Robust validation across multiple sets | Predicts immune status; Guides therapy selection | [25] |
| Ovarian Cancer | 17-gene signature including FBXO45 | TCGA-OV (376 tumors), GTEx (88 normal) | 1-year: 0.703, 3-year: 0.704, 5-year: 0.705 | Reflects immune microenvironment; FBXO45 promotes growth via Wnt/β-catenin | [13] |
| Laryngeal Cancer | PPARG, LCK, LHX1 | TCGA-LC, GSE65858 | Strong discrimination of OS | Predicts immunotherapy response; Guides personalized treatment | [26] |
| Gastric Cancer | 9-consensus-gene signature | GEO cohorts (921 patients total) | HR: 3.81 (95% CI: 2.44-5.96) | Predicts chemo-/immunotherapy response; Superior to TNM alone | [27] |
Methodological Approaches for Signature Development
Table 2: Experimental Protocols and Analytical Methods for URG Signature Development
| Methodological Step | Standard Protocols | Key Software/Packages | Output Validation |
|---|---|---|---|
| Data Collection | TCGA, GEO, ICGC database mining | GEO2R, UCSC Xena | Cross-platform normalization |
| Differential Expression Analysis | limma package (∣log₂FC∣ > 1, adjust p < 0.05) | Volcano plots, heatmaps | |
| Prognostic Gene Screening | Univariate Cox regression | survival package | Hazard ratios with significance (p < 0.05) |
| Signature Construction | LASSO Cox regression | glmnet package (10-fold cross-validation) | Minimum lambda selection |
| Model Validation | Kaplan-Meier analysis | survminer package | Log-rank test p-values |
| Performance Assessment | Time-dependent ROC curves | timeROC package | AUC calculations (1, 3, 5-year) |
| Immune Microenvironment Analysis | CIBERSORT, ESTIMATE, ssGSEA | Immunedeconv, e1071 packages | Immune cell infiltration scores |
| Drug Sensitivity Prediction | oncoPredict | pRRophetic algorithm | IC50 values |
Key URG Biomarkers and Their Functional Roles
Multi-Gene Signatures Versus Single URG Biomarkers
Research has followed two complementary approaches for linking URG expression to clinical outcomes: multi-gene prognostic signatures and single URG biomarkers. Multi-gene signatures typically demonstrate superior predictive power by capturing the complexity of ubiquitination pathways, while single URG biomarkers offer more straightforward mechanistic insights and potential as therapeutic targets.
The 4-URG signature for breast cancer (CDC20, PCGF2, UBE2S, SOCS2) exemplifies the multi-gene approach. According to the development study, this signature demonstrated significant capacity to classify breast cancer patients into high-risk and low-risk groups with markedly different overall survival outcomes (p < 0.001) [24]. Gene Set Enrichment Analysis (GSEA) revealed that this 4-URG signature may be functionally related to DNA replication, DNA repair, and cell cycle pathways, providing biological plausibility for its prognostic value [24].
In contrast, studies focusing on URG4 (Upregulator of Cell Proliferation 4) demonstrate the single-biomarker approach. URG4 has been investigated across multiple cancer types including gastric carcinoma, cervical cancer, and osteosarcoma, with consistent findings associating its overexpression with poor clinical outcomes [28] [29] [30].
URG4 as a Pan-Cancer Prognostic Indicator
Table 3: URG4 as a Prognostic Biomarker Across Cancer Types
| Cancer Type | Study Details | Key Findings | Clinical Implications | |
|---|---|---|---|---|
| Gastric Cancer | 61 patients; IHC scoring | High URG4 (61%) correlated with T stage (p < 0.005) and lymphovascular invasion (p < 0.005); Significant association with 2-year survival (p < 0.05) | Independent prognostic factor; Similar predictive value to HER2 | [28] |
| Cervical Cancer | 167 patients (FIGO Ib1-IIa); IHC | High URG4 (35.13%) correlated with stage (p < 0.0001), tumor size (p = 0.012), T classification (p = 0.023), lymph node metastasis (p = 0.001); Independent prognostic factor in multivariate analysis | Shorter OS and DFS, especially in patients receiving CCRT (p < 0.0001) | [29] |
| Osteosarcoma | 46 patients; IHC | High URG4 (86.96%) in osteosarcoma specimens; Increased in recurrence (p < 0.05) and metastasis (p < 0.05); Correlation with PCNA | Mean OS: 54.08 months (high URG4) vs 70.01 months (low URG4) | [30] |
Experimental Validation Workflows
The development and validation of URG prognostic signatures follows a systematic workflow that integrates bioinformatics analysis with experimental validation. The standard methodology encompasses multiple stages from data collection through clinical correlation analysis, with rigorous statistical validation at each step.
Key Methodological Components
Data Collection and Preprocessing: Studies typically begin with acquiring large-scale transcriptomic data from public databases such as The Cancer Genome Atlas (TCGA), Gene Expression Omnibus (GEO), and International Cancer Genome Consortium (ICGC). For example, the ovarian cancer URG signature development utilized 376 tumor samples from TCGA-OV and 88 normal ovarian tissue samples from GTEx [13]. Normalization and batch effect correction are critical steps at this stage, often performed using R packages like "sva" [27].
Differential Expression and Prognostic Screening: Differentially expressed URGs are identified using thresholds such as |log₂FC| > 1 and adjusted p-value < 0.05 via the "limma" package [24] [25]. Prognostic significance is then assessed through univariate Cox regression analysis to identify genes significantly associated with overall survival.
Signature Construction Using LASSO Regression: The most informative genes are selected using Least Absolute Shrinkage and Selection Operator (LASSO) Cox regression analysis with 10-fold cross-validation to prevent overfitting [24] [4] [27]. This method reduces the dimensionality of the genetic data while retaining the most prognostically relevant genes.
Experimental Validation Approaches: Promising signatures and individual URGs typically undergo experimental validation. For example, the pancreatic ductal adenocarcinoma study used RT-qPCR to verify gene expression differences between normal and cancerous tissues [25]. Functional validation often includes in vitro assays such as colony formation, Transwell migration and invasion assays, and gene knockdown or overexpression experiments to establish causal relationships [25] [13].
The Scientist's Toolkit: Essential Research Reagents
Table 4: Key Research Reagents for URG Prognostic Signature Development
| Reagent Category | Specific Examples | Research Application | Experimental Function |
|---|---|---|---|
| Bioinformatics Tools | limma, glmnet, survminer, ESTIMATE | Signature development | Differential expression analysis, LASSO regression, survival analysis, immune microenvironment estimation |
| Databases | TCGA, GEO, ICGC, UUCD | Data sourcing | Provide transcriptomic, clinical, and ubiquitination-related gene data |
| Immunohistochemistry Antibodies | Anti-URG4 (Abcam Cat NO: 103,323), Anti-upregulator of cell proliferation 4 antibody (Sigma, HPA020134) | Protein validation | Detect and quantify URG protein expression in tissue specimens |
| Cell Lines | PANC-1 (pancreatic), A2780 (ovarian), HepG2 (hepatocellular), GES-1 (gastric) | Functional studies | Investigate URG functions through in vitro manipulation |
| Gene Manipulation Reagents | siRNA, Lipo8000 transfection reagent | Mechanistic studies | Knockdown specific URGs to study functional consequences |
| PCR and Western Blot Reagents | SYBR Green Real-Time PCR Master Mix Plus, RIPA buffer, PVDF membranes | Expression validation | Confirm gene and protein expression patterns |
Clinical Applications and Therapeutic Implications
Prognostic Stratification and Treatment Guidance
URG-based signatures show significant promise for enhancing prognostic stratification beyond conventional clinicopathological parameters. In gastric cancer, the 9-consensus-gene signature demonstrated significant prognostic value across multiple validation cohorts with hazard ratios of 3.81 (95% CI: 2.44-5.956) in GSE62254 and 2.65 (95% CI: 1.892-3.709) in GSE15459 [27]. Multivariate analysis confirmed these signatures as independent prognostic factors, suggesting they provide complementary information to traditional staging systems.
Therapeutic implications represent perhaps the most promising application of URG signatures. Studies consistently reveal correlations between risk groups and sensitivity to various treatment modalities. For example, in gastric cancer, researchers proposed that low-risk patients might be more suitable for 5-fluorouracil therapy, while high-risk patients could potentially benefit more from anti-CTLA4 immunotherapy [27]. Similarly, in laryngeal cancer, analyses suggested that chemotherapy would be more effective in high-risk patients, while immune checkpoint inhibitors would show better efficacy in low-risk patients [26].
Immune Microenvironment Modulation
URG signatures provide significant insights into tumor immune microenvironment composition, which has implications for immunotherapy response prediction. The ovarian cancer study found that low-risk patients had significantly higher levels of CD8+ T cells (p < 0.05), M1 macrophages (p < 0.01), and follicular helper cells (p < 0.05) [13]. Similarly, in pancreatic cancer, the low-risk group demonstrated elevated ESTIMATE scores, ImmuneScores, and StromalScores, indicating distinct immune microenvironments between risk groups [25].
The connection between ubiquitination processes and immune regulation provides biological plausibility for these observations. For instance, in laryngeal cancer, researchers identified correlations between signature genes (PPARG, LCK, LHX1) and immune-promoting microenvironments, with LCK showing positive correlation while PPARG and LHX1 demonstrated negative correlations with favorable immune characteristics [26].
The growing body of evidence supports the clinical potential of URG-based prognostic signatures across diverse cancer types. These signatures demonstrate consistent value in risk stratification, treatment selection guidance, and understanding tumor biology, particularly regarding immune microenvironment interactions. The convergence of ubiquitination pathway biology with cancer prognosis offers exciting opportunities for both prognostic tool development and therapeutic target identification.
Future research directions should include larger prospective validations of the most promising signatures, standardization of analytical approaches across institutions, and integration of URG signatures with other molecular markers to create comprehensive prognostic systems. Furthermore, the therapeutic targeting of high-risk URGs represents a promising avenue for drug development, particularly as proteolysis-targeting chimera (PROTAC) technologies advance. As these biomarkers continue to undergo refinement and validation, they hold significant promise for advancing personalized cancer care.
Building and Applying Ubiquitination-Based Prognostic Models in Oncology
The discovery of ubiquitination-related genes (URGs) with prognostic value in cancer hinges on robust data sourcing from major public repositories. This guide provides a structured comparison of The Cancer Genome Atlas (TCGA), Gene Expression Omnibus (GEO), and the Genotype-Tissue Expression (GTEx) projects, outlining experimental protocols for data retrieval and analysis. We objectively compare the data accessibility, types, and volumes across these platforms, providing a foundational framework for researchers to design efficient URG discovery pipelines. By integrating practical methodologies with visualization of workflows, this guide serves as an essential toolkit for cancer researchers and drug development professionals.
The landscape of cancer genomics research is powered by large-scale public databases that provide comprehensive molecular profiling data. For investigators studying the role of ubiquitination in cancer prognosis, three databases are particularly fundamental: The Cancer Genome Atlas (TCGA), the Gene Expression Omnibus (GEO), and the Genotype-Tissue Expression (GTEx) project. Each offers unique strengths—TCGA provides multi-omics data from thousands of cancer patients alongside clinical outcomes, enabling direct prognostic association studies. GEO serves as a vast repository of curated gene expression datasets from diverse experimental conditions, allowing for validation and meta-analysis. GTEx provides essential reference data from normal human tissues, crucial for distinguishing cancer-specific ubiquitination patterns from normal biological variation. Understanding the architecture, data types, and access methods for these resources is the critical first step in building a rigorous URG discovery pipeline.
Database Comparative Analysis
A systematic evaluation of database characteristics reveals complementary strengths for URG discovery. The table below provides a quantitative comparison of core attributes.
Table 1: Core Database Characteristics for URG Discovery
| Feature | TCGA | GEO | GTEx |
|---|---|---|---|
| Primary Focus | Cancer genomics & clinical correlation | Curated gene expression datasets | Normal tissue gene expression |
| Key Data Types | Genomic, transcriptomic, epigenetic, clinical | Gene expression, methylation, SNP arrays | RNA-seq, WGS, histopathology |
| Data Access Method | GDC API, Data Portal [31] [32] | GEO Accession Viewer, FTP [33] | GTEx Portal, dbGaP |
| API Availability | Comprehensive REST API [34] [32] | Limited, bulk FTP preferred [33] | Limited public API |
| Use Case in URG Research | Primary discovery & prognostic modeling | Independent validation & meta-analysis | Normal tissue baseline reference |
A deeper analysis of technical accessibility and data structure further differentiates these resources.
Table 2: Technical Accessibility and Data Structure
| Characteristic | TCGA (via GDC) | GEO | GTEx |
|---|---|---|---|
| Data Structure | Harmonized, standardized processing [31] | Submitter-provided, heterogeneous | Standardized processing pipeline |
| Metadata Richness | Highly standardized clinical & molecular data [31] | Varies by submitter; can be extensive | Detailed donor and tissue metadata |
| Best For | Building unified, large-scale cohorts | Finding specific experimental conditions | Establishing normal expression baselines |
Experimental Protocols for Data Sourcing
Programmatic Data Retrieval from TCGA via GDC API
The Genomic Data Commons (GDC) provides a powerful API for programmatic data access, which is essential for reproducible URG research [32]. The following R code demonstrates a robust protocol for mapping file UUIDs to TCGA patient barcodes and downloading data, addressing common issues with legacy archive queries [34].
For efficient file downloads using the obtained metadata, a POST request with a file of UUIDs is recommended for large datasets [32].
Targeted Dataset Retrieval from GEO
GEO dataset sourcing relies on accession numbers and understanding its SOFT format. The protocol emphasizes dataset curation and meta-information extraction.
Establishing Normal Baselines with GTEx
GTEx data provides normal tissue expression baselines. While access often involves dbGaP authorization, the analysis pipeline focuses on VST-normalized RNA-seq TPM values from the GTEx Portal for comparison with TCGA tumor data.
Visualizing Data Sourcing Workflows
The integrated workflow for URG discovery leverages all three databases in a complementary fashion, as shown in the following diagram.
Figure 1: Integrated URG Discovery Workflow. This diagram outlines the synergistic use of TCGA for primary discovery, GTEx for normal tissue reference, and GEO for independent validation.
The specific process for programmatic data retrieval from the TCGA via the GDC API is detailed below.
Figure 2: TCGA Data Retrieval via GDC API. This protocol ensures efficient, reproducible acquisition of genomic data linked to clinical outcomes.
The Scientist's Toolkit for URG Discovery
Successful data sourcing and analysis require a suite of computational tools and reagents. The following table details essential components of the URG discovery pipeline.
Table 3: Essential Research Toolkit for URG Discovery
| Tool/Reagent | Category | Primary Function in URG Discovery |
|---|---|---|
| GDC Data Transfer Tool | Data Access | High-performance reliable download of TCGA data [31] |
| cURL | Data Access | Command-line tool for API interactions and data transfer [34] [32] |
| R/Bioconductor | Analysis | Statistical analysis, visualization, and package ecosystem (TCGAbiolinks) |
| TCGAbiolinks | Analysis | Specialized R package for TCGA data harmonization and analysis |
| Python Requests | Analysis | HTTP library for programmatic API access in Python environments [34] |
| Ubiquitin Antibodies | Wet-lab Reagent | Validation of URG protein expression via Western Blot/IHC |
| Proteasome Inhibitors | Wet-lab Reagent | Stabilize ubiquitinated proteins for functional studies |
| Mutation-Specific Antibodies | Wet-lab Reagent | Detect specific ubiquitination marks (e.g., K48-/K63-linked chains) |
This guide provides a comprehensive framework for leveraging TCGA, GEO, and GTEx databases to advance ubiquitination signature research. The comparative analysis reveals that while TCGA offers the most structured platform for primary discovery with integrated clinical data, GEO and GTEx provide essential complementary functions for validation and baseline establishment. The experimental protocols and visualizations offer actionable pathways for researchers to implement these data sourcing strategies. By applying these standardized methodologies, the research community can accelerate the identification and validation of ubiquitination-related genes with significant prognostic value in cancer, ultimately contributing to improved therapeutic strategies.
Ubiquitination-related genes (URGs) have emerged as pivotal regulators of tumor progression and therapy resistance. This review objectively compares bioinformatics pipelines for identifying survival-associated URGs across multiple cancer types, including diffuse large B-cell lymphoma (DLBCL), laryngeal cancer, glioma, and lung adenocarcinoma. By evaluating experimental protocols, predictive performance metrics, and clinical applicability of URG-based prognostic signatures, we demonstrate that integrated approaches combining differential expression analysis with Cox regression consistently yield robust risk stratification models. These signatures show significant prognostic value across cancer types, with hazard ratios (HR) for high-risk groups ranging from 1.04 to 3.27 across studies. Furthermore, URG signatures provide insights into tumor immune microenvironment composition and therapeutic response, positioning them as valuable tools for personalized cancer treatment.
The ubiquitin-proteasome system represents a crucial regulatory mechanism in cellular homeostasis, controlling protein degradation, cell cycle progression, DNA repair, and immune response. Dysregulation of ubiquitination processes has been implicated in various aspects of tumorigenesis, including uncontrolled proliferation, metastasis, and treatment resistance. Recent advances in bioinformatics have enabled the systematic identification of ubiquitination-related gene signatures with prognostic significance across cancer types.
Bioinformatics pipelines integrating differential expression analysis with survival regression models have proven particularly effective in extracting meaningful prognostic information from transcriptomic data. These approaches have revealed that ubiquitination signatures not only predict patient outcomes but also reflect the immunological status of tumors and potential response to therapies, including immune checkpoint inhibitors and targeted agents.
Comparative Analysis of URG Signature Performance Across Cancers
Table 1: Performance Metrics of URG-Based Prognostic Signatures Across Cancer Types
| Cancer Type | Signature Genes | Cohort Size | Prediction AUC | Hazard Ratio (HR) | Clinical Validation |
|---|---|---|---|---|---|
| Diffuse Large B-Cell Lymphoma (DLBCL) | CDC34, FZR1, OTULIN | 1,800 samples | 1-year: ~0.752-year: ~0.723-year: ~0.70 | High vs. Low Risk: 2.18-3.27 | Independent dataset (GSE181063) [4] |
| Laryngeal Cancer | PPARG, LCK, LHX1 | 116 TCGA + 46 GEO | 1-year: 0.722-year: 0.693-year: 0.71 | High vs. Low Risk: 2.45 | External validation (GSE65858) [35] |
| Glioma | USP4 + 7-gene signature | TCGA cohort | 1-year: ~0.783-year: ~0.75 | High vs. Low Risk: 2.85 | In vitro functional validation [36] |
| Lung Adenocarcinoma (LUAD) | 8-gene signature | 461 TCGA samples | 12-month: 0.7618-month: 0.753-year: 0.74 | Not reported | Comparison with established signatures [37] |
Table 2: Immune and Therapeutic Correlations of URG Signatures
| Cancer Type | Immune Microenvironment Associations | Therapeutic Implications | Experimental Validation |
|---|---|---|---|
| DLBCL | Correlation with T-cell infiltration and endocytosis mechanisms; Significant differences in immune scores between risk groups | Differential sensitivity to Boehringer Ingelheim compound 2536 and Osimertinib | Single-cell sequencing; Drug sensitivity analysis [4] |
| Laryngeal Cancer | Low-risk: Activated immune function, higher anti-cancer immune cells, immune-promoting cytokinesHigh-risk: Immunosuppressive microenvironment | Chemotherapy more effective in high-risk; ICIs more effective in low-risk | Western blot, qRT-PCR, ELISA for PPARG, LCK, LHX1 [35] |
| Glioma | Risk grouping guided immunotherapy strategies; Association with immune microenvironment | Potential for targeting USP4 to reduce invasion/migration | USP4 knockdown/overexpression in U87-MG, LN229, A172 cell lines [36] |
Core Bioinformatics Methodology: Differential Expression and Cox Regression
Experimental Protocol for URG Signature Development
The standard workflow for identifying survival-associated URGs follows a multi-stage analytical process, consistently applied across cancer types with minor variations:
1. Data Acquisition and Preprocessing:
- RNA-seq data and clinical information are obtained from public repositories (TCGA, GEO)
- Data normalization using TPM, FPKM, or similar methods
- Quality control including removal of samples with excessive missing data or outliers
- Integration of ubiquitin-related genes from specialized databases (iUUCD 2.0, UbiBrowser 2.0) [35]
2. Identification of Differentially Expressed URGs:
- Differential expression analysis using limma package with criteria typically set at fold change > 2 and FDR < 0.05
- Stratification of samples into high and low expression groups using survival-based cutpoints
- Intersection of differentially expressed genes with ubiquitination-related genes [4]
3. Survival-Associated URG Selection:
- Univariate Cox regression to identify URGs significantly associated with overall survival
- Least Absolute Shrinkage and Selection Operator (LASSO) Cox regression with 10-fold cross-validation to prevent overfitting
- Multivariate Cox regression to identify independently prognostic genes [4] [35]
4. Prognostic Signature Construction:
- Risk score calculation using the formula: Risk score = Σ(βi × Expi)
- Stratification of patients into high-risk and low-risk groups based on median risk score
- Validation in independent datasets to assess generalizability [4] [35]
5. Functional and Clinical Correlations:
- Immune microenvironment analysis using CIBERSORT or similar tools
- Drug sensitivity prediction using oncoPredict or comparable platforms
- Gene ontology and pathway enrichment analysis [4] [35]
Figure 1: Bioinformatics workflow for identifying survival-associated ubiquitination-related genes
Statistical Foundation: Cox Proportional Hazards Regression
Cox regression serves as the statistical cornerstone for identifying survival-associated URGs. The method models the hazard function as:
H(t) = H₀(t) × exp(b₁X₁ + b₂X₂ + b₃X₃ + ⋯ + bₖXₖ)
where H(t) represents the hazard at time t, H₀(t) is the baseline hazard, X₁...Xₖ are predictor variables (gene expression values), and b₁...bₖ are coefficients estimated by the regression [38].
The exponentiated coefficients, exp(bᵢ), represent hazard ratios (HR) – the instantaneous relative risk of the event (e.g., death) associated with a one-unit increase in the predictor variable, assuming other variables remain constant. For continuous variables like gene expression, exp(bᵢ) > 1 indicates increased risk with higher expression, while exp(bᵢ) < 1 indicates decreased risk [38].
Model performance is typically evaluated using Harrell's C-index (concordance index), with values near 1 indicating excellent predictive discrimination and values near 0.5 indicating no better than random prediction [38].
Key Ubiquitination Pathways and Biological Mechanisms
Figure 2: Biological mechanisms and pathways of prognostic ubiquitination-related genes
The ubiquitination-related genes identified through these bioinformatics pipelines participate in diverse but interconnected biological processes:
Cell Cycle Regulation: CDC34 and FZR1, identified in the DLBCL signature, function as regulators of cell cycle progression. Elevated expression of these genes promotes uncontrolled proliferation, correlating with poor prognosis [4].
Immune Microenvironment Modulation: Multiple URG signatures demonstrate strong associations with immune cell infiltration and function. In laryngeal cancer, PPARG expression correlates with immunosuppressive cytokines (IL6, TGFB1, TGFB2, VEGFC), while LCK shows positive association with immuno-promoting microenvironment [35]. Similarly, in DLBCL, the URG signature correlates with T-cell infiltration and endocytosis-related mechanisms [4].
Treatment Response Mechanisms: USP4 in glioma enhances cell invasion, migration, and colony formation capacity, as demonstrated through knockdown and overexpression experiments [36]. URG signatures also show predictive value for drug sensitivity, with differential responses to targeted therapies observed between risk groups in DLBCL and laryngeal cancer [4] [35].
The Scientist's Toolkit: Essential Research Reagents and Platforms
Table 3: Essential Research Resources for URG Prognostic Signature Development
| Resource Category | Specific Tools/Platforms | Application in URG Research |
|---|---|---|
| Data Sources | TCGA (The Cancer Genome Atlas)GEO (Gene Expression Omnibus)GTEx (Genotype-Tissue Expression) | Source of RNA-seq data and clinical information for analysis [4] [35] |
| Ubiquitin Databases | iUUCD 2.0UbiBrowser 2.0 | Comprehensive collections of experimentally verified ubiquitination-related genes and interactions [35] |
| Bioinformatics Packages | limma (R)survival (R)glmnet (LASSO)CIBERSORToncoPredict | Differential expression analysis, survival modeling, feature selection, immune deconvolution, drug sensitivity prediction [4] [38] |
| Validation Platforms | GEPIA2UALCANPROGgene V2 | Independent validation of expression patterns and survival correlations [39] |
| Experimental Validation | Western blotqRT-PCRELISACell line models (e.g., U87-MG, LN229, A172) | Confirmation of gene expression and functional characterization of URGs [36] [35] |
Bioinformatics pipelines integrating differential expression analysis with Cox regression have consistently demonstrated utility in identifying ubiquitination-related gene signatures with prognostic significance across cancer types. These signatures not only stratify patients into distinct risk categories but also provide insights into tumor biology, immune microenvironment composition, and potential therapeutic responses.
The reproducibility of findings across independent datasets and cancer types underscores the robustness of this methodological approach. Furthermore, the experimental validation of key signature genes in model systems strengthens the biological plausibility of these computational predictions.
Future directions in this field will likely focus on integrating multi-omics data, developing pan-cancer ubiquitination signatures, and translating these findings into clinical applications for personalized treatment selection. As ubiquitination-targeting therapies continue to emerge, these prognostic signatures may guide patient stratification for targeted interventions.
LASSO-Cox regression represents a pivotal methodological advancement in cancer prognostic research, combining the Cox proportional hazards model with Least Absolute Shrinkage and Selection Operator (LASSO) regularization to address high-dimensional data challenges. This technique is particularly valuable in modern oncology research where the number of potential predictors (such as genomic features, clinical variables, and molecular biomarkers) often approaches or exceeds the sample size. The integration of ubiquitination signatures into prognostic modeling presents both opportunities and challenges due to the complex biological networks involved in protein ubiquitination pathways. LASSO-Cox regression efficiently handles this complexity by performing automatic variable selection while preventing model overfitting, making it ideal for identifying the most relevant ubiquitination-related biomarkers from large candidate sets [40].
The fundamental strength of LASSO-Cox in ubiquitination signature research lies in its ability to generate sparse, interpretable models while maintaining predictive accuracy. As researchers increasingly investigate ubiquitination-related genes (URGs) and their impact on cancer progression, LASSO-Cox provides a robust statistical framework for distinguishing genuine prognostic signals from noise. This is particularly important given that the ubiquitin-proteasome system comprises numerous components—including ubiquitin-activating enzymes (E1s), ubiquitin-conjugating enzymes (E2s), ubiquitin ligases (E3s), and deubiquitinating enzymes—whose cooperative effects influence tumor progression [12]. By applying L1 regularization, LASSO-Cox regression identifies the most impactful variables within these complex biological systems, enabling the construction of parsimonious risk models with enhanced clinical applicability.
Mathematical Foundation
LASSO-Cox regression integrates the Cox proportional hazards model with an L1 penalty term to perform simultaneous variable selection and parameter estimation. The Cox model defines the hazard function at time t for a patient with covariate vector X as h(t|X) = h₀(t)exp(βᵀX), where h₀(t) is the baseline hazard function and β represents the coefficient vector. The LASSO-Cox estimator is obtained by maximizing the penalized partial likelihood:
The regularization parameter λ controls the penalty strength, with larger values resulting in more coefficients shrunk to zero. The optimal λ value is typically determined through k-fold cross-validation, often using the "lambda.min" (value that minimizes cross-validation error) or "lambda.1se" (most regularized model within one standard error of the minimum) criteria [40]. For ubiquitination signature analysis, this mathematical framework enables the identification of a minimal set of URGs with genuine prognostic value while excluding redundant or noisy variables.
Adaptive LASSO Extension
An advanced variant, Adaptive LASSO, introduces weight-based penalties to improve variable selection consistency. The penalty term becomes λ∑ŵj|βj|, where ŵj = 1/|β̂(ols)|γ with γ > 0. This modification applies greater penalty to coefficients with smaller initial estimates, enhancing the method's ability to select the correct set of predictors—particularly valuable when analyzing ubiquitination-related genes where some enzymes may have subtle but biologically important effects [41]. Adaptive LASSO maintains the oracle property (consistent variable selection and asymptotically normal estimation), making it superior for ubiquitination signature research where identifying truly causal molecular features is essential.
Comparative Performance Analysis of Prognostic Modeling Techniques
Quantitative Comparison Across Cancer Types
Table 1: Performance comparison of LASSO-Cox regression against alternative methods across cancer types
| Cancer Type | Comparison Method | C-Index/LASSO-Cox | C-Index/Alternative | Variable Selection Efficiency | Reference |
|---|---|---|---|---|---|
| Nasopharyngeal Carcinoma | Stepwise Cox | 0.749 (5-year PFS) | Not reported | Selected 2/6 predictors vs. 3/6 with stepwise | [42] |
| Gastric Carcinoma | AJCC 8th Edition Staging | 0.651 (PFS) | 0.543 (PFS) | Identified 6 clinically relevant predictors | [43] |
| Lung Adenocarcinoma | Random Survival Forest + Cox | 0.58 (HR in validation) | Similar performance | Selected 4 ubiquitination-related genes | [12] |
| Diffuse Large B-Cell Lymphoma | Conventional Cox | 0.65-0.75 (typical range) | ~0.60 (without regularization) | 1-3% selection proportion in high-dimensional data | [4] [40] |
| Rectal Cancer | Clinical Factor-Based Scoring | Significantly different median OS (138.3 vs 64.6 months) | Limited to univariate significant factors | Integrated multiple prognostic factors into single score | [44] |
Analysis of Comparative Performance
The quantitative comparisons demonstrate LASSO-Cox's consistent advantage over traditional methods. In gastric cancer with "double invasion" characteristics, LASSO-Cox significantly outperformed AJCC staging (C-index: 0.651 vs. 0.543) by integrating gender, positive lymph node count, surgical approach, PTEN/FHIT expression, and tumor diameter into a nomogram with superior predictive accuracy for 3- and 5-year progression-free survival [43]. Similarly, in nasopharyngeal carcinoma, the method efficiently identified clinical stage and EBV level as independent prognostic factors from six candidate variables, generating a nomogram with AUC-ROC values of 0.801, 0.760, and 0.749 for predicting 2-, 3-, and 5-year PFS, respectively [42].
For high-dimensional genomic data, LASSO-Cox demonstrates particular strength in variable selection efficiency. In DLBCL studies analyzing ubiquitination-related genes, the method typically selects only 1-3% of available predictors while maintaining predictive accuracy [4] [40]. This sparse selection is invaluable for ubiquitination signature research, where focusing on the most biologically relevant enzymes and substrates enhances both model interpretability and clinical translation potential. The method's ability to handle correlated predictors—common in ubiquitination pathways due to functional redundancies—further distinguishes it from traditional stepwise selection procedures, which often struggle with multicollinearity.
Experimental Protocols for LASSO-Cox Implementation
Standardized Workflow for Ubiquitination Signature Analysis
Detailed Methodological Protocols
Data Preparation and Ubiquitination-Related Variable Screening
The initial phase involves comprehensive data curation, particularly crucial for ubiquitination signature research. Researchers should collect ubiquitination-related genes from specialized databases such as iUUCD 2.0, which catalogs E1, E2, and E3 enzymes alongside deubiquitinating enzymes [12]. For nasopharyngeal carcinoma analysis, relevant clinical variables including TNM staging, EBV DNA levels, age, gender, and treatment details should be compiled [42]. Data preprocessing must address missing values through appropriate imputation methods (e.g., Multiple Imputation by Chained Equations for <5% missingness) and standardize continuous variables to ensure comparable scaling for regularization [41]. The dataset should then be randomly partitioned into training and validation sets, typically in a 7:3 ratio, ensuring balanced distribution of key clinical characteristics between sets [42].
LASSO-Cox Implementation with Cross-Validation
The core analytical phase begins with fitting the LASSO-Cox model to the training data. Using R software implementation, researchers should employ the "glmnet" package with family="cox" specification [4] [40]. The critical step involves k-fold cross-validation (typically 10-fold for moderate sample sizes) to determine the optimal regularization parameter λ. Two primary λ values should be considered: "lambda.min" (minimizes cross-validation error) provides the best fit, while "lambda.1se" (most regularized model within one standard error of minimum) yields a more parsimonious model beneficial for clinical translation [40]. For ubiquitination signature analysis, where biological interpretability is paramount, the λ.1se approach often proves more valuable by selecting only the most robust prognostic URGs.
Risk Score Calculation and Model Validation
For the final selected model, risk scores for individual patients are calculated using the linear predictor formula: Risk score = Σ(βi × Expi), where βi represents the shrunken coefficients from LASSO-Cox and Expi denotes the expression values of selected ubiquitination-related genes [12]. Patients are then stratified into high-risk and low-risk groups based on the median risk score or clinically relevant cutpoints. Validation procedures must include both internal (bootstrapping, cross-validation) and external (independent cohort) validation [43]. Performance metrics should encompass time-dependent receiver operating characteristic curves, calibration plots assessing agreement between predicted and observed outcomes, and decision curve analysis to evaluate clinical utility [42] [43]. For ubiquitination signatures, additional validation should include functional enrichment analysis of selected genes to ensure biological plausibility.
Table 2: Essential research reagents and computational tools for LASSO-Cox analysis of ubiquitination signatures
| Category | Specific Tool/Reagent | Function in Analysis | Implementation Example |
|---|---|---|---|
| Data Resources | iUUCD 2.0 Database | Provides comprehensive catalog of ubiquitination-related genes | Source of URGs for lung adenocarcinoma analysis [12] |
| GEO/TGCA Databases | Source of cancer genomics datasets with clinical outcomes | Training (GSE10846) and validation (GSE181063) sets for DLBCL [4] | |
| Computational Tools | R "glmnet" Package | Implements LASSO-Cox regression with cross-validation | Variable selection in nasopharyngeal carcinoma study [42] |
| "survminer" R Package | Survival analysis and visualization | Kaplan-Meier curves for risk stratification [4] | |
| "ConsensusClusterPlus" | Molecular subtyping based on ubiquitination patterns | Identification of ubiquitination subtypes in LUAD [12] | |
| Laboratory Reagents | Plasma/Serum Collection Tubes | Biomarker sample acquisition | Lithium heparin tubes for plasma proteomics in NSCLC [45] |
| Protein Depletion Columns | Remove high-abundance proteins for proteomics | Agilent Mars14 columns for plasma proteomics [45] | |
| iTRAQ Reagents | Multiplexed quantitative proteomics | Protein quantification in radiotherapy response study [45] |
Ubiquitination-Specific Applications and Case Studies
Implementation in Diffuse Large B-Cell Lymphoma
In DLBCL research, LASSO-Cox regression identified three key ubiquitination-related genes (CDC34, FZR1, and OTULIN) from seven candidates initially identified through differential expression analysis [4]. The resulting risk signature stratified patients into distinct prognostic groups, with elevated CDC34 and FZR1 expression coupled with low OTULIN expression correlating with poor outcomes. The model demonstrated significant associations with immune microenvironment composition and drug sensitivity patterns, particularly for Boehringer Ingelheim compound 2536 and Osimertinib [4]. This application highlights how LASSO-Cox can distill complex ubiquitination networks into clinically actionable signatures while revealing novel biological insights about ubiquitination's role in lymphoma pathogenesis.
Application in Lung Adenocarcinoma Prognosis
For lung adenocarcinoma, researchers applied LASSO-Cox alongside Random Survival Forests to identify four prognostic ubiquitination-related genes (DTL, UBE2S, CISH, and STC1) from differentially expressed URGs [12]. The resulting ubiquitination-related risk score (URRS) significantly stratified patient prognosis (HR = 0.54, 95% CI: 0.39-0.73, p < 0.001), with validation across six external cohorts confirming robust performance (HR = 0.58, 95% CI: 0.36-0.93, pmax = 0.023). The high URRS group exhibited higher PD1/L1 expression, tumor mutation burden, and tumor neoantigen load, suggesting immune activation pathways [12]. This case study demonstrates LASSO-Cox's utility in generating ubiquitination signatures with implications for both prognosis and immunotherapy response prediction.
Limitations and Methodological Considerations
Despite its strengths, LASSO-Cox regression presents several limitations that researchers must consider when applying it to ubiquitination signature analysis. The method can select at most one variable from a group of highly correlated predictors, potentially problematic when analyzing ubiquitination enzymes with redundant functions [46]. Sample size requirements remain substantial, with recommendations of at least 5-10 events per candidate variable, challenging for rare cancer subtypes [40]. The instability of selected variables under data perturbation may affect reproducibility, though this can be mitigated through bootstrap aggregation or stability selection techniques [46].
For ubiquitination-specific research, additional considerations include the functional interrelationships among selected genes, as LASSO-Cox provides statistical but not biological validation. Integration with experimental validation through in vitro or in vivo models remains essential to confirm biological mechanisms. Furthermore, while LASSO-Cox excels at variable selection, it may overlook complex interaction effects within ubiquitination pathways unless explicitly modeled through interaction terms [12]. Despite these limitations, when appropriately applied with biological validation, LASSO-Cox regression remains a powerful tool for ubiquitination signature research, effectively balancing statistical rigor with clinical applicability.
Ubiquitination, a crucial post-translational modification, has emerged as a significant regulator of oncogenic pathways and tumor microenvironment dynamics. The ubiquitin-proteasome system orchestrates diverse cellular processes including protein degradation, cell cycle control, DNA repair, and immune response regulation. Recent advances in genomic technologies have enabled researchers to develop ubiquitination-based prognostic signatures that effectively stratify cancer patients into distinct risk categories with significant differences in clinical outcomes, therapeutic responses, and survival patterns. These signatures reflect the complex interplay between tumor biology and the ubiquitin-proteasome system, providing powerful tools for personalized cancer management. This review comprehensively compares current methodologies for defining high-risk and low-risk patient groups based on ubiquitination profiles, examining their validation across multiple cancer types and their implications for clinical decision-making.
Comparative Analysis of Ubiquitination-Based Risk Signatures Across Cancers
Table 1: Ubiquitination-Based Prognostic Signatures Across Cancer Types
| Cancer Type | Key Ubiquitination-Related Genes in Signature | Risk Group Differences | Validation Approach | Clinical Implications |
|---|---|---|---|---|
| Diffuse Large B-Cell Lymphoma (DLBCL) | CDC34, FZR1, OTULIN | Elevated CDC34/FZR1 + low OTULIN = poor prognosis [4] | LASSO Cox regression; datasets GSE181063, GSE56315, GSE10846 [4] | Correlates with immune microenvironment; differential drug sensitivity [4] |
| Lung Adenocarcinoma (LUAD) | DTL, UBE2S, CISH, STC1 | High URRS = worse prognosis (HR=0.54, CI:0.39-0.73) [12] | 6 external validation cohorts; RT-qPCR validation [12] | Higher PD1/L1, TMB, TNB; altered chemotherapy response [12] |
| Breast Cancer (BC) | ATG5, FBXL20, DTX4, BIRC3, TRIM45, WDR78 [5] OR FBXL6, PDZRN3 (8-gene model) [47] | Significant survival differences (p<0.05) [5] [47] | Multiple external datasets; in vitro/in vivo validation [5] [47] | Predicts immune infiltration; drug sensitivity; endocrine therapy response [47] |
| Cervical Cancer (CC) | MMP1, RNF2, TFRC, SPP1, CXCL8 [48] | AUC >0.6 for 1/3/5-year survival [48] | Self-seq + TCGA-GTEx-CESC; RT-qPCR [48] | Associated with 12 immune cell types and 4 checkpoints [48] |
| Ovarian Cancer (OV) | 17-gene signature including FBXO45 [13] | High-risk = lower overall survival (P<0.05) [13] | TCGA+GTEx; GSE165808, GSE26712 [13] | FBXO45 promotes growth via Wnt/β-catenin pathway [13] |
| Pan-Cancer Analysis | URPS signature [9] | Consistent stratification across 5 solid tumor types [9] | 26 cohorts across lung, esophageal, cervical, urothelial cancer, melanoma [9] | Predicts immunotherapy response; correlates with macrophage infiltration [9] |
Methodological Framework for Signature Development
Bioinformatics Pipeline for Signature Identification
The development of ubiquitination-based risk signatures follows a structured bioinformatics pipeline that integrates multiple genomic data types and analytical approaches. The standard workflow begins with differential gene expression analysis between tumor and normal tissues, typically using R packages such as limma with thresholds of |log2FC| ≥ 1 and adjusted p-value < 0.05 [13] [47]. Ubiquitination-related genes are then identified from specialized databases such as iUUCD 2.0 (containing 966 URGs) or GeneCards [12] [48].
The core analytical phase employs survival-associated gene selection through univariate Cox regression analysis, followed by dimensionality reduction using Least Absolute Shrinkage and Selection Operator (LASSO) Cox regression or Random Survival Forests to identify the most prognostically relevant genes [4] [12] [47]. The final risk model is constructed through multivariate Cox regression, with risk scores calculated using the formula: Risk score = Σ(βi × Expi), where β represents the coefficient from multivariate Cox regression and Exp denotes gene expression level [4] [13].
Table 2: Key Bioinformatics Tools and Databases for Ubiquitination Signature Development
| Tool Category | Specific Tools/Packages | Application in Workflow |
|---|---|---|
| Differential Expression Analysis | limma, DESeq2, edgeR | Identify DEGs between tumor/normal tissues [48] [13] |
| Survival Analysis | survival, survminer | Univariate Cox regression; Kaplan-Meier curves [4] [47] |
| Feature Selection | glmnet (LASSO), randomForestSRC | Identify most prognostic genes; prevent overfitting [12] |
| Clustering | ConsensusClusterPlus | Molecular subtyping [4] [47] |
| Ubiquitination Databases | iUUCD 2.0, UUCD | Reference ubiquitination-related genes [13] [12] |
| Validation | timeROC, pROC | ROC curve analysis for predictive accuracy [48] |
Experimental Validation Approaches
Robust validation of ubiquitination signatures involves both computational and experimental approaches. External validation across multiple independent cohorts is essential, with studies typically utilizing 3-7 validation datasets from sources such as GEO and TCGA [12] [9]. For example, the lung adenocarcinoma signature was validated across six external GEO datasets, maintaining prognostic significance with a hazard ratio of 0.58 (CI: 0.36-0.93) [12].
Functional validation often includes in vitro and in vivo experiments to confirm the biological roles of identified genes. In ovarian cancer, FBXO45 was experimentally validated as a key E3 ubiquitin ligase promoting cancer growth, spread, and migration via the Wnt/β-catenin pathway [13]. Similarly, breast cancer studies validated the oncogenic effects of FBXL6 and PDZRN3 through cell culture and animal models [47].
Additional validation includes immune microenvironment analysis using tools such as CIBERSORT or ESTIMATE to examine immune cell infiltration differences between risk groups [4] [13], and drug sensitivity analysis using packages like oncoPredict to identify differential responses to therapeutics between high-risk and low-risk patients [4] [47].
Biological Mechanisms Underlying Risk Stratification
Key Signaling Pathways and Ubiquitination Networks
Ubiquitination signatures reflect their prognostic power through regulation of critical cancer-related pathways. The OTUB1-TRIM28 ubiquitination axis has been identified as a pan-cancer regulator that modulates MYC pathway activity and influences oxidative stress responses, ultimately affecting immunotherapy resistance and patient prognosis [9]. In ovarian cancer, FBXO45 drives tumor progression through the Wnt/β-catenin pathway, establishing a direct mechanistic link between ubiquitination components and established oncogenic signaling [13].
The immune microenvironment represents another key mechanism through which ubiquitination signatures influence clinical outcomes. Multiple studies have identified significant differences in immune cell infiltration between high-risk and low-risk groups, particularly in CD8+ T cells, M1 macrophages, and follicular helper T cells [13]. Additionally, ubiquitination regulates PD-1/PD-L1 protein levels in the tumor microenvironment, directly impacting immunotherapy efficacy [9].
Tumor Microenvironment and Immune Modulation
The tumor immune microenvironment represents a critical interface between ubiquitination processes and cancer progression. Comprehensive analyses reveal that ubiquitination signatures consistently correlate with specific immune profiles across cancer types. In breast cancer, ubiquitination-related signatures identified differential infiltration of memory B cells, M0 macrophages, and other immune subsets between risk groups [48]. Ovarian cancer studies demonstrated significantly higher levels of CD8+ T cells, M1 macrophages, and follicular helper T cells in low-risk groups defined by ubiquitination patterns [13].
These immune differences translate to therapeutic implications, as ubiquitination signatures can predict response to immune checkpoint inhibitors. The pan-cancer ubiquitination-related prognostic signature (URPS) effectively stratified patients responding to immunotherapy across multiple cancer types, including melanoma and urothelial carcinoma [9]. This suggests that ubiquitination processes directly modulate the immune landscape, potentially through regulation of antigen presentation, cytokine signaling, or immune checkpoint expression.
Clinical Translation and Therapeutic Applications
Predictive Biomarkers for Treatment Selection
Ubiquitination signatures show significant promise as predictive biomarkers for treatment selection across multiple cancer types. Drug sensitivity analyses have revealed substantial differences in therapeutic response between high-risk and low-risk groups. In DLBCL, significant differences in sensitivity to Boehringer Ingelheim compound 2536 and Osimertinib were observed between risk groups defined by ubiquitination signatures [4]. Breast cancer ubiquitination signatures predicted differential responses to endocrine therapies (tamoxifen, fulvestrant), chemotherapies (cyclophosphamide, cisplatin, paclitaxel, epirubicin), and targeted agents (gefitinib, lapatinib) [47].
For immunotherapy selection, ubiquitination signatures provide particular value. Lung adenocarcinoma patients with high ubiquitination-related risk scores (URRS) demonstrated significantly higher PD-1/PD-L1 expression levels, tumor mutation burden (TMB), and tumor neoantigen load (TNB) [12]. These features typically correlate with enhanced response to immune checkpoint inhibitors, suggesting ubiquitination signatures may help identify patients most likely to benefit from immunotherapy approaches.
Research Reagent Solutions for Experimental Validation
Table 3: Essential Research Reagents for Ubiquitination Signature Validation
| Reagent Category | Specific Examples | Research Application |
|---|---|---|
| Cell Line Models | A2780, HEY (ovarian cancer); MDA-MB-231, CAL51 (breast cancer); MCF10A (normal breast control) [13] [47] | Functional validation of signature genes through in vitro assays |
| Gene Modulation Tools | siRNA/shRNA (FBXL6, PDZRN3); Full-length cDNA constructs; Lipo8000 transfection reagent [47] | Gain/loss-of-function studies to establish causal relationships |
| Antibodies | Primary/secondary antibodies for Western blot; immunohistochemistry [13] | Protein expression validation; pathway analysis |
| Culture Media | DMEM, RPMI 1640; fetal bovine serum; penicillin-streptomycin [13] [47] | Cell maintenance and experimental standardization |
| Analysis Software/Packages | R packages: limma, survminer, glmnet, ConsensusClusterPlus, ESTIMATE, CIBERSORT [4] [13] [12] | Bioinformatics analysis; statistical validation |
Ubiquitination-based risk signatures represent a powerful emerging approach for cancer patient stratification with robust validation across diverse malignancies. These signatures consistently identify patient subgroups with significant differences in overall survival, therapeutic response, and tumor microenvironment characteristics. The reproducibility of these findings across multiple cancer types suggests fundamental biological principles linking ubiquitination processes to cancer progression.
Future research directions should focus on standardizing signature implementation across platforms, validating signatures in prospective clinical trials, and developing targeted therapies that specifically address the ubiquitination vulnerabilities identified in high-risk patients. As our understanding of ubiquitination biology deepens, these signatures will likely become integrated into routine clinical practice, enabling truly personalized cancer management based on the molecular intricacies of individual tumors.
The consistent demonstration that ubiquitination signatures reflect both tumor-intrinsic properties and immune microenvironment characteristics positions them as unique biomarkers capable of guiding diverse therapeutic approaches, from conventional chemotherapies to targeted agents and immunotherapies. This multifactorial predictive capacity makes ubiquitination signatures particularly valuable in the era of precision oncology.
The ubiquitin-proteasome system (UPS), a crucial mechanism for post-translational protein modification and degradation, has emerged as a pivotal regulator of oncogenesis and tumor progression. Ubiquitination involves a coordinated enzymatic cascade comprising E1 (activating), E2 (conjugating), and E3 (ligating) enzymes that specifically tag target proteins with ubiquitin, marking them for proteasomal degradation or functional modification [16] [49]. Dysregulation of this system contributes significantly to malignant transformation by altering the stability of oncoproteins and tumor suppressors. Recent advances in bioinformatics and high-throughput sequencing have enabled the development of ubiquitination-related gene (URG) signatures that demonstrate remarkable prognostic value across diverse cancer types. These molecular signatures provide powerful tools for predicting overall survival (OS) and guiding therapeutic decisions, ultimately paving the way for personalized cancer treatment strategies that target ubiquitination pathways.
Comparative Analysis of Ubiquitination-Related Prognostic Signatures Across Cancers
Table 1: Ubiquitination-Based Prognostic Signatures Across Different Cancers
| Cancer Type | Key Ubiquitination-Related Genes | Prognostic Value | Clinical Implications | Reference |
|---|---|---|---|---|
| Diffuse Large B-Cell Lymphoma (DLBCL) | CDC34, FZR1, OTULIN | Elevated CDC34/FZR1 + low OTULIN = poor prognosis | Correlates with immune microenvironment & drug sensitivity; informs targeted therapy selection | [4] |
| Cervical Cancer (CC) | MMP1, RNF2, TFRC, SPP1, CXCL8 | AUC >0.6 for 1/3/5-year survival | Stratifies patients for immunotherapy; 12 immune cell types differentially infiltrated between risk groups | [16] |
| Laryngeal Cancer (LC) | PPARG, LCK, LHX1 | Strong discrimination of OS in TCGA-LC and GSE65858 | Superior to TNM staging; guides chemotherapy vs. immunotherapy decisions | [35] |
| Lung Adenocarcinoma (LUAD) | DTL, UBE2S, CISH, STC1 | HR=0.54, 95% CI: 0.39-0.73, p<0.001 | Predicts response to chemotherapy; associated with TMB, TNB, and PD1/L1 expression | [12] |
| Breast Cancer (BC) | ATG5, FBXL20, DTX4, BIRC3, TRIM45, WDR78 | Significant survival difference (p<0.05) | Superior to traditional clinical indicators; informs microbial microenvironment targeting | [5] |
| Acute Lymphoblastic Leukemia (ALL) | FBXO8 + 8-gene signature | Identifies high-risk subtypes | FBXO8 knockdown enhances proliferation, suppresses apoptosis; reveals therapeutic vulnerability | [50] |
Table 2: Therapeutic Implications of Ubiquitination Signatures in Cancer
| Cancer Type | Immunotherapy Implications | Chemotherapy Implications | Experimental Validation | |
|---|---|---|---|---|
| Laryngeal Cancer | Low-risk: better response to immune checkpoint inhibitors | High-risk: more effective chemotherapy response | Western blot, qRT-PCR, ELISA confirmation of gene expression | [35] |
| Lung Adenocarcinoma | High URRS: Higher PD1/L1 expression, TMB, and TNB | High URRS: Lower IC50 values for various chemotherapeutic drugs | RT-qPCR validation of signature genes | [12] |
| Osteosarcoma | UBE2S correlates with immune landscape and treatment sensitivity | UBE2S overexpression linked to chemoresistance mechanisms | In vitro and in vivo validation of UBE2S role in tumorigenesis | [49] |
| Acute Lymphoblastic Leukemia | High-risk: immunosuppressive microenvironment with Treg and M2 macrophage infiltration | Drug sensitivity analysis identifies personalized therapy options | FBXO8 knockdown models show increased tumor growth and reduced survival | [50] |
Methodological Framework for Ubiquitination Signature Development
Standardized Bioinformatics Pipeline for Signature Development
The development of ubiquitination-related prognostic signatures follows a systematic bioinformatics workflow that integrates multi-omics data with clinical outcomes. The standard protocol begins with data acquisition from large-scale genomic repositories including The Cancer Genome Atlas (TCGA), Gene Expression Omnibus (GEO), and Therapeutically Applicable Research to Generate Effective Treatments (TARGET) databases [4] [12] [50]. Ubiquitination-related genes are comprehensively compiled from specialized databases such as iUUCD 2.0, UbiBrowser 2.0, and Genecards, typically yielding 900-1,400 URGs for initial analysis [35] [12] [51].
Differential expression analysis between tumor and normal tissues is performed using R packages like DESeq2 or limma with standardized thresholds (fold change > 2 or |log2FC| > 1, FDR < 0.05) [4] [51]. For prognostic modeling, univariate Cox regression analysis initially identifies survival-associated URGs, followed by dimension reduction using Least Absolute Shrinkage and Selection Operator (LASSO) Cox regression with 10-fold cross-validation to prevent overfitting [4] [35] [12]. The final signature genes are incorporated into a risk score model using the formula: Risk score = Σ(βi × Expi), where β represents the coefficient from multivariate Cox regression and Exp denotes gene expression level [4] [35]. Patients are stratified into high- and low-risk groups based on the median risk score, with prognostic performance validated through Kaplan-Meier survival analysis and time-dependent receiver operating characteristic (ROC) curves [16] [35].
Advanced Analytical Techniques for Signature Refinement
Beyond the standard pipeline, advanced bioinformatics approaches enhance signature robustness and biological relevance. Consensus clustering using the ConsensusClusterPlus R package identifies molecular subtypes based on URG expression patterns, with resampling performed 1,000 times to ensure classification stability [12] [50]. Weighted gene co-expression network analysis (WGCNA) identifies key modular genes associated with cancer phenotypes, which are intersected with differentially expressed URGs to yield candidate biomarkers [51]. For clinical translation, nomogram development integrates signature risk scores with traditional clinical parameters (TNM stage, grade, age) to generate individualized survival probability estimates at 1, 3, and 5 years [35]. The predictive accuracy of these nomograms is validated through calibration curves and decision curve analysis to demonstrate clinical utility [35].
Immune microenvironment characterization represents a critical component of signature validation. The CIBERSORT algorithm quantifies immune cell infiltration patterns, while single-sample gene set enrichment analysis (ssGSEA) scores key immune characteristics such as antigen presentation capacity, inflammatory activity, and cytotoxicity [4] [50]. Drug sensitivity analysis using the pRRophetic R package estimates half maximal inhibitory concentration (IC50) values for various chemotherapeutic agents based on gene expression profiles, enabling identification of risk group-specific therapeutic vulnerabilities [50].
The Scientist's Toolkit: Essential Research Reagents and Platforms
Table 3: Essential Research Resources for Ubiquitination Signature Development
| Resource Category | Specific Tools/Reagents | Application in Research | Key Features |
|---|---|---|---|
| Bioinformatics Databases | TCGA, GEO, TARGET | Source of transcriptomic and clinical data | Large-scale, curated cancer genomic datasets with clinical annotations |
| Ubiquitin Gene Repositories | iUUCD 2.0, UbiBrowser 2.0, Genecards | Comprehensive URG compendium | Annotated ubiquitination enzymes and associated proteins |
| Differential Expression Analysis | DESeq2, limma R packages | Identification of dysregulated URGs | Statistical rigor, multiple testing correction |
| Prognostic Modeling | survival, glmnet, survminer R packages | Signature development and validation | Implements Cox regression, LASSO, survival visualization |
| Immune Microenvironment Analysis | CIBERSORT, ESTIMATE, ssGSEA | Tumor immune contexture characterization | Deconvolutes immune cell fractions from bulk RNA-seq |
| Experimental Validation | RT-qPCR, Western Blot, IHC, RNA sequencing | Confirmatory analysis of signature genes | Translational bridge between bioinformatics and clinical application |
Molecular Mechanisms and Therapeutic Implications
Biological Pathways Underlying Ubiquitination Signatures
Ubiquitination signatures exert their prognostic influence through regulation of critical cancer-relevant pathways. In laryngeal cancer, the PPARG, LCK, and LHX1 signature genes demonstrate significant correlations with immune function, where PPARG and LHX1 show negative correlations, while LCK exhibits positive correlation with an immune-promoting microenvironment [35]. In lung adenocarcinoma, ubiquitination-related risk signatures are enriched in mitotic cell cycle processes, with UBE2S specifically promoting mitosis by facilitating K11-linked ubiquitin polyubiquitin chains on APC/C substrates, ultimately regulating proteasome-mediated degradation [12] [49]. For osteosarcoma, UBE2S overexpression activates multiple tumorigenesis pathways including MAPK signaling, Myc targets, and DNA repair systems, creating a permissive environment for cancer proliferation and metastasis [49].
The immune-modulatory functions of ubiquitination signatures represent a particularly promising therapeutic avenue. In acute lymphoblastic leukemia, FBXO8 functions as a significant protective factor, with its knockdown resulting in enhanced cell proliferation, suppressed apoptosis, and an immunosuppressive microenvironment characterized by increased regulatory T cells and M2 macrophage infiltration [50]. Similarly, in cervical cancer, ubiquitination-based signatures identify patients with distinct immune cell infiltration patterns, including memory B cells and M0 macrophages, as well as differential expression of immune checkpoints that may guide immunotherapy selection [16].
Translation to Clinical Practice and Therapeutic Decision-Making
The clinical utility of ubiquitination signatures extends beyond prognostic stratification to active guidance of therapeutic strategies. In laryngeal cancer, the PPARG/LCK/LHX1 signature identifies patients who would derive greater benefit from immune checkpoint inhibitors versus conventional chemotherapy, with low-risk patients showing more activated immune function, higher infiltration of anti-cancer immune cells, and stronger expression of immune-promoting cytokines [35]. Similarly, in lung adenocarcinoma, the DTL/UBE2S/CISH/STC1 signature not only predicts survival but also informs chemotherapy selection, with high-risk patients showing significantly lower IC50 values for various chemotherapeutic agents [12].
The integration of ubiquitination signatures with emerging immunotherapy approaches represents a particularly promising frontier. Across multiple cancer types, including cervical cancer and acute lymphoblastic leukemia, ubiquitination-based risk scores correlate with expression of established immune checkpoints (PD-1, CTLA-4, LAG-3), providing a mechanistic basis for their association with immunotherapy response [16] [50]. Furthermore, the ability of these signatures to capture tumor mutation burden and neoantigen load in lung adenocarcinoma creates opportunities for identifying patients most likely to respond to immunotherapeutic interventions [12].
Ubiquitination-related gene signatures represent a transformative approach to cancer prognosis and treatment selection, offering molecular granularity beyond conventional clinicopathological parameters. The consistent demonstration of prognostic utility across diverse malignancies—from hematological cancers like ALL to solid tumors including lung adenocarcinoma, breast cancer, and laryngeal carcinoma—underscores the fundamental role of ubiquitination processes in oncogenesis. Current evidence supports the clinical potential of these signatures for identifying high-risk patients who may benefit from more aggressive or targeted therapeutic interventions, while simultaneously sparing low-risk patients from unnecessary treatment toxicity.
Future research directions should prioritize standardization of analytical approaches, validation in prospective clinical trials, and integration with existing biomarkers to maximize clinical utility. Additionally, the development of targeted therapies against specific signature components—such as FBXO8 in ALL or UBE2S in osteosarcoma—represents a promising therapeutic strategy that merits further investigation. As our understanding of ubiquitination networks in cancer deepens, these molecular signatures are poised to become indispensable tools for precision oncology, ultimately improving survival outcomes through biologically-informed treatment decisions.
Refining Ubiquitination Signatures: Addressing Heterogeneity and Complexity
Tumor heterogeneity represents a fundamental challenge in modern oncology, complicating prognosis prediction and therapeutic decision-making. This biological diversity manifests at genomic, transcriptomic, and proteomic levels, creating substantial obstacles for developing reliable cancer classifications. Molecular subtyping aims to categorize cancers into distinct groups based on their molecular profiles to guide personalized treatment strategies. However, traditional clustering methods applied to single-omics data often yield unstable and non-reproducible results due to this heterogeneity, highlighting the critical need for more robust computational approaches [52].
Consensus clustering has emerged as a powerful computational strategy to overcome these limitations. By integrating multiple clustering results into a stable consensus, this methodology enhances the reliability of molecular classifications. When applied within the context of ubiquitination signatures—a critical post-translational modification process increasingly recognized for its prognostic value in cancer—consensus clustering provides a robust framework for identifying clinically relevant subtypes [4] [12]. This guide objectively compares prominent consensus clustering approaches, their performance against alternatives, and their application in ubiquitination-based cancer subtyping.
Methodological Comparison of Consensus Clustering Approaches
Core Algorithmic Frameworks
Table 1: Comparison of Consensus Clustering Strategies
| Method | Integration Strategy | Key Features | Typical Applications | Technical Requirements |
|---|---|---|---|---|
| ClustOmics | Object co-occurrence-based (Evidence Accumulation) | Graphs database; Multi-method; Multi-omics fusion | Exploratory analysis; Cancer subtyping | Neo4j platform; Computational resource-intensive |
| COCA (Consensus Clustering) | Co-occurrence matrix-based | Concatenates input clusterings; Late integration | Pan-cancer analysis; Multi-omics integration | R environment; Moderate computational resources |
| MOVICS Pipeline | Ensemble learning (10 algorithms) | Bayesian latent variable model; Unified pipeline | Multi-omics cancer typing; Prognostic subtyping | R package; High-performance computing for multiple algorithms |
| iClusterBayes | Statistical modeling (Bayesian) | Probabilistic integration; Handles multiple data types | Molecular subtyping; Dimension reduction | R package; Statistical expertise for parameter tuning |
Performance Metrics and Experimental Validation
Table 2: Experimental Performance Data Across Cancer Types
| Cancer Type | Method | Clusters Identified | Survival Separation (p-value) | Biological Validation | Stability Metrics |
|---|---|---|---|---|---|
| Non-Small Cell Lung Cancer (NSCLC) | Consensus Clustering [52] | 4 subgroups | DFS: (2.39\times 10^{-8}) | Distinct mutational profiles; Pathway enrichment | High cross-dataset reproducibility |
| Diffuse Large B-Cell Lymphoma (DLBCL) | LASSO COX [4] | 3 ubiquitination genes | Significant (p<0.05) | Immune microenvironment correlation | Validated in GSE181063 dataset |
| Gastric Cancer | MOVICS [53] | 3 subtypes (CS1-CS3) | Significant (p<0.05) | TME composition; Drug response | Robust across clinical cohorts |
| Colorectal Cancer | Deconvolution + CMS [54] | 4 CMS classes | Not specified | Spatial distribution; Histological alignment | High technical replicate correlation (>0.9) |
| Ovarian Cancer | UBQ Risk Model [13] | 2 risk groups | p<0.05 | Immune infiltration; Drug sensitivity | Validated in GSE165808 and GSE26712 |
Experimental Protocols for Consensus Clustering Implementation
Multi-Omics Data Integration Protocol
The following workflow details the standard protocol for implementing consensus clustering in molecular subtyping studies:
Phase 1: Data Preprocessing and Normalization
- Collect multi-omics data (transcriptomics, methylation, mutation) from public repositories (TCGA, GEO) or institutional cohorts
- Perform batch effect correction using ComBat or similar algorithms [53]
- Normalize gene expression data using log2(TPM+1) transformation [53]
- Filter methylation probes: remove non-CpG probes, SNP-related probes, and sex chromosomes [53]
- Apply quality control thresholds: for single-cell data, exclude cells with <200 or >6000 genes [4]
Phase 2: Input Clustering Generation
- Apply multiple clustering algorithms (K-means, hierarchical clustering, iClusterPlus, SNF) to normalized data
- For single-omics integration: cluster each omics type separately using multiple methods
- For multi-omics integration: apply integrative methods (PINS, SNF, NEMO, rMKL) to combined datasets
- Determine optimal cluster numbers for each method using gap statistics or consensus cumulative distribution function [52]
Phase 3: Consensus Integration
- For co-occurrence-based approaches (ClustOmics): compute pairwise sample co-occurrence across all input clusterings
- Construct similarity matrix based on co-occurrence frequencies
- Apply final clustering algorithm (hierarchical, spectral) to similarity matrix
- For ensemble approaches (MOVICS): implement voting mechanism across algorithmic predictions
- Validate cluster stability through bootstrap resampling or subset analysis
Ubiquitination-Specific Signature Development
For studies focusing on ubiquitination signatures, the following specialized protocol applies:
- Ubiquitination Gene Compilation: Curate ubiquitination-related genes (URGs) from specialized databases (iUUCD 2.0, UUCD) including E1 ubiquitin-activating enzymes, E2 ubiquitin-conjugating enzymes, and E3 ubiquitin ligases [12]
- Differential Expression Analysis: Identify URGs differentially expressed between tumor and normal tissues using limma or edgeR packages (criteria: |logFC| ≥ 1, FDR < 0.05) [4] [13]
- Prognostic Filtering: Perform univariate Cox regression to identify survival-associated URGs (p < 0.05) [4]
- Feature Selection: Apply LASSO Cox regression with 10-fold cross-validation to identify most prognostic URGs [4] [12]
- Risk Model Construction: Calculate risk scores using formula: Risk score = Σ(Coefi × Expi) where Coef represents regression coefficient and Exp denotes gene expression level [13]
- Validation: Assess model performance in independent validation cohorts using time-dependent ROC curves and Kaplan-Meier analysis
Figure 1: Consensus Clustering Workflow for Molecular Subtyping
Signaling Pathways in Ubiquitination-Based Subtyping
Ubiquitination-related molecular subtyping reveals distinct biological pathways activated across different cancer types. In Diffuse Large B-Cell Lymphoma, ubiquitination signatures correlate with endocytosis-related mechanisms and T-cell signaling, with significant differences observed in immune scores between risk groups [4]. The key ubiquitination-related genes identified (CDC34, FZR1, and OTULIN) regulate protein degradation processes that influence tumor proliferation and treatment response.
In lung adenocarcinoma, ubiquitination risk scores demonstrate strong associations with immune checkpoint expression (PD1/PD-L1), tumor mutation burden, and tumor neoantigen load [12]. The ubiquitin-proteasome system influences critical cancer pathways including EGFR, Wnt/β-catenin, NF-κB, and AKT signaling, explaining its prognostic value across diverse malignancies.
Figure 2: Ubiquitination Signaling in Cancer Subtyping
The Scientist's Toolkit: Essential Research Reagents and Platforms
Table 3: Essential Research Reagents and Computational Tools
| Category | Specific Tool/Reagent | Application Purpose | Key Features | Experimental Validation |
|---|---|---|---|---|
| Computational Packages | ConsensusClusterPlus R package | Determining cluster number and stability | Reps=1000; pItem=0.8; clusterAlg="km" | Used in TCGA-LUAD cohort with 1000 repetitions [12] |
| Data Sources | TCGA (The Cancer Genome Atlas) | Multi-omics reference data | Comprehensive clinical and molecular data | Integrated with institutional cohorts in multiple studies [53] [52] |
| Ubiquitination Databases | iUUCD 2.0 / UUCD | Ubiquitination-related gene curation | 929 UBQ genes categorized into E1, E2, E3 | Used to identify prognostic URGs in LUAD and OV [13] [12] |
| Immunoanalysis Tools | CIBERSORT | Immune cell infiltration quantification | Support vector regression deconvolution | Applied to RNA-Seq data for 22 immune cell types [4] [53] |
| Drug Sensitivity | oncoPredict R package | Chemotherapy response prediction | Calculates IC50 values for 198 drugs | Identified differential sensitivity to Osimertinib in DLBCL [4] |
| Experimental Validation | Western Blot, qRT-PCR | Protein and mRNA expression confirmation | Antibody specificity; STR analysis | Validated FBXO45 expression in ovarian cancer [13] |
Comparative Performance in Clinical Application
Prognostic Stratification Accuracy
Consensus clustering demonstrates superior performance in prognostic stratification compared to traditional histology-based classification. In non-small cell lung cancer, consensus clustering identified four molecular subgroups with significantly distinct disease-free survival (log-rank p-value = (2.39\times 10^{-8})), while histological subtyping alone failed to capture these prognostic differences [52]. The hazard ratios between identified subgroups showed significant variation (HR = 3.05, p = 0.039), enabling refined risk stratification.
In gastric cancer, the MOVICS pipeline integrating ten clustering algorithms identified three subtypes (CS1-CS3) with distinct survival outcomes, immune microenvironment composition, and chemotherapy responses [53]. Similarly, ubiquitination-based signatures in lung adenocarcinoma effectively stratified patients into high-risk and low-risk groups with significant survival differences (HR = 0.54, 95% CI: 0.39-0.73, p < 0.001) across multiple validation cohorts [12].
Technical Performance Metrics
Table 4: Technical Performance Comparison Across Methods
| Method | Stability Score | Computational Time | Scalability | Ease of Implementation | Interpretability |
|---|---|---|---|---|---|
| ClustOmics | High (graph-based consensus) | High | Moderate (database-dependent) | Moderate (Neo4j requirement) | High (visualization native) |
| MOVICS | High (10-algorithm ensemble) | Very High | Good | Moderate (R package) | High (comprehensive output) |
| COCA | Moderate | Moderate | Excellent | Easy (standard R implementation) | Moderate |
| iClusterBayes | Moderate-High | High | Moderate | Difficult (parameter tuning) | Moderate |
Consensus clustering represents a paradigm shift in molecular subtyping, effectively addressing tumor heterogeneity through computational integration of multiple data types and algorithmic approaches. The methodology demonstrates consistent performance across cancer types, providing biologically meaningful and clinically relevant classifications. When applied to ubiquitination signatures, consensus clustering reveals novel prognostic subgroups with distinct therapeutic vulnerabilities, offering opportunities for targeted intervention.
Future developments will likely focus on integrating spatial transcriptomics data to address spatial heterogeneity [54], incorporating single-cell resolution for refined subtyping [4], and developing dynamic clustering approaches that can adapt to tumor evolution. As ubiquitination-targeted therapies like PROTACs advance, robust molecular subtyping will become increasingly essential for precision oncology implementation [13].
In predictive oncology, the ultimate test of a model's value lies not in its performance on its training data, but in its ability to generalize to new, independent patient populations. The challenge of generalizability is particularly acute in cancer research, where biological heterogeneity, diverse patient demographics, and variations in clinical practice can dramatically affect model performance. For high-stakes applications such as prognostic stratification using ubiquitination-related gene signatures, ensuring robust generalizability is both a statistical necessity and an ethical imperative. This guide objectively compares the predominant strategies—cross-validation and multi-dataset training—for optimizing model generalizability, providing researchers with evidence-based methodological recommendations.
The limited generalizability of oncology models stems from multiple factors. Randomized controlled trials (RCTs) often exhibit significant survival outcome differences compared to real-world populations, with one analysis noting a median reduction of 6 months in median overall survival in real-world settings [55]. This generalizability gap persists in molecular prognostic models, driving the need for rigorous validation methodologies that can withstand the complexities of translational application.
Comparative Analysis of Validation Methodologies
Table 1: Comparison of Cross-Validation and Multi-Dataset Training Approaches
| Validation Feature | Cross-Validation | Multi-Dataset Training |
|---|---|---|
| Primary Strength | Maximizes data utility from single cohorts | Directly tests population heterogeneity robustness |
| Data Requirements | Single dataset | Multiple independent datasets with comparable variables |
| Implementation Examples | 10-iterated fivefold CV [56], k-fold CV, repeated CV | Training on TCGA with validation on GEO datasets [13] [57] [12] |
| Performance Metrics | C-index, IBS, mean AUC [58], time-dependent AUC [55] | Hazard ratios, Kaplan-Meier survival differences, ROC AUC across timepoints [5] [13] |
| Risk of Overfitting | Moderate (mitigated through repetition) | Lower when validated on truly independent data |
| Limitations | May not detect dataset-specific biases | Challenges with batch effects and data harmonization |
Cross-Validation: Protocols and Implementation
Core Methodological Framework
Cross-validation (CV) represents a family of techniques that systematically partition available data to estimate model performance on unseen observations. The fundamental principle involves repeatedly splitting data into training and validation sets, building models on the training fractions, and evaluating them on the validation fractions. This process provides a more robust performance estimate than a single train-test split, especially valuable when limited samples are available.
In standard k-fold cross-validation, the dataset is randomly partitioned into k equally sized folds. The model is trained k times, each time using k-1 folds for training and the remaining fold for validation. The performance estimates across all k iterations are then averaged to produce a final performance estimate. Common variants include stratified k-fold (preserving class distribution in each fold) and repeated k-fold (performing multiple rounds of k-fold with different random partitions).
Advanced Iterated Cross-Validation in DLBCL Research
A sophisticated implementation of cross-validation was demonstrated in a DLBCL study that employed a 10-iterated fivefold CV with shuffling to predict 3-year progression-free and overall survival [56]. This approach substantially exceeds standard cross-validation by incorporating both multiple data splits and repetition with randomization.
Experimental Protocol:
- Dataset: 122 patients with pathologically confirmed DLBCL receiving rituximab-containing chemotherapy
- Predictors: Clinical parameters (International Prognostic Index), laboratory values, and metabolic imaging parameters from FDG PET/CT scans
- Models Evaluated: Logistic regression, random forest, support vector classifier (SVC), deep neural network (DNN), and fuzzy neural network
- Validation Framework:
- Data shuffled and divided into five folds
- Model trained on 4 folds, validated on held-out fold
- Process repeated 10 times with different random shuffling
- Performance metrics averaged across all 50 iterations (10 repetitions × 5 folds)
- Performance Outcomes: DNN and SVC achieved superior accuracy (71% for PFS, 76% for OS), demonstrating how iterated cross-validation can reliably identify optimal modeling approaches even with limited sample sizes [56]
Cross-Validation in Machine Learning-Based Survival Prediction
The value of cross-validation extends to complex machine learning pipelines for survival prediction. In gastric cancer research, multiple models including Cox, Random Survival Forests (RSF), CoxBoost, and DeepSurv_Cox were evaluated using five-fold cross-validation on training cohorts from the SEER database [58]. This approach enabled robust model selection before external validation on Chinese multicenter datasets, with the integrated model achieving a C-index of 0.719 for cancer-specific survival, outperforming traditional TNM staging [58].
Multi-Dataset Training: Protocols and Implementation
Strategic Framework for Multi-Dataset Validation
Multi-dataset training and validation represents a more stringent approach to assessing generalizability by testing models on completely independent cohorts, often from different institutions, platforms, or populations. This method directly addresses concerns about models learning dataset-specific artifacts rather than biologically meaningful patterns.
The most effective implementations follow a structured framework: (1) identification of complementary datasets with relevant clinical annotations; (2) careful data harmonization and batch effect correction; (3) model development on a primary dataset; and (4) rigorous validation on multiple external datasets with quantification of performance consistency.
Ubiquitination-Related Gene Signatures Across Cancers
Multiple studies have successfully employed multi-dataset validation for ubiquitination-related prognostic models across cancer types:
Breast Cancer Protocol [5]:
- Training Dataset: GSE20685
- Validation Datasets: TCGA-BRAC, GSE1456, GSE16446, GSE20711, GSE58812, and GSE96058
- Gene Signature: 6 ubiquitination-related genes (ATG5, FBXL20, DTX4, BIRC3, TRIM45, and WDR78)
- Validation Results: Consistent prognostic performance across all external datasets with significant survival differences between risk groups (p < 0.05) and superior predictive ability compared to traditional clinical indicators
Ovarian Cancer Protocol [13]:
- Training Dataset: TCGA-OV (376 tumor samples)
- Normal Control: GTEx database (88 normal ovarian tissue samples)
- Validation Datasets: GSE165808 and GSE26712
- Model Characteristics: 17-gene ubiquitination signature with high prognostic accuracy (1-year AUC = 0.703, 3-year AUC = 0.704, 5-year AUC = 0.705)
- Experimental Validation: Functional validation of key E3 ubiquitin ligase FBXO45 demonstrating promotion of ovarian cancer growth, spread, and migration via the Wnt/β-catenin pathway
Lung Adenocarcinoma Protocol [12]:
- Training Dataset: TCGA-LUAD cohort
- Validation Datasets: 7 independent GEO datasets (GSE30219, GSE37745, GSE41271, GSE42127, GSE68465, GSE72094) plus IMvigor210 cohort of patients treated with anti-PD-L1 agents
- Gene Signature: 4-gene ubiquitination-related risk score (URRS) based on DTL, UBE2S, CISH, and STC1
- Validation Results: Consistent prognostic performance across all validation cohorts (Hazard Ratio = 0.58, 95% CI: 0.36-0.93) with additional correlations to tumor mutation burden, neoantigen load, and immunotherapy response
The TrialTranslator Framework for Real-World Generalizability Assessment
A sophisticated machine learning framework called TrialTranslator was developed to systematically evaluate the generalizability of RCT results across different prognostic phenotypes identified through machine learning [55]. This approach represents an advanced form of multi-dataset validation that specifically addresses the translation of clinical trial findings to real-world populations.
Methodological Workflow [55]:
- Prognostic Model Development: Cancer-specific gradient boosting machines (GBM) were trained to predict mortality from time of metastatic diagnosis using EHR data from Flatiron Health
- Trial Emulation: Landmark phase 3 RCTs were emulated by identifying real-world patients who met key eligibility criteria and received the treatments of interest
- Prognostic Phenotyping: Patients were stratified into low-risk, medium-risk, and high-risk phenotypes using mortality risk scores from the GBM models
- Survival Analysis: Treatment effects were assessed within each phenotype using inverse probability of treatment weighted (IPTW)-adjusted Kaplan-Meier survival curves
- Generalizability Assessment: Results across phenotypes were compared to original RCT findings to identify heterogeneity in treatment benefits
Key Findings: The analysis revealed that patients in low-risk and medium-risk phenotypes exhibited survival times and treatment benefits similar to RCTs, while high-risk phenotypes showed significantly lower survival times and diminished treatment benefits [55]. This demonstrates how multi-dataset approaches can uncover critical limitations in model generalizability across patient subgroups.
Integrated Workflow for Optimal Generalizability
The most robust approach combines both cross-validation and multi-dataset validation in a sequential framework. The diagram below illustrates this integrated methodology for developing generalizable ubiquitination-signature models in cancer research:
Diagram: Integrated workflow for model generalizability combining cross-validation within datasets and validation across multiple independent cohorts
Table 2: Key Research Reagent Solutions for Ubiquitination-Signature Research
| Resource Category | Specific Tools & Databases | Primary Research Function |
|---|---|---|
| Gene Expression Databases | TCGA [59] [13] [12], GEO [5] [57] [12], TARGET [57] | Provide large-scale, clinically annotated transcriptomic data for model training and validation |
| Ubiquitin Gene Curations | iUUCD 2.0 [57] [12], UUCD [13] | Authoritative repositories of ubiquitination-related genes (E1, E2, E3 enzymes) for feature selection |
| Statistical Computing | R packages: survival [5] [57], glmnet [5] [59] [12], randomForestSRC [12], ConsensusClusterPlus [4] [12] |
Implement advanced machine learning algorithms, survival analysis, and validation frameworks |
| Immunogenomic Analysis | CIBERSORT [4] [57], ESTIMATE [13] [57] | Quantify immune cell infiltration and tumor microenvironment characteristics |
| Drug Sensitivity Prediction | R package pRRophetic [57], oncoPredict [4] |
Connect prognostic signatures to therapeutic implications and treatment response |
| Clinical Data Integration | SEER database [58], Flatiron Health EHR [55] | Provide real-world clinical outcomes data for generalizability assessment |
The comparative analysis of cross-validation and multi-dataset training reveals complementary strengths that should be strategically leveraged in prognostic model development:
Employ iterated cross-validation during initial model development to maximize information extraction from limited samples and robustly select among algorithmic approaches, as demonstrated in the DLBCL study [56].
Prioritize multi-dataset validation with independent cohorts as the gold standard for assessing real-world generalizability, following exemplars from ubiquitination-signature research across multiple cancer types [5] [13] [12].
Implement prognostic phenotyping frameworks like TrialTranslator [55] to identify patient subgroups that may experience differential model performance, moving beyond one-size-fits-all validation.
Adopt standardized performance metrics (C-index, time-dependent AUC, IBS) across studies to enable meaningful comparison of generalizability across different modeling approaches [58] [55].
Publicly share model coefficients and implementation code to facilitate independent validation and accelerate clinical translation of promising ubiquitination-based prognostic signatures.
The rapid evolution of machine learning in oncology demands equally sophisticated validation methodologies. By implementing these rigorous, multi-faceted approaches to model generalizability, researchers can develop ubiquitination-based prognostic tools that maintain predictive performance across diverse patient populations and ultimately deliver on the promise of precision oncology.
The ubiquitin-proteasome system represents a crucial regulatory mechanism in cellular homeostasis, with ubiquitin-related genes (URGs) playing pivotal roles in cancer initiation, progression, and treatment response. Recent advances in multi-omics integration have enabled researchers to correlate URG expression patterns with established cancer biomarkers, particularly tumor mutational burden (TMB) and immune contexture, to develop more accurate prognostic models. This comparative analysis examines methodologies and findings from recent studies that integrate ubiquitination signatures with mutational and immune profiling data across multiple cancer types, providing researchers with a framework for evaluating the prognostic value of URGs in relation to these critical cancer biomarkers.
Comparative Analysis of URG Signatures Across Cancer Types
Methodological Approaches for URG Signature Development
Table 1: Methodological Approaches in URG Signature Studies Across Cancers
| Cancer Type | Data Sources | URG Selection Method | Statistical Modeling | Validation Approach |
|---|---|---|---|---|
| Laryngeal Cancer [35] | TCGA-LC (n=116), GSE65858 (n=46) | Differential expression + Uni-Cox | LASSO + Multi-Cox regression | External dataset + Experimental validation |
| Colon Cancer [60] | TCGA-COAD (n=424), GSE39582 (n=573) | NMF clustering + SVM-RFE | LASSO + Stepwise regression | External cohort + qRT-PCR + IHC |
| Clear Cell Renal Cell Carcinoma [61] | TCGA-KIRC, E-MTAB-1980 | Consensus clustering | LASSO + Cox regression | External dataset + RT-qPCR |
| Breast Cancer [62] | TCGA-BRCA (n=700), GSE158309 (n=460) | Consensus clustering + PAM | Lasso-Cox risk regression | External cohort + in vitro/in vivo experiments |
URG Signatures and Their Prognostic Value
Table 2: Composition and Performance of URG Signatures Across Cancer Types
| Cancer Type | Signature Genes | Risk Group Separation | Clinical Validation | Immune Correlation |
|---|---|---|---|---|
| Laryngeal Cancer [35] | PPARG, LCK, LHX1 | Significant (p<0.05) | Nomogram developed | Strong immune function differences |
| Colon Cancer [60] | ARHGAP4, MID2, SIAH2, TRIM45, UBE2D2, WDR72 | Significant (p<0.05) | Early diagnostic value | Distinct immune escape patterns |
| ccRCC [61] | PDK4, PLAUR, UCN, RNASE2, KISS1, MXD3 | Significant (p<0.05) | Nomogram developed | Immune checkpoint differences |
| Breast Cancer [62] | 8-gene signature (incl. FBXL6, PDZRN3) | Significant (p<0.05) | Experimental validation | Immune infiltration variations |
Correlation Between URG Signatures and Tumor Mutational Burden
TMB as an Independent Prognostic Biomarker
Tumor mutational burden has emerged as a significant biomarker for immunotherapy response across multiple cancer types. Multiple meta-analyses have demonstrated that high TMB correlates with improved overall survival (OS) and progression-free survival (PFS) in patients treated with immune checkpoint inhibitors (ICIs). A comprehensive meta-analysis of 32 studies with 6,131 participants revealed significantly increased OS (HR: 0.61, 95% CI: 0.53–0.71; P<0.01) and PFS (HR: 0.51, 95% CI: 0.44–0.60; P<0.01) for high TMB groups receiving ICIs compared to low TMB groups [63]. These findings were further supported by another meta-analysis of 41 studies with 7,713 participants, which demonstrated that high TMB yielded better objective response rate (RR=2.73) and durable clinical benefit (RR=1.93) in patients receiving immunotherapy [64].
Integrated Analysis of URG Signatures and TMB
The relationship between URG signatures and TMB has been systematically explored in several cancer types. In clear cell renal cell carcinoma, researchers conducted a correlation analysis to explore the relationship between URGs score and TMB, utilizing somatic mutation data from TCGA database [61]. Similarly, in breast cancer, investigators divided patients into low-TMB and high-TMB groups according to quartile TMB scores and identified differentially expressed genes between these groups, revealing that the low-TMB group had a more favorable survival outcome [65]. These analyses demonstrate that URG signatures often align with TMB status in predicting patient outcomes, with both biomarkers providing complementary prognostic information.
URG Signatures and Immune Microenvironment Interactions
Immune Landscape Associated with URG Risk Groups
Table 3: Immune Characteristics of URG-Based Risk Groups Across Cancers
| Cancer Type | High-Risk Group Immune Phenotype | Low-Risk Group Immune Phenotype | Immunotherapy Response Prediction |
|---|---|---|---|
| Laryngeal Cancer [35] | Immunosuppressive microenvironment | Activated immune function, higher infiltration of anti-cancer immune cells | ICIs more effective in low-risk group |
| Colon Cancer [60] | Enhanced EMT, immune escape, immunosuppressive MDSCs, Treg infiltration | Favorable immune microenvironment | Better response to CTLA4 inhibitors in low-risk group |
| ccRCC [61] | Distinct immune checkpoint expression | Different immune cell infiltration patterns | Immunotherapy more effective in low-risk group |
| Breast Cancer [62] | Immunosuppressive features | Higher immune infiltration | Differential response to various therapies |
Experimental Validation of URG-Immune System Interactions
The mechanistic relationship between URGs and immune regulation has been experimentally validated in multiple studies. In laryngeal cancer, PPARG knockdown significantly reduced the expression of immunosuppressive cytokines IL6, TGFB1, TGFB2, and VEGFC as confirmed by qRT-PCR and ELISA [35]. Similarly, in colon cancer, ARHGAP4 and SIAH2 demonstrated promising early diagnostic capabilities, while WDR72 knockdown significantly inhibited CRC cell proliferation both in vitro and in vivo [60]. For breast cancer, functional experiments validated the effects of FBXL6 and PDZRN3 on breast cancer development, confirming their roles in cancer progression and potential as therapeutic targets [62].
Multi-Omics Data Integration Methodologies
Computational Approaches for Data Integration
The integration of multi-omics data requires specialized computational methods that can handle the challenges of combining diverse data types with different dynamic ranges and noise levels. Multi-omics integration is broadly categorized into vertical integration (N-integration), which incorporates different omics from the same samples, and horizontal integration (P-integration), which combines studies of the same molecular level from different subjects [66]. Additionally, integration approaches are classified as early integration (concatenating measurements before analysis), late integration (combining multiple predictive models), and an intermediate approach that transforms omics through separate analysis before modeling [66].
Machine learning approaches have become increasingly important for multi-omics data integration in cancer research. These methods can be categorized as either general-purpose or task-specific, covering both supervised and unsupervised learning for integrative analysis [67]. Regularization techniques such as LASSO (Least Absolute Shrinkage and Selection Operator), elastic net, and other variable selection methods are commonly used to manage the complexity of multi-omics data by selecting the most informative variables while discarding less relevant ones [66].
Analytical Workflows in URG Signature Studies
Figure 1: Multi-Omics Integration Workflow for URG Signature Development
The analytical workflows employed in URG signature studies typically follow a structured pattern, as illustrated in Figure 1. Studies typically begin with data collection from public repositories such as TCGA and GEO, followed by URG identification from specialized databases like iUUCD 2.0 [60] [62]. Molecular subtyping is then performed using methods such as non-negative matrix factorization (NMF) or consensus clustering [60] [61]. Signature development employs machine learning techniques like LASSO regression and SVM-RFE to identify optimal gene combinations [60]. The resulting signatures enable risk stratification, which is subsequently correlated with immune profiles and TMB status. Finally, therapeutic predictions are generated and validated through experimental approaches.
Table 4: Essential Research Resources for URG-TMB-Immune Context Studies
| Resource Category | Specific Tools/Databases | Application in Research | Key Features |
|---|---|---|---|
| Data Resources | TCGA (The Cancer Genome Atlas) | Source of multi-omics data across cancer types | Standardized multi-omics data [66] |
| GEO (Gene Expression Omnibus) | Independent validation datasets | Array and sequencing data [35] | |
| URG Databases | iUUCD 2.0 | Comprehensive URG collection | 1,360 URGs with functional annotations [60] |
| UbiBrowser 2.0 | Ubiquitination network resource | Interaction predictions [35] | |
| Analytical Tools | CIBERSORT | Immune cell infiltration estimation | Deconvolution algorithm [60] [65] |
| ESTIMATE Algorithm | Tumor microenvironment scoring | Stromal and immune scores [60] | |
| maftools | TMB analysis and visualization | Mutation burden calculation [65] | |
| Experimental Validation | qRT-PCR | Gene expression confirmation | Quantitative measurement [60] |
| Western Blot | Protein level verification | Protein expression analysis [62] | |
| IHC | Tissue localization | Spatial expression patterns [60] |
The integration of URG signatures with mutational burden and immune context represents a powerful approach for advancing cancer prognosis and treatment selection. Comparative analysis across multiple cancer types reveals consistent patterns where URG signatures effectively stratify patients into distinct risk categories with characteristic immune profiles and differential predicted responses to immunotherapy. The correlation between URG signatures and TMB provides complementary prognostic information, potentially offering a more comprehensive basis for treatment decisions than either biomarker alone. As multi-omics integration methodologies continue to evolve, ubiquitination-related signatures show significant promise for improving personalized cancer therapy by simultaneously capturing information about tumor biology, mutational landscape, and immune microenvironment. Future research directions should focus on standardizing URG signature development, validating findings across diverse patient populations, and further elucidating the mechanistic connections between ubiquitination pathways and cancer immunity.
Navigating the Complexity of Ubiquitin Chain Topology and Its Functional Impact
Ubiquitination is a fundamental post-translational modification that operates as a sophisticated signaling language within eukaryotic cells, directing a vast array of cellular processes including protein degradation, DNA repair, inflammatory signaling, and cell cycle progression [68] [69]. This complex language is written through the covalent attachment of the small 76-amino acid protein ubiquitin to substrate proteins, a process catalyzed by a sequential enzymatic cascade involving E1 (activating), E2 (conjugating), and E3 (ligating) enzymes [68]. The remarkable functional diversity of ubiquitin signaling stems not merely from the modification itself, but from the vast topological landscape of ubiquitin polymers, or chains, that can be assembled. Ubiquitin chains can vary in their length, linkage types, and overall architecture, creating a complex "ubiquitin code" that is decoded by specialized receptor proteins to direct specific cellular outcomes [70]. Disruption of this code is increasingly implicated in human diseases, particularly cancer, where altered ubiquitin signaling drives tumorigenesis, metastasis, and therapeutic resistance [4] [71] [12]. This guide systematically compares the functional specializations of major ubiquitin chain topologies, details experimental methodologies for their study, and evaluates their emerging prognostic and therapeutic value in cancer research.
Ubiquitin Chain Topologies: A Comparative Functional Analysis
The structural diversity of ubiquitin chains arises from the ability of ubiquitin itself to serve as a substrate for further ubiquitination. Each ubiquitin molecule contains eight potential acceptor sites: seven internal lysine residues (K6, K11, K27, K29, K33, K48, K63) and the N-terminal methionine (M1) [68] [69]. The specific connectivity between ubiquitin monomers determines the chain's three-dimensional structure and consequently its functional specificity.
Table 1: Comparative Analysis of Major Ubiquitin Chain Topologies
| Chain Topology | Primary Structure & Linkage | Key Functions | Regulating Enzymes (Examples) | Reader Proteins / Domains |
|---|---|---|---|---|
| K48-linked | Homotypic, isopeptide bond | Proteasomal degradation [68] | CDC34, UBE2K [68] | Proteasome receptors |
| K63-linked | Homotypic, isopeptide bond | DNA repair, kinase activation, endocytosis, NF-κB signaling [68] [69] | Ubc13/Mms2, TRAF6 [68] [70] | TAB2/3, RAP80 [69] |
| K11-linked | Homotypic, isopeptide bond | Proteasomal degradation (cell cycle regulation) [68] | UBE2S, APC/C [68] [70] | Proteasome receptors |
| Linear (M1-linked) | Homotypic, peptide bond | NF-κB activation, inflammation [72] [69] | LUBAC (HOIP/HOIL-1L/SHARPIN) [72] | NEMO (UBAN), A20 [72] |
| Branched | Heterotypic, multiple linkage points | Enhanced proteasomal targeting, signaling regulation [68] [70] | UBR5, HUWE1, APC/C+UBE2S [70] | Specific proteasome receptors |
| K48/K63 Branched | Heterotypic, branched | Apoptosis regulation, NF-κB signaling [70] [69] | TRAF6+HUWE1, ITCH+UBR5 [70] | Specific proteasome receptors |
The functional consequences of ubiquitination extend beyond the well-established role of K48-linked chains in targeting proteins for proteasomal degradation. K63-linked and linear (M1-linked) chains typically serve as scaffolding platforms that facilitate the assembly of signaling complexes rather than triggering degradation [69]. For instance, in the TNF signaling pathway, K63-linked and linear ubiquitin chains assembled by c-IAP1/2 and LUBAC, respectively, create a docking platform that recruits and activates the TAK1 and IKK kinase complexes, ultimately leading to NF-κB activation [69]. Linear ubiquitination, uniquely catalyzed by the LUBAC complex, is particularly critical for inflammatory signaling and the prevention of TNF-mediated cell death [72] [69].
Branched ubiquitin chains represent a particularly complex topological class that expands the coding potential of the ubiquitin system. These chains contain at least one ubiquitin monomer modified at two different acceptor sites, creating branch points that can significantly alter the chain's physical properties and receptor interactions [70]. For example, the anaphase-promoting complex (APC/C) collaborates with E2 enzymes UBE2C and UBE2S to generate branched K11/K48 chains on mitotic substrates, which enhances their recognition and degradation by the proteasome compared to homogeneous K11 or K48 chains [68] [70]. The synthesis of branched chains often involves collaboration between pairs of E3 ligases with distinct linkage specificities, such as Ufd4 and Ufd2 in yeast, which cooperate to synthesize branched K29/K48 chains on substrates of the ubiquitin fusion degradation pathway [70].
Table 2: Branched Ubiquitin Chain Architectures and Their Synthesis Mechanisms
| Branched Chain Type | Documented Functions | Synthesis Mechanism | Biological Context |
|---|---|---|---|
| K11/K48 | Enhanced proteasomal degradation [68] [70] | APC/C with UBE2C & UBE2S; UBR5 on pre-formed K11 chains [70] | Cell cycle regulation [70] |
| K48/K63 | NF-κB signaling, apoptosis regulation [70] | TRAF6 (K63) + HUWE1 (K48); ITCH (K63) + UBR5 (K48) [70] | Inflammatory signaling, stress response [70] [69] |
| K29/K48 | Ubiquitin fusion degradation pathway [70] | Ufd4 (K29) + Ufd2 (K48) collaboration [70] | Protein quality control [70] |
| K6/K48, K6/K11, K27/K29 | Potential regulatory functions; precise roles emerging [70] | Individual E3s (e.g., Parkin, NleL) or E3 pairs [70] | Parkinson's disease, bacterial infection [70] |
Methodological Approaches for Ubiquitin Chain Analysis
Deciphering the ubiquitin code requires sophisticated analytical techniques capable of distinguishing between structurally similar chain topologies. Traditional methods have relied on linkage-specific antibodies or the reiterative use of selective deubiquitinases (DUBs), but these approaches have limitations in sensitivity, specificity, and the ability to characterize complex or atypical chain architectures [73].
Mass Spectrometry-Based Structural Analysis
Advanced mass spectrometry (MS) techniques, particularly tandem MS (MS/MS), have emerged as powerful tools for comprehensive ubiquitin chain characterization. The protocol outlined by [73] enables universal application to all linkage types through top-down analysis of intact ubiquitin chains, preserving connectivity information that is lost in bottom-up peptide-based approaches.
Protocol: Top-Down Tandem MS for Ubiquitin Chain Characterization [73]
Sample Preparation: Enrich ubiquitinated proteins or unanchored chains via immunoprecipitation. Purity is evaluated by SDS-PAGE, with syntheses yielding 0.3-1 mg of protein considered sufficient. Lyophilize samples and reconstitute in water:acetonitrile (97.5:2.5) with 0.1% formic acid to a final concentration of 30 μg/mL.
Liquid Chromatography:
- Utilize ultra-high-performance liquid chromatography (e.g., Thermo Fisher Ultimate 3000).
- Employ a monolithic trap column (e.g., PepSwift RP-4H, 100μm x 5 mm) for desalting and concentration at 5 μL/min flow rate.
- Perform separation on a monolithic analytical column (e.g., ProSwift RP-4H, 200μm x 25 cm) at 1.5 μL/min flow rate and 35°C column temperature.
- Apply a linear gradient from 5% to 55% mobile phase B over 20 minutes (mobile phase A: 97.5% water, 2.5% acetonitrile, 0.1% formic acid; mobile phase B: 25% water, 75% acetonitrile, 0.1% formic acid).
Tandem Mass Spectrometry:
- Use high-resolution instrumentation (e.g., Orbitrap Fusion Lumos tribrid mass spectrometer).
- Set mass resolution to 120,000 at 200 m/z for both precursor and fragment ions.
- Employ combined fragmentation techniques such as ETciD (electron transfer dissociation combined with collision-induced dissociation) or EThcD (ETD combined with higher-energy CID).
- Optimize ion routing multipole pressure to 0.01-0.03 mTorr for maximum fragment ion density.
This top-down strategy preserves the intact ubiquitin chain for analysis, enabling direct observation of linkage patterns through supervised interpretation of fragmentation spectra. The method is compatible with any ubiquitin linkage type and can be extended to ubiquitin-like proteins such as Nedd8 and SUMO [73].
The following diagram illustrates the key experimental workflow and the enzymatic cascade responsible for building the ubiquitin code:
Functional Validation in Biological Systems
Beyond structural characterization, understanding ubiquitin chain function requires contextual validation in biological systems. RNA interference or CRISPR-Cas9-mediated knockout of specific E2 or E3 enzymes can establish their roles in generating specific chain topologies [70]. For example, studies of branched K11/K48 chain formation utilized siRNA-mediated depletion of UBE2S to demonstrate its essential role in branching activity [70]. Similarly, the functional consequences of specific chain types can be probed through expression of ubiquitin mutants (e.g., lysine-to-arginine mutants) that prevent the formation of particular linkages, or through the use of linkage-specific DUBs to selectively disassemble chains of interest [70].
Ubiquitin Signatures in Cancer Prognosis and Therapeutics
The deregulation of ubiquitin signaling is increasingly recognized as a hallmark of cancer, with specific ubiquitin chain topologies and their regulatory enzymes serving as prognostic biomarkers and therapeutic targets.
Prognostic Ubiquitination Signatures Across Cancers
Multi-gene ubiquitination signatures have demonstrated significant prognostic value across diverse malignancies, enabling improved patient stratification and treatment selection.
Table 3: Ubiquitination-Related Prognostic Signatures in Cancer
| Cancer Type | Ubiquitination Signature Components | Prognostic Value | Clinical Implications |
|---|---|---|---|
| Diffuse Large B-Cell Lymphoma (DLBCL) | CDC34 (↑), FZR1 (↑), OTULIN (↓) [4] | High CDC34/FZR1 with low OTULIN predicts poor survival [4] | Potential for risk-adapted therapy; correlates with T-cell infiltration and drug sensitivity [4] |
| Osteosarcoma | UBE2L3, CORO6, DCAF8, DNAI1, FBXL5, UHRF2, WDR53 [71] | High-risk signature associated with worse overall survival (AUC 0.919 at 5 years) [71] | Independent prognostic factor; informs on immune microenvironment and chemotherapy response [71] |
| Lung Adenocarcinoma (LUAD) | DTL (↑), UBE2S (↑), CISH (↓), STC1 (↑) [12] | High URRS (risk score) predicts poor prognosis (HR=0.54, 95% CI: 0.39-0.73) [12] | Associates with higher TMB, PD-1/PD-L1 expression, and altered chemotherapy response [12] |
The prognostic power of these ubiquitination signatures often stems from their association with critical cancer hallmarks. For example, in lung adenocarcinoma, the ubiquitination-related risk score (URRS) not only predicts survival but also correlates with tumor mutation burden (TMB), PD-L1 expression, and response to immunotherapy, suggesting utility in guiding treatment selection beyond pure prognosis [12]. Similarly, in DLBCL, the ubiquitination signature comprising CDC34, FZR1, and OTULIN correlates with both endocytosis-related mechanisms and T-cell infiltration, linking ubiquitin signaling to tumor microenvironment composition [4].
Targeting Ubiquitination in Cancer Therapy
Several therapeutic strategies have been developed to exploit the ubiquitin system in cancer, including proteasome inhibitors, E1/E2/E3 inhibitors, and deubiquitinase (DUB) inhibitors. The differential expression of ubiquitination-related genes between normal and tumor tissues, as validated by RT-qPCR in osteosarcoma [71], provides a therapeutic window for such interventions. Furthermore, drug sensitivity analyses reveal that ubiquitination signatures can predict response to conventional chemotherapy, with high-risk LUAD patients showing lower IC50 values for various chemotherapeutic agents [12], and high-risk osteosarcoma patients demonstrating differential sensitivity to the proteasome inhibitor MG-132 [71].
The following diagram illustrates how ubiquitination signatures influence cancer progression and therapeutic response:
The Scientist's Toolkit: Essential Research Reagents
Table 4: Essential Research Reagents for Ubiquitin Chain Analysis
| Reagent / Tool | Primary Function | Application Examples | Technical Notes |
|---|---|---|---|
| Linkage-Specific Antibodies | Immunoprecipitation or detection of specific ubiquitin linkages [73] | Western blot analysis, immunofluorescence | Validation with linkage-specific standards essential due to potential cross-reactivity [73] |
| DUB Panels (OTULIN, CYLD, etc.) | Selective cleavage of specific ubiquitin linkages for functional or analytical purposes [72] [73] | Chain topology mapping, functional validation | OTULIN exclusively cleaves linear chains; CYLD hydrolyzes K63 and linear chains [72] |
| Recombinant E2/E3 Enzymes | In vitro reconstitution of specific ubiquitination reactions [68] [70] | Mechanism studies, chain synthesis | Essential for establishing minimal requirements for specific chain topologies [70] |
| Ubiquitin Mutants (K-to-R, M1-A) | Prevention of specific linkage formation in cellular systems [70] | Functional studies of specific chain types | Expression in ubiquitin-free cell lines provides cleanest system [70] |
| Tandem Mass Spectrometry | Comprehensive structural analysis of ubiquitin chains [73] | Topology determination, novel linkage discovery | Top-down approach preserves connectivity information [73] |
| siRNA/shRNA Libraries | Knockdown of specific ubiquitin system components [70] | Functional validation in cellular models | CRISPR-Cas9 knockout provides alternative for complete ablation [70] |
The complex topology of ubiquitin chains represents a sophisticated coding system that fundamentally governs cellular signaling and protein fate. The specialized functions of different chain types—from the degradative signals of K48-linked and branched K11/K48 chains to the scaffolding functions of K63-linked and linear chains—enable precise control over virtually all cellular processes. Methodological advances, particularly in mass spectrometry, are progressively unveiling this complexity, revealing an expanding repertoire of chain architectures with distinct biological functions. In cancer, the deregulation of specific ubiquitin chain topologies and their regulatory enzymes contributes to malignant progression, while simultaneously creating molecular vulnerabilities that can be exploited therapeutically. The development of ubiquitination-based prognostic signatures across diverse cancers highlights the clinical relevance of decoding the ubiquitin code and promises to enable more precise patient stratification and treatment selection. As our understanding of ubiquitin chain topology continues to evolve, so too will opportunities for therapeutic intervention in cancer and other diseases driven by ubiquitin signaling dysfunction.
In the evolving landscape of cancer prognosis, the limitations of traditional clinical markers have prompted the exploration of molecular signatures that can offer greater precision. Traditional markers such as tumor stage, grade, and histological type provide foundational prognostic information but often fail to capture the underlying biological heterogeneity of tumors, leading to inconsistent treatment outcomes. Ubiquitination-related gene (URG) signatures represent an emerging class of molecular biomarkers that leverage insights into post-translational modification processes critical to cancer progression. This guide provides an objective comparison between these innovative URG signatures and conventional clinical markers, evaluating their respective performances in predicting cancer prognosis through structured experimental data and analytical methodologies.
Understanding the Marker Paradigms: Traditional Clinical vs. URG Signatures
Traditional clinical markers in oncology have historically included factors such as TNM (Tumor, Node, Metastasis) staging, histological grade, tumor size, and lymph node status. These markers are primarily anatomical and histological in nature, providing essential but often superficial characterization of cancer progression. While invaluable for initial risk stratification, they frequently lack the resolution to predict individual patient outcomes accurately or response to specific therapies, particularly in cancers with significant molecular heterogeneity [74].
Ubiquitination-related gene (URG) signatures represent a molecular approach to cancer prognosis. Ubiquitination is a post-translational modification process that regulates protein degradation, localization, and activity, playing crucial roles in various cellular processes including DNA repair, cell cycle progression, and immune response. Dysregulation of ubiquitination pathways has been implicated in tumorigenesis, progression, and metastasis across multiple cancer types [24] [18]. URG signatures typically comprise multiple genes involved in ubiquitination processes, identified through high-throughput genomic analyses and validated for their collective prognostic value.
The fundamental distinction between these paradigms lies in their approach to cancer characterization: traditional markers describe what the cancer looks like and where it is located, while URG signatures reveal how the cancer functions at a molecular level, potentially offering deeper insights into its biological behavior and therapeutic vulnerabilities.
Experimental Protocols for URG Signature Development and Validation
The development and validation of URG signatures follow rigorous computational and experimental protocols that ensure their reliability and clinical relevance.
Signature Identification and Construction
The standard methodology begins with the acquisition of gene expression data from large-scale cohorts such as The Cancer Genome Atlas (TCGA) and Gene Expression Omnibus (GEO) databases. Researchers extract ubiquitination-related genes from specialized databases like the Integrated Annotations for Ubiquitin and Ubiquitin-like Conjugation Database (iUUCD), which typically includes over 1,300 URGs [18] [60].
Differentially expressed URGs between tumor and normal tissues are identified using threshold criteria such as |log2 fold change| > 1 and adjusted p-value < 0.05. Prognostic URGs are then selected through univariate Cox proportional hazards regression analysis. The most promising candidates undergo further refinement using machine learning techniques, particularly Least Absolute Shrinkage and Selection Operator (LASSO) Cox regression analysis, to prevent overfitting and identify the most predictive gene combinations [24] [75].
A multi-gene signature is constructed through multivariate Cox proportional hazards regression, integrating the expression profiles of selected URGs with their corresponding regression coefficients. The resulting risk score calculation follows the formula: Risk score = (β1 × Gene1 Expression) + (β2 × Gene2 Expression) + ... + (βn × Genen Expression), where β represents the coefficient derived from multivariate Cox regression [24].
Validation and Clinical Application
The prognostic signature undergoes rigorous validation in independent patient cohorts to verify its robustness. Patients are stratified into high-risk and low-risk groups based on the median risk score or optimal cutoff value determined through receiver operating characteristic (ROC) analysis. Kaplan-Meier survival analysis and log-rank tests compare overall survival (OS) and disease-free survival (DFS) between risk groups [24] [18].
The independent prognostic value of the URG signature is assessed through univariate and multivariate Cox regression analyses that incorporate traditional clinical parameters. To enhance clinical utility, researchers often develop nomograms that integrate the URG signature with key clinical variables such as age and TNM stage, providing a quantitative tool for predicting individual patient outcomes [76] [18].
Functional validation through in vitro and in vivo experiments typically follows bioinformatic analyses. This includes knocking down key signature genes using siRNA or CRISPR-Cas9 technology and evaluating effects on cancer cell proliferation, migration, invasion, and tumor growth in animal models [18] [77].
Performance Comparison: Quantitative Data Analysis
The following tables summarize comprehensive performance metrics comparing URG signatures against traditional clinical markers across multiple cancer types, based on published validation studies.
Table 1: Performance Metrics of URG Signatures Across Cancer Types
| Cancer Type | URG Signature | AUC for Survival Prediction | Hazard Ratio (High vs. Low Risk) | Statistical Significance (p-value) | Independent Prognostic Value |
|---|---|---|---|---|---|
| Breast Cancer [24] | 4-URG (CDC20, PCGF2, UBE2S, SOCS2) | 5-year AUC: 0.72-0.78 | 2.8 (95% CI: 1.9-4.1) | <0.001 | Yes (p<0.05) |
| Colon Cancer [18] | 6-URG (ARHGAP4, MID2, SIAH2, TRIM45, UBE2D2, WDR72) | 3-year AUC: 0.71 | 2.1 (95% CI: 1.5-2.9) | <0.001 | Yes (p<0.05) |
| Gastric Cancer [77] | 5-URG (OTULIN, UBE2C, USP1, USP2, MAPT) | 3-year AUC: 0.69 | 1.9 (95% CI: 1.3-2.7) | 0.001 | Yes (p<0.05) |
| Esophageal Cancer [76] | 11-URG/DRG signature | 2-year AUC: 0.75 | 2.5 (95% CI: 1.7-3.6) | <0.001 | Yes (p<0.05) |
Table 2: Comparison with Traditional Clinical Markers
| Prognostic Marker | Predictive Accuracy Range (AUC) | Limitations | Advantages |
|---|---|---|---|
| TNM Staging [18] | 0.60-0.68 | Limited resolution for intra-stage heterogeneity | Standardized, universally available |
| Tumor Grade [75] | 0.55-0.65 | Subjective interpretation variability | Low cost, routinely assessed |
| URG Signatures [24] [18] | 0.69-0.78 | Requires molecular profiling infrastructure | Captures biological heterogeneity, molecular functionality |
| Common Serum Markers (CEA, CA19-9) [74] | 0.58-0.66 | Limited sensitivity and specificity | Minimally invasive, serial monitoring possible |
The quantitative data demonstrate that URG signatures consistently outperform traditional clinical markers in predicting survival outcomes across multiple cancer types, with higher area under curve (AUC) values and statistically significant hazard ratios. Importantly, multivariate analyses have confirmed that URG signatures provide prognostic information independent of traditional markers, suggesting they capture distinct biological aspects of tumor behavior.
Biological Mechanisms and Functional Insights
The superior performance of URG signatures stems from their ability to capture critical biological processes that drive cancer progression. Ubiquitination regulates key cellular mechanisms including:
- Cell Cycle Progression: Genes like CDC20 and UBE2C play crucial roles in cell cycle regulation, with dysregulation leading to uncontrolled proliferation [24].
- DNA Repair Mechanisms: Multiple URGs are involved in DNA damage response pathways, with deficiencies contributing to genomic instability [24].
- Epithelial-Mesenchymal Transition (EMT): Ubiquitination regulators such as SIAH2 influence EMT, a critical process in cancer metastasis [18].
- Immune Response Modulation: URGs shape the tumor immune microenvironment by regulating immune cell infiltration and function [76] [18].
- Therapeutic Resistance: Several signature genes mediate response to chemotherapy and targeted therapies through protein stability regulation [77].
Experimental validations have consistently supported these mechanistic insights. For example, knockdown of WDR72 in colorectal cancer significantly inhibited cell proliferation both in vitro and in vivo, while OTULIN suppression impaired gastric cancer cell viability and metastatic capability [18] [77]. These functional studies confirm the biological relevance of URG signature genes in cancer pathogenesis.
Methodological Workflow and Technical Considerations
The following diagram illustrates the standard workflow for developing and validating URG prognostic signatures:
Research Reagent Solutions for URG Signature Implementation
Table 3: Essential Research Reagents and Platforms for URG Signature Studies
| Research Tool | Function | Examples/Specifications |
|---|---|---|
| Gene Expression Databases | Source of genomic data for discovery | TCGA, GEO (GSE42568, GSE39582) [24] [18] |
| URG Reference Databases | Comprehensive URG compendium | iUUCD 2.0 (1,360 URGs) [18] [60] |
| Bioinformatics Packages | Statistical analysis and modeling | R packages: limma, glmnet, survival, survminer [24] [76] |
| Experimental Validation Tools | Functional characterization | siRNA/shRNA, CRISPR-Cas9, qRT-PCR primers [18] [77] |
| Patient-Derived Models | Preclinical validation | Patient-derived organoids, xenografts (PDX) [78] |
Clinical Translation and Clinical Trial Considerations
The integration of molecular signatures like URGs into clinical practice requires careful consideration of trial design and regulatory pathways. Innovative clinical trial designs including basket, umbrella, and platform trials under master protocol frameworks have emerged as efficient approaches for validating biomarker-guided therapies [79].
Basket trials evaluate a single targeted therapy across multiple cancer types sharing a common molecular alteration, making them suitable for assessing URG-directed therapies. Umbrella trials investigate multiple targeted therapies for a single cancer type stratified by different molecular alterations, enabling parallel evaluation of URG-based patient stratification. Platform trials employ adaptive designs that allow for continuous evaluation of multiple interventions, with the flexibility to add or remove treatment arms based on accumulating evidence [79].
For regulatory approval, clinical biomarkers must undergo rigorous analytical validation, clinical validation, and demonstration of clinical utility. The transition from preclinical biomarker discovery to clinical application requires extensive validation using patient-derived models that closely mimic human disease conditions, such as patient-derived organoids and xenografts [78].
The comprehensive performance data presented in this guide demonstrate that URG signatures consistently surpass traditional clinical markers in prognostic accuracy across multiple cancer types. Their ability to capture the underlying biological heterogeneity of tumors and provide insights into key cancer-driving pathways represents a significant advancement in cancer prognosis.
While traditional clinical markers remain essential for initial patient assessment, URG signatures offer complementary molecular information that enables more refined risk stratification and personalized treatment approaches. The integration of both paradigms through nomograms and other composite models appears to offer the most powerful prognostic tool, leveraging the established value of traditional markers while incorporating the molecular insights provided by URG signatures.
Future developments in this field will likely focus on standardizing analytical approaches, validating signatures in prospective clinical trials, and expanding their application to therapeutic decision-making. As our understanding of ubiquitination biology deepens and computational methods advance, URG signatures are poised to become increasingly integral to precision oncology, potentially guiding the development of novel ubiquitination-targeted therapies and improving patient outcomes through more personalized cancer care.
Pan-Cancer Validation and Comparative Analysis of Ubiquitination Signatures
The development of molecular signatures, particularly those based on ubiquitination-related genes (URGs), has emerged as a promising approach for cancer prognosis prediction. However, the transition from a statistically significant model in a training cohort to a clinically applicable tool requires rigorous testing in independent patient populations. External validation serves as the definitive assessment of a model's robustness, generalizability, and potential clinical utility by evaluating its performance on datasets completely separate from those used during development [80] [81]. This process is especially crucial in cancer research, where biological heterogeneity, technical variability across institutions, and diverse patient demographics can significantly impact model performance. Without independent validation, prognostic signatures risk being overfitted to specific populations and may fail to provide reliable guidance for clinical decision-making or drug development programs [82].
The ubiquitin-proteasome system represents a particularly valuable source of prognostic biomarkers due to its fundamental role in regulating cellular processes critical to oncogenesis, including cell cycle progression, DNA repair, and apoptosis. As research in this area expands, establishing standardized validation frameworks for URG-based signatures becomes increasingly important for translating these molecular discoveries into clinically actionable tools [83] [12].
Quantitative Comparison of Externally Validated Ubiquitination-Related Prognostic Models
Table 1: Comprehensive Overview of Externally Validated Ubiquitination-Related Prognostic Models Across Cancers
| Cancer Type | Key Ubiquitination-Related Genes in Signature | Training Cohort | External Validation Cohort(s) | Performance Metrics (Validation) | Clinical Implications |
|---|---|---|---|---|---|
| Lung Adenocarcinoma [12] | DTL, UBE2S, CISH, STC1 | TCGA-LUAD (n=490) | 6 GEO datasets (Combined HR=0.58, 95% CI: 0.36-0.93, pmax=0.023) | Hazard Ratio confirmed significance across all cohorts | Higher risk score associated with increased TMB, TNB, and PD-1/PD-L1 expression |
| Diffuse Large B-Cell Lymphoma [4] | CDC34, FZR1, OTULIN | GSE10846 | GSE181063 (Significant differential expression confirmed) | Elevated CDC34/FZR1 + low OTULIN = poor prognosis | Correlation with endocytosis mechanisms, T-cell infiltration, and drug sensitivity |
| Ovarian Cancer [13] | 17-gene signature including FBXO45 | TCGA-OV + GTEx (n=464) | GSE165808, GSE26712 (n=202 combined) | 1-year AUC=0.703, 3-year AUC=0.704, 5-year AUC=0.705 | Low-risk group showed higher CD8+ T cells, M1 macrophages, and follicular helper cells |
| Breast Cancer [5] | ATG5, FBXL20, DTX4, BIRC3, TRIM45, WDR78 | GSE20685 | TCGA-BRAC + 5 GEO datasets (GSE1456, GSE16446, GSE20711, GSE58812, GSE96058) | Significant survival differences (p<0.05) across all validations | Superior predictive ability compared to traditional clinical indicators |
| Osteosarcoma [71] | UBE2L3, CORO6, DCAF8, DNAI1, FBXL5, UHRF2, WDR53 | TARGET database | GSE21257, GSE39055 | 1-year AUC=0.957, 3-year AUC=0.890, 5-year AUC=0.919 | Risk score and prognosis stage were independent prognostic factors |
| Papillary Renal Cell Carcinoma [84] | UBE2C, DDB2, CBLC, BIRC3, PRKN, UBE2O, SIAH1, SKP2, UBC, CDC20 | TCGA-PRCC (n=539) | Internal validation with strong discrimination | C-index >0.75 considered strong predictive power | High-risk group associated with advanced tumor status and poor survival |
Table 2: Methodological Standards in Model Validation Practices
| Validation Component | Current Implementation in URG Models | Optimal Standards | Clinical Impact |
|---|---|---|---|
| Dataset Independence | Complete separation of training and validation cohorts [12] [71] | No patient overlap between development and validation sets | Reduces overoptimism in performance estimates |
| Population Diversity | Mostly retrospective, multi-institutional data [82] | Prospective collection across diverse demographics and healthcare settings | Assesses generalizability across real-world populations |
| Performance Metrics | AUC, Hazard Ratios, Calibration plots [12] [81] | Discrimination, calibration, and clinical utility measures | Provides comprehensive assessment of predictive accuracy |
| Validation Scope | Typically 1-3 external datasets [12] [5] | Multiple validations across different geographical regions | Confirms robustness across technical and biological variations |
| Clinical Utility Assessment | Limited implementation in current URG models [82] | Decision curve analysis and impact on clinical decision-making | Determines practical value beyond statistical significance |
Experimental Protocols for Ubiquitination Signature Development and Validation
Standardized Workflow for Prognostic Model Development and Validation
The construction and validation of ubiquitination-related prognostic signatures follows a systematic bioinformatics pipeline that integrates molecular data with clinical outcomes. The standardized protocol encompasses multiple phases from data acquisition to clinical application, with external validation serving as the critical bridge between model development and real-world implementation [83] [12] [84].
Key Algorithmic Approaches for Robust Signature Development
The development of ubiquitination-related prognostic signatures employs multiple statistical and machine learning approaches to identify optimal gene combinations and minimize overfitting:
Least Absolute Shrinkage and Selection Operator (LASSO) Regression: This method performs both variable selection and regularization to enhance prediction accuracy and interpretability. In the context of URG signature development, LASSO Cox regression identifies the most prognostically relevant ubiquitination-related genes while reducing the number of parameters in the final model [83] [12]. The algorithm works by applying a penalty term (λ) to the regression coefficients, effectively shrinking less important coefficients to zero and retaining only the most predictive genes. The optimal λ value is typically determined through 10-fold cross-validation to maximize model performance while maintaining parsimony [4].
Random Survival Forests: This ensemble learning method constructs multiple decision trees during training and outputs the average prediction of individual trees. For survival data, it effectively handles high-dimensional covariates and captures complex nonlinear relationships between ubiquitination genes and patient outcomes [12]. The variable importance metric generated by random survival forests helps prioritize genes with the strongest prognostic power, complementing the selection performed by LASSO regression.
Multivariate Cox Proportional Hazards Model: After gene selection, the final risk score is typically constructed using a multivariate Cox model. The risk score for each patient is calculated using the formula: Risk score = Σ(βi × Expi), where βi represents the regression coefficient from multivariate Cox regression analysis for each gene, and Expi represents the expression level of that gene [12] [13]. Patients are then stratified into high-risk and low-risk groups based on the median risk score or optimal cutpoint determined by survival analysis.
Visualization of Ubiquitination-Related Immune Microenvironment Interactions
Tumor Microenvironment Modulation Through Ubiquitination Pathways
Ubiquitination-related prognostic signatures demonstrate strong associations with tumor immune microenvironment composition, providing mechanistic insights into their predictive value. External validation studies consistently reveal distinct immune landscapes between high-risk and low-risk patient groups across multiple cancer types [12] [13] [84].
Validation Framework for Ubiquitination-Related Prognostic Models
The external validation process follows a systematic framework to assess model transportability across diverse clinical settings and patient populations. This multi-dimensional evaluation examines statistical performance, clinical utility, and practical implementation requirements [80] [81] [82].
Table 3: Essential Research Resources for Ubiquitination Signature Development and Validation
| Resource Category | Specific Tools & Databases | Primary Function | Key Features & Applications |
|---|---|---|---|
| Ubiquitin Gene Databases | iUUCD 2.0 (Integrated Ubiquitin & Ubiquitin-like Conjugation Database) [83] [12] | Comprehensive repository of ubiquitination-related genes | Curated collection of E1 (27), E2 (109), and E3 (1153) enzymes; Essential for defining initial gene sets |
| Transcriptomic Data Repositories | TCGA (The Cancer Genome Atlas), GEO (Gene Expression Omnibus) [4] [12] | Source of cancer gene expression data | Multi-center, multi-platform molecular and clinical data; Enables model training and validation across diverse populations |
| Statistical Analysis Platforms | R/Bioconductor with glmnet, survival, timeROC packages [83] [12] [71] | Implementation of statistical algorithms for model development | LASSO Cox regression, survival analysis, time-dependent ROC curves; Standardized methodologies for reproducible research |
| Immune Microenvironment Tools | CIBERSORT, ESTIMATE, xCell [71] [13] [84] | Deconvolution of immune cell populations from bulk RNA-seq data | Quantifies tumor-infiltrating immune cells; Links ubiquitination signatures to immune response patterns |
| Drug Sensitivity Databases | CellMiner, GDSC, CTRP [83] [4] [71] | Correlation of gene signatures with therapeutic response | IC50 values for chemotherapeutic and targeted agents; Identifies potential treatment vulnerabilities |
| Experimental Validation Tools | Human Protein Atlas, CCLE, DepMap [84] | Protein-level confirmation and functional validation | Immunohistochemical validation of gene expression; Connects computational findings with biological mechanisms |
| Clinical Data Integration | cBioPortal, UCSC Xena Browser [83] [12] | Integration of molecular data with clinical outcomes | Survival analysis, correlation with staging and grading; Establishes clinical relevance of molecular signatures |
Discussion and Future Directions
The external validation of ubiquitination-related gene signatures represents a critical milestone in translating molecular discoveries into clinically applicable tools. Across multiple cancer types, independently validated URG models demonstrate robust prognostic performance while providing insights into tumor biology and potential therapeutic vulnerabilities [12] [13] [84]. The consistent association between ubiquitination signatures and immune microenvironment composition further strengthens their biological plausibility and suggests potential applications in immunotherapy response prediction.
However, several challenges remain in the widespread clinical implementation of these signatures. Current validation efforts primarily utilize retrospective datasets, which may not fully capture real-world clinical heterogeneity [80] [81]. Additionally, there is considerable variability in the reporting of validation metrics, with many studies emphasizing discrimination (AUC) while providing limited information on calibration or clinical utility [82]. Future validation studies should prioritize prospective designs, standardized reporting frameworks, and direct comparison against established clinical prognostic factors to firmly establish the added value of ubiquitination-based signatures.
For drug development professionals, ubiquitination-related prognostic models offer dual utility: both as stratification tools for clinical trial enrollment and as biomarkers for identifying patients most likely to respond to ubiquitin-proteasome system-targeted therapies. The external validation framework presented herein provides a methodological foundation for developing robust, clinically implementable signatures that can ultimately support personalized treatment decisions and accelerate oncology drug development.
Within the broader thesis on the prognostic value of ubiquitination signatures in cancer patients, this guide systematically compares the performance of ubiquitination-related gene (URG) signatures across four major cancers: lung, ovarian, breast, and esophageal malignancies. The ubiquitin-proteasome system represents a critical post-translational modification pathway that regulates protein degradation, cell signaling, DNA repair, and immune response across diverse cancer types [9] [12]. Recent advances in bioinformatics have enabled the construction of URG-based prognostic models that effectively stratify patient risk groups and predict therapeutic responses. This comparative analysis examines the experimental methodologies, prognostic performance, and clinical utility of these signatures to inform research directions and drug development strategies in oncology.
Ubiquitination Signatures Across Cancers: A Comparative Analysis
Performance Metrics of Ubiquitination-Based Signatures
Table 1: Comparative performance of ubiquitination-related prognostic signatures across cancer types
| Cancer Type | Key Genes in Signature | HR (High vs. Low Risk) | AUC (1/3/5-year) | Validation Cohorts | Clinical Utility |
|---|---|---|---|---|---|
| Lung Adenocarcinoma | DTL, UBE2S, CISH, STC1 [12] | 0.54 (95% CI: 0.39-0.73) [12] | Not specified | 6 external GEO datasets [12] | Predicts immunotherapy response, chemosensitivity [12] |
| Ovarian Cancer | FBXO9, UBD [22] | Significant (p<0.05) [22] | Not specified | GSE32062 [22] | Associates with DNA damage repair, immunocyte infiltration [22] |
| Breast Cancer | ATG5, FBXL20, DTX4, BIRC3, TRIM45, WDR78 [5] | Significant (p<0.05) [5] | Not specified | TCGA-BRAC, 5 GEO datasets [5] | Stratifies tumor microbiology, immune microenvironment [5] |
| Esophageal Squamous Cell Carcinoma | BUB1B, CHEK1, DNMT1, IRAK1, PRKDC [85] | Significant (p<0.05) [85] | Not specified | GSE20347, in-house dataset [85] | Potential therapeutic targets, cell cycle regulation [85] |
| Diffuse Large B-Cell Lymphoma | CDC34, FZR1, OTULIN [4] | Significant (p<0.05) [4] | Not specified | GSE181063 [4] | Correlates with immune microenvironment, drug sensitivity [4] |
Methodological Comparison of Signature Development
Table 2: Experimental protocols and methodologies for ubiquitination signature development
| Methodological Component | Lung Adenocarcinoma [12] | Ovarian Cancer [22] | Breast Cancer [5] | Esophageal Squamous Cell Carcinoma [85] |
|---|---|---|---|---|
| Primary Data Sources | TCGA-LUAD, GEO datasets [12] | TCGA-OV, GTEx [22] | GSE20685, TCGA-BRAC [5] | TCGA-ESCC, GSE20347 [85] |
| Gene Selection Method | Univariate Cox, Random Survival Forest, LASSO [12] | Univariate Cox, LASSO [22] | Univariate Cox, NMF algorithm [5] | Differential expression, Kaplan-Meier analysis [85] |
| Validation Approach | 6 external GEO datasets [12] | GSE32062, IHC, qPCR, Western blot [22] | Multiple external datasets, single-cell analysis [5] | GSE20347, in-house dataset, RT-qPCR [85] |
| Functional Analysis | Immune infiltration, TMB, TNB, PD1/L1 expression [12] | Immune infiltration, drug sensitivity, DNA damage repair [22] | Immune microenvironment, tumor microbiology [5] | GO, KEGG, PPI networks, drug-gene interactions [85] |
| Experimental Validation | RT-qPCR [12] | IHC, qPCR, Western blot, functional assays [22] | Not specified | RT-qPCR [85] |
Common Analytical Framework for Ubiquitination Signatures
The development of ubiquitination-related prognostic signatures follows a consistent bioinformatics workflow across cancer types, with variations in specific algorithms and validation approaches.
Key Ubiquitination-Related Biological Processes
The ubiquitination signatures identified across cancer types converge on several fundamental biological processes that drive cancer progression:
Cell Cycle Regulation: Multiple signatures include genes that control cell cycle checkpoints and progression. In ESCC, BUB1B and CHEK1 play critical roles in cell cycle control and DNA damage response [85]. In DLBCL, FZR1 is a key regulator of the cell cycle [4].
Immune Microenvironment Modulation: Ubiquitination signatures consistently correlate with immune cell infiltration patterns. In ovarian cancer, the URG signature associates with immunocyte infiltration [22], while in breast cancer, the signature stratifies patients based on immune microenvironment characteristics [5].
DNA Damage Response: Several signatures include genes involved in DNA repair mechanisms. In ovarian cancer, FBXO9 associates with DNA damage repair pathways [22], while in ESCC, PRKDC plays a key role in DNA repair [85].
Therapeutic Response Prediction: URG signatures show utility in predicting response to various cancer treatments. In lung adenocarcinoma, the signature predicts immunotherapy response and chemosensitivity [12], while in DLBCL, the signature correlates with sensitivity to specific compounds [4].
Table 3: Key research reagents and databases for ubiquitination signature development
| Resource | Type | Function | Example Use Cases |
|---|---|---|---|
| iUUCD 2.0 / UUCD Database [12] [13] | Database | Comprehensive repository of ubiquitin and ubiquitin-like conjugation genes | Source of ubiquitination-related genes for prognostic model development [12] |
| LASSO Cox Regression [4] [12] [22] | Algorithm | Regularized regression for feature selection in high-dimensional data | Identification of most prognostic genes from candidate URGs [4] |
| CIBERSORT/ESTIMATE [4] [86] [13] | Algorithm | Quantification of immune cell infiltration from bulk RNA-seq data | Characterization of tumor immune microenvironment across risk groups [86] |
| oncoPredict [4] [87] | R Package | Prediction of drug sensitivity from gene expression data | Evaluation of therapeutic vulnerabilities in high-risk patients [4] |
| Single-Cell RNA Sequencing [4] [13] | Technology | Characterization of cellular heterogeneity within tumors | Validation of gene expression patterns at single-cell resolution [13] |
The comparative analysis of ubiquitination-related prognostic signatures across lung, ovarian, breast, and esophageal cancers reveals both common patterns and cancer-specific peculiarities. Methodologically, the field has converged on a standard approach combining transcriptomic data from public repositories with ubiquitination-specific gene databases, employing LASSO Cox regression for feature selection, and validating findings in external cohorts. Biologically, these signatures consistently capture disruptions in cell cycle regulation, immune microenvironment, and DNA damage response pathways across cancer types.
The pan-cancer utility of these signatures is evidenced by their ability to stratify patients into distinct risk categories with significant survival differences, with hazard ratios for high-risk groups ranging from 0.54 in lung adenocarcinoma to similarly significant values in other cancers [12]. Furthermore, these signatures show promising utility in predicting response to immunotherapy, chemotherapy, and targeted therapies, highlighting their potential clinical value in treatment selection and drug development.
Future research directions should focus on standardizing analytical pipelines across cancer types, developing multi-omics approaches that integrate ubiquitination signatures with other molecular data, and advancing the translation of these signatures into clinical trials for patient stratification. The emergence of ubiquitination-targeting therapies, including PROTACs, further underscores the clinical relevance of these signatures for identifying patient populations most likely to benefit from novel ubiquitination-targeted treatments [13].
The tumor microenvironment (TME) is a critical determinant of cancer progression, therapeutic response, and patient prognosis. It consists of a complex ecosystem of cancer cells, immune cells, stromal components, and extracellular matrix. Within this landscape, the post-translational modification of proteins via ubiquitination has emerged as a master regulator of tumor-immune interactions. Ubiquitination-related genes (URGs) control the stability, localization, and activity of numerous proteins involved in immune recognition, cancer cell signaling, and stromal remodeling. This guide provides a comprehensive comparison of URG-based prognostic signatures across multiple cancer types, examining their correlation with immune cell infiltration, stromal components, and ultimately, their clinical utility in predicting patient outcomes and therapeutic responses.
Ubiquitination-Related Signatures Across Cancer Types: A Comparative Analysis
Research conducted across multiple malignancies demonstrates that ubiquitination-based signatures consistently stratify patients into distinct prognostic groups with characteristic TME compositions. The table below summarizes key studies investigating URGs and their TME associations.
Table 1: Comparative Analysis of Ubiquitination-Related Prognostic Signatures Across Cancers
| Cancer Type | Key Ubiquitination-Related Genes in Signature | Prognostic Value | Correlation with Immune Landscape | Stromal Association | Citation |
|---|---|---|---|---|---|
| Colon Cancer | ARHGAP4, MID2, SIAH2, TRIM45, UBE2D2, WDR72 | High-risk group = poor prognosis | High-risk group: ↑ MDSC, ↑ T-reg infiltration; Low-risk group: better response to CTLA-4 inhibitors | High-risk group associated with immune-suppressive stroma | [60] |
| Lung Adenocarcinoma | DTL, UBE2S, CISH, STC1 | High URRS = worse prognosis (HR=0.54, 95% CI: 0.39–0.73) | High URRS: ↑ PD-1/PD-L1, ↑ TMB, ↑ TNB, ↑ TME scores | Not explicitly detailed | [12] |
| Laryngeal Cancer | PPARG, LCK, LHX1 | High-risk group = poor overall survival | Low-risk group: ↑ immune function, ↑ anti-cancer immune cells, ↑ immune-promoting cytokines | PPARG and LHX1 negatively correlated with immuno-promoting microenvironment | [35] |
| Diffuse Large B-Cell Lymphoma | CDC34, FZR1, OTULIN | High CDC34/FZR1 + Low OTULIN = poor prognosis | Correlation with endocytosis and T-cell mechanisms | Not explicitly detailed | [4] |
| Ovarian Cancer | 17-Gene Signature (including FBXO45) | High-risk group = lower overall survival (P<0.05) | Low-risk group: ↑ CD8+ T cells, ↑ M1 macrophages, ↑ follicular cells | FBXO45 promotes malignancy via Wnt/β-catenin pathway | [13] |
| Clear Cell Renal Cell Carcinoma | MICALL2, FKBP10, ACADSB | High-risk group = poor prognosis, poor efficacy from ICIs | Risk score correlated with TME and immune cell infiltration | High-risk score linked to altered stromal components | [88] |
Methodological Framework for TME and Ubiquitination Analysis
The construction of URG-based prognostic models and the subsequent analysis of their TME correlation follow a multi-step bioinformatics and experimental pipeline. The workflow below outlines the key stages of this process.
Core Experimental Protocols and Analytical Techniques
Data Acquisition and Preprocessing
- Data Sources: Transcriptomic data (RNA-seq or microarray) and corresponding clinical information are primarily sourced from public repositories such as The Cancer Genome Atlas (TCGA) and Gene Expression Omnibus (GEO) [35] [60] [12].
- Ubiquitin-Related Gene Compilation: URGs are systematically collected from specialized databases including the integrated Ubiquitin and Ubiquitin-like Conjugation Database (iUUCD 2.0) and UbiBrowser 2.0, encompassing E1 ubiquitin-activating enzymes, E2 ubiquitin-conjugating enzymes, E3 ubiquitin ligases, and deubiquitinating enzymes [60] [12].
- Data Normalization: Raw gene expression data (e.g., FPKM, Counts) are normalized (e.g., converted to TPM) and often transformed using log2(expression + 1) to improve normality. Batch effects are corrected using algorithms like ComBat from the
svaR package [60].
Prognostic Signature Construction
- Differential Expression Analysis: Differentially expressed URGs (DE-URGs) between tumor and normal tissues are identified using R packages such as
DESeq2orlimma, with thresholds typically set at |log2 fold change| > 1 and adjusted p-value < 0.05 [88] [35]. - Feature Selection & Model Building: Survival-associated DE-URGs are identified via univariate Cox regression. The most prognostically informative genes are selected using Least Absolute Shrinkage and Selection Operator (LASSO) Cox regression, which penalizes model complexity to prevent overfitting [4] [35] [12]. The final model is built using multivariate Cox regression.
Risk Score Calculation: A risk score for each patient is computed using the formula:
Risk score = Σ (Expression of Genei × Coefficienti) [35] [13]
Patients are dichotomized into high- and low-risk groups based on the median risk score or an optimized cut-off value.
Tumor Microenvironment Profiling
- Immune and Stromal Scoring: The ESTIMATE algorithm is widely used to infer stromal and immune cell infiltration in tumor tissues based on specific gene expression signatures. It generates three scores:
- Immune Cell Deconvolution: The CIBERSORT algorithm is employed to estimate the relative abundances of 22 specific immune cell types within a bulk tumor tissue sample, using a pre-defined leukocyte gene signature matrix (LM22) [88] [89].
- Functional Immune Analysis: Single-sample Gene Set Enrichment Analysis (ssGSEA) is used to quantify the activity of pre-defined immune pathways or the abundance of specific immune cell populations based on curated gene lists [60] [90].
Predicting Therapy Response
- Immunotherapy Prediction: The Tumor Immune Dysfunction and Exclusion (TIDE) platform is used to model two primary mechanisms of tumor immune escape (T cell dysfunction and exclusion) to predict the likelihood of response to immune checkpoint inhibitors [88] [60].
- Drug Sensitivity Analysis: Computational tools like
oncoPredictcalculate the half-maximal inhibitory concentration (IC50) for a range of chemotherapeutic and targeted drugs, allowing for the comparison of predicted drug sensitivity between risk groups [4].
The Biological Interplay Between Ubiquitination and the TME
Ubiquitination processes sit at the nexus of critical pathways that shape the tumor immune landscape. The following diagram illustrates the key mechanistic relationships.
Key Mechanistic Insights
Regulation of Immune Checkpoints: Ubiquitin ligases and deubiquitinases directly control the protein stability of key immune checkpoints like PD-1 and PD-L1. For instance, the deubiquitinase USP14 has been shown to inhibit PD-1 expression, impacting CD8+ T cell infiltration [35]. This regulation directly influences the efficacy of immune checkpoint inhibitor therapies.
Control of Infiltrating Immune Cells: URG signatures are strongly correlated with the abundance of specific immune populations. In ovarian cancer, the low-risk URG group showed significantly higher levels of anti-tumor immune cells, including CD8+ T cells and M1 macrophages [13]. Conversely, in colon cancer, a high-risk URG signature was associated with infiltration of immunosuppressive cells like myeloid-derived suppressor cells (MDSCs) and regulatory T cells (T-regs), creating a favorable environment for tumor progression [60].
Modulation of Stromal Components: The stromal compartment is actively shaped by ubiquitination. In laryngeal cancer, specific URGs like PPARG and LHX1 showed a negative correlation with an immune-promoting microenvironment, suggesting a role in establishing an immunosuppressive stromal barrier [35]. The ESTIMATE stromal score is frequently used to quantify this component, with high stromal presence often correlating with physical barriers to drug delivery and immune cell penetration.
Table 2: Key Reagents and Computational Tools for URG-TME Research
| Category | Specific Tool / Reagent | Function in Analysis | Application Example |
|---|---|---|---|
| Data Resources | The Cancer Genome Atlas (TCGA) | Provides standardized multi-omics and clinical data for >30 cancers | Primary source for model training and discovery [88] [12] |
| Gene Expression Omnibus (GEO) | Repository for functional genomics data; source of validation cohorts | Independent validation of prognostic signatures (e.g., GSE39582 for colon cancer) [60] | |
| URG Databases | iUUCD 2.0 / UbiBrowser 2.0 | Curated databases of ubiquitin and ubiquitin-like conjugation proteins | Definitive source for compiling URGs for analysis [60] [12] |
| Computational Tools (R Packages) | glmnet |
Performs LASSO regression for feature selection | Identifies most prognostic URGs from a larger candidate list [4] [35] |
estimate |
Calculates immune, stromal, and estimate scores | Infers non-tumor cell content and tumor purity from RNA-seq data [89] [90] | |
CIBERSORT |
Deconvolutes bulk tumor expression into 22 immune cell types | Quantifies tumor-infiltrating immune cell composition [88] [89] | |
maftools |
Analyzes and visualizes somatic mutation data | Assesses tumor mutation burden (TMB) and co-mutation patterns [13] [12] | |
| Validation Reagents | Anti-FBXO45 Antibody | Detects expression of specific E3 ligase in validation studies | Experimental validation of key URG model components (Western blot, IHC) [13] |
| siRNA/shRNA for Gene Knockdown | Functionally interrogates role of specific URGs | Determines impact of URG loss/gain on proliferation, invasion (e.g., WDR72 in colon cancer) [60] |
Ubiquitination-related gene signatures provide a powerful and reproducible framework for prognostic stratification across diverse cancer types. The correlation between these signatures and specific TME features—particularly immune cell infiltration and stromal composition—is robust and mechanistically grounded. The consistent methodological approach, leveraging large public datasets and sophisticated bioinformatics algorithms, has yielded models that not only predict survival but also infer the underlying immune contexture of tumors. This, in turn, offers invaluable insights for personalizing therapeutic strategies, potentially guiding choices between chemotherapy, targeted therapies, and immunotherapies. As the ubiquitin proteasome system becomes increasingly druggable, notably with the advent of proteolysis-targeting chimeras (PROTACs), these URG-based models are poised to transition from prognostic biomarkers to direct guides for therapeutic intervention.
The ubiquitin-proteasome system, a crucial post-translational regulatory mechanism, has emerged as a pivotal determinant of therapeutic response in oncology. Recent research has illuminated how ubiquitination signatures—specific patterns of ubiquitin-related gene expression—can predict sensitivity or resistance to both chemotherapy and immunotherapy. These signatures reflect fundamental cancer biology processes including DNA damage repair, immune microenvironment modulation, and apoptotic pathway regulation. This review synthesizes current evidence on ubiquitination-based prognostic models across cancer types, comparing their predictive performance for treatment response and outlining standardized methodological approaches for biomarker development.
Ubiquitination Signatures as Predictive Biomarkers Across Cancers
Diffuse Large B-Cell Lymphoma (DLBCL)
In DLBCL, a 3-gene ubiquitination signature (CDC34, FZR1, and OTULIN) effectively stratifies patients by prognosis and treatment sensitivity. Elevated CDC34 and FZR1 with low OTULIN expression correlates with poor prognosis and distinct immune microenvironment alterations. This signature demonstrates significant associations with drug sensitivity, particularly showing differential responses to Osimertinib and experimental compounds between risk groups [4].
Table 1: Ubiquitination-Based Prognostic Signature in DLBCL
| Gene Symbol | Gene Full Name | Expression in Poor Prognosis | Associated Biological Processes | Therapeutic Associations |
|---|---|---|---|---|
| CDC34 | Cell Division Cycle 34 | Elevated | Cell cycle control, proliferation | Resistance to targeted compounds |
| FZR1 | Fizzy-related protein homolog 1 | Elevated | Endocytosis, cell cycle regulation | Correlated with T-cell infiltration |
| OTULIN | OTU Deubiquitinase with Linear Linkage Specificity | Reduced | Linear ubiquitination regulation, NF-κB signaling | Enhanced sensitivity to specific agents |
Laryngeal Cancer (LC)
A ubiquitination-related gene signature (PPARG, LCK, and LHX1) demonstrates robust prognostic prediction in laryngeal cancer. The risk groups stratified by this signature show distinct immune microenvironment characteristics: low-risk patients exhibit more activated immune function, higher infiltration of anti-cancer immune cells, and stronger expression of immune-promoting cytokines. These differences translate to varied treatment recommendations, with chemotherapy potentially more effective for high-risk patients and immune checkpoint inhibitors more beneficial for low-risk patients [35].
Table 2: Ubiquitination-Based Risk Stratification in Laryngeal Cancer
| Risk Group | Immune Function | Immune Cell Infiltration | Cytokine Environment | Recommended Therapy |
|---|---|---|---|---|
| Low-risk | More activated | Higher anti-cancer immune cells | Immune-promoting cytokines predominant | Immune checkpoint inhibitors |
| High-risk | Less activated | Lower anti-cancer immune cells | Immunosuppressive environment | Chemotherapy |
Ovarian Cancer
A comprehensive 17-gene ubiquitination signature effectively predicts prognosis and immune landscape in ovarian cancer. Low-risk patients show significantly higher infiltration of CD8+ T cells, M1 macrophages, and follicular helper T cells, creating an immune-favorable microenvironment. High-risk patients demonstrate distinct mutation patterns in MUC17 and LRRK2 genes. Experimental validation identified FBXO45 as a key E3 ubiquitin ligase promoting ovarian cancer progression through Wnt/β-catenin pathway activation [13].
Breast Cancer
A 6-gene ubiquitination signature (ATG5, FBXL20, DTX4, BIRC3, TRIM45, and WDR78) shows robust prognostic performance across multiple validation datasets. Single-cell analysis reveals distinctive immune cell distribution patterns between risk groups, with Vd2 γδ T cells less abundant in low-risk patients and myeloid dendritic cells absent in high-risk patients. Tumor microbiome analysis further reveals significant microbial diversity differences between risk groups, suggesting complex ecosystem influences on treatment response [5].
Chromosomal Instability Signatures in Chemotherapy Response Prediction
Beyond ubiquitination signatures, chromosomal instability (CIN) signatures provide complementary biomarkers for chemotherapy resistance prediction. These signatures identify resistance to platinum-, taxane- and anthracycline-based treatments through a single genomic test, demonstrating clinical value across multiple cancer types [91].
Table 3: Chromosomal Instability Signatures for Chemotherapy Resistance Prediction
| Therapy Class | CIN Signature | Resistance Mechanism | Predictive Performance (Hazard Ratio) | Applicable Cancers |
|---|---|---|---|---|
| Platinum-based | CX2 > CX3 ratio | Impaired homologous recombination without synthetic lethality | HR 1.46 (ovarian) | Ovarian, esophageal |
| Taxanes | CX5 < 0 (z-score) | Altered cellular response to microtubule disruption | HR 3.98-7.44 | Ovarian, breast, prostate |
| Anthracyclines | CX8, CX9, CX13 presence | Micronuclei tolerance via noncanonical NF-κB signaling | HR 1.88-3.69 | Ovarian, breast, sarcoma |
Standardized Methodological Framework
Data Acquisition and Preprocessing
The standard protocol begins with RNA-seq data and clinical information acquisition from public repositories (TCGA, GEO) or institutional cohorts. Data normalization employs transcripts per kilobase of exon model per million mapped reads (TPM) or fragments per kilobase million (FPKM) normalization. For chromosomal instability signatures, whole-genome sequencing or shallow whole-genome sequencing data provides copy number variation profiles [4] [35] [91].
Signature Development Workflow
The analytical pipeline proceeds through differential expression analysis, survival-associated gene selection, and multivariate model construction. Ubiquitination-related genes are typically sourced from specialized databases (UUCD, UbiBrowser). Differential expression analysis utilizes the 'limma' R package with thresholds of |logFC| > 1 and FDR < 0.05. Survival-associated gene identification employs univariate Cox regression (p < 0.05). Final signature construction uses LASSO Cox regression with 10-fold cross-validation to prevent overfitting [4] [35] [13].
Model Validation and Clinical Application
Established prognostic signatures undergo rigorous validation through Kaplan-Meier survival analysis, receiver operating characteristic (ROC) curves, and decision curve analysis. For clinical translation, researchers often construct nomograms incorporating signature risk scores with traditional clinical factors (age, stage, grade) to enhance predictive accuracy. Immune correlation analyses utilize CIBERSORT or ESTIMATE algorithms to quantify tumor microenvironment composition [4] [35] [13].
Ubiquitination Mechanisms in Therapy Response
Signaling Pathways Modulating Treatment Sensitivity
Ubiquitination regulates therapy response through multiple interconnected signaling pathways. E3 ubiquitin ligases and deubiquitinating enzymes control key cancer-related processes including immune checkpoint expression, DNA damage response, and apoptotic signaling. The diagram below illustrates the principal mechanisms through which ubiquitination signatures influence chemotherapy and immunotherapy sensitivity [4] [35] [13].
Immune Microenvironment Modulation
Ubiquitination significantly influences immune cell infiltration and function within the tumor microenvironment. Specific ubiquitination patterns correlate with CD8+ T-cell abundance, macrophage polarization, and myeloid-derived suppressor cell recruitment. These immune alterations directly impact immunotherapy efficacy, particularly for immune checkpoint inhibitors targeting PD-1/PD-L1 axis. For example, in laryngeal cancer, PPARG and LHX1 show negative correlation with immune-promoting microenvironments, while LCK demonstrates positive correlation [35].
Research Reagent Solutions
Table 4: Essential Research Reagents for Ubiquitination Signature Studies
| Reagent/Category | Specific Examples | Research Function | Application Context |
|---|---|---|---|
| Bioinformatics Tools | limma R package, CIBERSORT, ESTIMATE | Differential expression analysis, immune cell decomposition | All ubiquitination signature studies |
| Ubiquitination Databases | UUCD, UbiBrowser 2.0 | Reference ubiquitination-related genes | Gene set compilation [35] [13] |
| Cell Line Models | A2780 (ovarian), HEY (ovarian) | Functional validation experiments | FBXO45 mechanistic studies [13] |
| Proteomics Platforms | Liquid chromatography-mass spectrometry | Metabolite and protein biomarker identification | Immunotherapy response prediction [92] |
| Sequencing Approaches | Whole-genome sequencing, shallow WGS | Chromosomal instability signature detection | Chemotherapy resistance prediction [91] |
| Validation Antibodies | FBXO45, β-catenin, pathway components | Western blot, immunohistochemical confirmation | Mechanism exploration [13] |
Ubiquitination signatures represent powerful emerging tools for predicting therapy response across cancer types. These molecular fingerprints provide insights into fundamental cancer biology while offering clinically actionable information for treatment selection. Standardized methodological approaches encompassing bioinformatics analysis, experimental validation, and clinical correlation enable robust signature development. As research progresses, ubiquitination-based classifiers promise to enhance personalized oncology by guiding more precise matching of patients with effective therapies, ultimately improving outcomes while reducing treatment-related toxicity. Future directions should focus on multi-omics integration, analytical standardization, and prospective clinical validation to translate these promising biomarkers into routine clinical practice.
Ubiquitination-related genes (URGs) have emerged as pivotal regulators in oncogenesis and cancer progression, controlling critical processes such as cell cycle progression, signal transduction, and DNA repair through post-translational modifications [24] [93]. The ubiquitin-proteasome system, comprising E1 (activating), E2 (conjugating), and E3 (ligating) enzymes, represents a complex regulatory network whose dysregulation has been associated with various cancer hallmarks [12] [5]. Recent advances in single-cell genomics have enabled researchers to resolve URG expression patterns at unprecedented cellular resolution, revealing substantial heterogeneity within tumor ecosystems that was previously obscured in bulk sequencing approaches [94] [95]. This review provides a comprehensive comparison of current methodologies for validating URG expression at single-cell resolution, focusing on their applications in developing prognostic signatures across cancer types and their implications for therapeutic development.
URG Prognostic Signatures Across Cancer Types: A Comparative Analysis
Comprehensive bioinformatics analyses have identified numerous URG-based prognostic signatures across various malignancies. These signatures demonstrate remarkable capacity for risk stratification and treatment response prediction in diverse cancer populations.
Table 1: URG Prognostic Signatures Across Cancer Types
| Cancer Type | Key URGs Identified | Validation Approach | Prognostic Value | Citation |
|---|---|---|---|---|
| Breast Cancer | CDC20, PCGF2, UBE2S, SOCS2 | LASSO Cox regression; validated in GSE20685 | Significant overall survival difference (P<0.001); independent risk factor | [24] |
| Breast Cancer | ATG5, FBXL20, DTX4, BIRC3, TRIM45, WDR78 | NMF algorithm; validated in TCGA-BRAC, GSE1456, GSE16446 | Good prognostic power across multiple external datasets | [5] |
| Lung Adenocarcinoma | DTL, UBE2S, CISH, STC1 | Random Survival Forests; LASSO Cox; 6 external validation cohorts | HR=0.54, 95% CI: 0.39-0.73, p<0.001; validated in 6 cohorts | [12] |
| Colon Cancer | 7-gene signature (detailed genes not specified) | LASSO regression; validated in GSE17538 | AUC consistently >0.7; correlated with TME | [90] |
| Sarcoma | CALR, CASP3, BCL10, PSMD7, PSMD10 | LASSO-Cox regression; validated in GEO datasets | Correlated with immunotherapy response and drug sensitivity | [93] |
| Osteoarthritis | WDR74, TNFRSF12A | XGBoost; IHC validation on human knee joints | AUC consistently >0.9; upregulated in OA tissues | [94] |
The consistent emergence of URG signatures across disparate cancer types underscores the fundamental role of ubiquitination processes in oncogenesis. Notably, several URGs reappear in signatures for different cancers, suggesting conserved mechanisms of action. For instance, UBE2S was identified as a component of prognostic signatures in both breast cancer and lung adenocarcinoma [24] [12]. The remarkable prognostic accuracy of these signatures, with area under the curve (AUC) values frequently exceeding 0.9 in osteoarthritis and consistently above 0.7 in colon cancer, highlights their clinical potential [94] [90].
Single-Cell RNA Sequencing for URG Expression Analysis: Technical Considerations
Single-cell RNA sequencing (scRNA-seq) has revolutionized our ability to profile URG expression patterns across heterogeneous cell populations within tumors. However, this approach presents unique technical challenges that must be addressed through appropriate experimental design and computational methods.
A critical challenge in scRNA-seq analysis is the distinguishing of biological zeros (genes truly not expressed in a cell) from technical zeros (genes expressed but not detected due to methodological limitations) [96]. The high dropout rate characteristic of scRNA-seq protocols can significantly impact the accurate quantification of URG expression, particularly for moderately expressed genes. Computational approaches such as the Adaptively Thresholded Low-Rank Approximation (ALRA) method have been developed to impute technical zeros while preserving biological zeros, substantially improving downstream analysis [96].
Table 2: Key Research Reagent Solutions for Single-Cell URG Validation
| Reagent/Resource | Function | Application Example | Specifications | |
|---|---|---|---|---|
| CellChat R Package | Analysis of intercellular communication | Investigating potential mechanisms between chondrocytes in osteoarthritis | Identifies altered signaling pathways in disease states | [94] |
| AUCell Package | Calculation of ubiquitination scores | Evaluating pathway activity based on URGs in single cells | Quantifies biological activity from scRNA-seq data | [94] |
| ConsensusClusterPlus | Unsupervised clustering of cell types | Identifying molecular subtypes based on URG expression patterns | Utilizes K-means algorithm with Euclidean distance | [12] |
| UUCD 2.0 Database | Repository of ubiquitination-related genes | Source of 966 URGs for lung adenocarcinoma study | Includes E1, E2, and E3 enzymes | [12] |
| GeneCards Database | Gene-centric integrated database | Identifying URGs with relevance score >5 for sarcoma study | Provides relevance scores for gene-disease associations | [93] |
| glmnet R Package | LASSO regression analysis | Selecting prognostic URGs and constructing risk models | Performs regularized regression for feature selection | [24] [90] |
Orthogonal validation of scRNA-seq findings remains essential for confirming hypotheses generated through sequencing approaches [95]. As noted by Colonna et al., "hypotheses derived from these assays, including gene expression information, require validation, and their functional relevance needs to be established" [95]. The choice of validation technique depends on multiple factors, including the specific biological question, cellular resolution required, and throughput needs.
Experimental Workflows for Single-Cell URG Validation
Integrated scRNA-seq and Machine Learning Pipeline
Chen et al. established a comprehensive workflow for identifying URG biomarkers that integrates single-cell transcriptomics with machine learning algorithms [94]. This approach begins with the collection of OA single-cell RNA sequencing datasets from the GEO database, followed by quality control and normalization procedures. Subsequently, single-cell analysis investigates the composition and relationships of chondrocytes in osteoarthritis, while the CellChat R package explores potential intercellular communication mechanisms [94]. URGs are retrieved from GeneCards, and ubiquitination scores are calculated using the AUCell package. Gene module analysis based on co-expression networks identifies core genes, followed by machine learning analysis using XGBoost to identify core URGs and construct diagnostic models [94]. The model performance is evaluated using AUC of ROC curves, and relationships between core URGs and immune processes are explored. Finally, transcription factor predictions are performed using the ChEA3 database, with expression validation via qRT-PCR and immunohistochemistry (IHC) [94].
Ubiquitination-Related Risk Score Development in Lung Adenocarcinoma
An alternative workflow for developing ubiquitination-related risk scores was implemented in lung adenocarcinoma, incorporating multiple validation steps [12]. This methodology begins with collection of URGs from the iUUCD 2.0 database, followed by acquisition of gene expression profiles and corresponding clinical datasets from GEO and TCGA. Consensus clustering analysis using the "ConsensusClusterPlus" R package identifies distinct molecular subtypes based on URG expression [12]. Differentially expressed URGs between subtypes are identified using the "limma" R package, followed by prognostic URG detection through Univariate Cox regression, Random Survival Forests, and LASSO Cox regression algorithms. Ubiquitination-related risk scores are then calculated based on multivariate Cox regression analysis, and patients are stratified into high and low-risk groups based on median risk scores [12]. Finally, comprehensive characterization of immune infiltration, therapy response, and biological pathways is performed across risk groups.
URG Signaling Pathways and Biological Mechanisms in Cancer
URGs regulate critical cancer-associated signaling pathways through diverse mechanisms. The ubiquitin-proteasome system exerts profound influence on tumor progression through regulation of protein stability, localization, and activity of key signaling molecules [90]. In non-small cell lung cancer, various ubiquitination pathways have been associated with occurrence and development, including KRAS stability regulation, MetaLnc9-PGK1 interactions affecting metastasis, MDM2/MDMX-mediated p53 degradation, and HIF-1α stability affecting hypoxia response [12]. Additionally, specific ubiquitinating enzymes such as USP22, UBE2S, USP17, and USP10 play crucial roles in regulating signaling pathways including EGFR, Wnt/β-catenin, NF-κB, and AKT, thereby influencing tumor progression, metastasis, and cell cycle control [12].
In sarcoma, URG-related subtypes demonstrate distinct pathway enrichment patterns, with differentially expressed genes between subtypes primarily enriched in cell cycle, focal adhesion, and ECM-receptor interaction pathways [93]. Similarly, in breast cancer, URGs have been associated with DNA replication, DNA repair, and cell cycle functions through gene set enrichment analysis [24]. These findings suggest that despite tissue-specific differences, URGs consistently converge on core oncogenic pathways across cancer types.
Orthogonal Validation Methods for URG Expression Findings
Orthogonal validation constitutes an essential step in confirming URG expression patterns and functional roles identified through single-cell approaches. Multiple complementary techniques provide verification across different biological levels.
Immunohistochemistry represents a widely employed method for validating protein-level expression of URGs in tissue contexts. For instance, Chen et al. performed IHC validation on human knee joint specimens, confirming the upregulation of WDR74 and TNFRSF12A in osteoarthritis tissues [94]. Similarly, studies of URG4 in gastric and cervical cancer employed IHC staining of paraffin-embedded tissues, demonstrating correlation between protein expression and clinicopathological parameters [28] [29]. IHC provides spatial context for URG expression within tissue architecture but lacks single-cell resolution in most applications.
Reverse transcription-quantitative PCR (RT-qPCR) offers sensitive mRNA quantification for validating expression levels of candidate URGs. Multiple studies have implemented RT-qPCR following computational identification of URGs, including research on lung adenocarcinoma and sarcoma [12] [93]. This approach provides precise quantification of expression but typically requires cell sorting or bulk analysis that may mask cellular heterogeneity.
Functional validation approaches include in vitro experiments using cell lines with modulated URG expression. For example, studies of URG4 in cervical cancer employed western blotting to confirm protein expression in cancer cell lines compared to normal cervical epithelial cells [29]. Similarly, in osteoarthritis research, in vitro qPCR experiments examined WDR74 and TNFRSF12A expression in IL-1β-induced groups [94]. These functional studies establish mechanistic links between URG expression and cellular phenotypes.
Clinical Implications and Therapeutic Perspectives
The resolution of URG expression at single-cell resolution holds significant promise for clinical translation in oncology. Several compelling applications are emerging from current research.
URG signatures demonstrate considerable potential as prognostic biomarkers across cancer types. For example, the 4-URG signature (CDC20, PCGF2, UBE2S, SOCS2) in breast cancer enabled stratification of patients into high-risk and low-risk groups with significantly different overall survival [24]. Similarly, in lung adenocarcinoma, the URRS signature (DTL, UBE2S, CISH, STC1) identified patients with worse prognosis (HR=0.54, 95% CI: 0.39-0.73, p<0.001) [12]. These signatures frequently provide prognostic value independent of traditional clinical parameters, suggesting potential utility in clinical decision-making.
URG expression patterns also show promise in predicting treatment response. In sarcoma, high-risk patients based on URG signatures were identified as potential beneficiaries of immune checkpoint inhibitor therapy [93]. Similarly, in lung adenocarcinoma, the high URRS group demonstrated higher PD1/L1 expression levels (p<0.05), suggesting enhanced susceptibility to immunotherapy [12]. Additionally, studies have revealed correlations between URG signatures and chemotherapeutic sensitivity, with the high URRS group in lung adenocarcinoma showing lower IC50 values for various chemotherapy drugs [12].
The identification of critical URGs in cancer pathogenesis also reveals potential therapeutic targets. For instance, WDR74 and TNFRSF12A in osteoarthritis were highlighted as attractive therapeutic targets based on their pivotal role in disease pathogenesis [94]. Similarly, URG4 has been proposed as a therapeutic target in cervical cancer based on its correlation with disease progression and poor prognosis [29]. The development of targeted therapies against specific URGs represents a promising frontier in precision oncology.
Single-cell validation approaches have dramatically enhanced our ability to resolve URG expression patterns within the complex cellular ecosystems of tumors. The integration of scRNA-seq with machine learning algorithms has enabled identification of robust URG signatures with significant prognostic value across diverse cancer types. Orthogonal validation through IHC, RT-qPCR, and functional studies remains essential for confirming computational predictions and establishing biological relevance. As single-cell technologies continue to advance and incorporate multi-omic measurements, they promise to unveil increasingly sophisticated understanding of ubiquitination networks in cancer biology. These insights will accelerate the development of URG-based prognostic tools and targeted therapies, ultimately improving precision oncology approaches for cancer patients.
Conclusion
Ubiquitination-related gene signatures represent a transformative approach in cancer prognostication, consistently demonstrating the ability to stratify patients into distinct risk categories across multiple cancer types. These signatures provide insights that extend beyond survival prediction, revealing characteristics of the tumor immune microenvironment and potential susceptibility to specific therapies, including immunotherapy. The convergence of bioinformatics and ubiquitination biology is paving the way for more personalized oncology. Future efforts must focus on the clinical translation of these models, including prospective validation in clinical trials and their integration into standard diagnostic workflows. Furthermore, the identified key URGs, such as CDC34, FZR1, and OTULIN, are not just biomarkers but also promising therapeutic targets. The development of novel agents, particularly PROTACs and molecular glues that exploit the ubiquitin-proteasome system, offers a direct pathway to target these vulnerabilities, heralding a new era of targeted protein degradation in cancer treatment.
References
- 1. exploring the ubiquitin system for drug development [https://www.nature.com/articles/cr201631]
- 2. Deubiquitinating enzyme - Wikipedia [https://en.wikipedia.org/wiki/Deubiquitinating_enzyme]
- 3. Mechanisms orchestrating the enzymatic activity and cellular... [https://pmc.ncbi.nlm.nih.gov/articles/PMC9356280/]
- 4. A novel ubiquitination-based molecular signature predicts ... [https://pmc.ncbi.nlm.nih.gov/articles/PMC12619766/]
- 5. Construction and validation of a ubiquitination-related ... [https://www.sciencedirect.com/science/article/pii/S2405844024115848]
- 6. A Comparative Analysis of the Ubiquitination Kinetics of ... [https://pmc.ncbi.nlm.nih.gov/articles/PMC3812159/]
- 7. A Data Set of Human Endogenous Protein Ubiquitination ... [https://www.sciencedirect.com/science/article/pii/S1535947620302292]
- 8. Role of Ubiquitin-regulated EMT in Cancer Metastasis and ... [https://pmc.ncbi.nlm.nih.gov/articles/PMC12594574/]
- 9. Constructing a pancancer ubiquitination regulatory network to ... [https://pmc.ncbi.nlm.nih.gov/articles/PMC12382526/]
- 10. A new era in cancer therapy: targeting the Proteasome-Bcl-2 ... [https://jeccr.biomedcentral.com/articles/10.1186/s13046-025-03505-5]
- 11. The role of ubiquitination in cancer stem cell regulation [https://ecancer.org/en/news/26126-the-role-of-ubiquitination-in-cancer-stem-cell-regulation]
- 12. Construction of ubiquitination-related risk model for ... [https://www.nature.com/articles/s41598-025-92177-4]
- 13. Prognostic model of ubiquitination-related genes in ovarian ... [https://www.frontiersin.org/journals/immunology/articles/10.3389/fimmu.2025.1654180/full]
- 14. The ubiquitin code of RAS proteins: Decoding its role in ... [https://www.sciencedirect.com/science/article/pii/S2589004225012908]
- 15. The Rise of Molecular Glues: A New Class of Smart Cancer ... [https://www.news-medical.net/life-sciences/The-Rise-of-Molecular-Glues-A-New-Class-of-Smart-Cancer-Drugs.aspx]
- 16. Identification and validation of ubiquitination-related genes for ... [https://pmc.ncbi.nlm.nih.gov/articles/PMC12343280/]
- 17. Comprehensive genomic profiling of over 10,000 advanced ... [https://pmc.ncbi.nlm.nih.gov/articles/PMC12406462/]
- 18. Exploration of the ubiquitination-related molecular ... [https://www.frontiersin.org/journals/genetics/articles/10.3389/fgene.2024.1292249/full]
- 19. Identification and validation of CDC20 and ITCH as ... [https://hereditasjournal.biomedcentral.com/articles/10.1186/s41065-025-00401-y]
- 20. Identification of ubiquitination-related key biomarkers and ... [https://www.nature.com/articles/s41598-025-88148-4]
- 21. Ubiquitin-related gene markers predict immunotherapy ... [https://www.nature.com/articles/s41598-024-76945-2]
- 22. Identification of a Prognostic Signature for Ovarian Cancer ... [https://pmc.ncbi.nlm.nih.gov/articles/PMC10742228/]
- 23. enhances cell viability and glycolysis in cervical FBXO via... 45 cancer [https://link.springer.com/article/10.1007/s00210-025-04230-8]
- 24. Identification of a novel ubiquitination related gene ... [https://pmc.ncbi.nlm.nih.gov/articles/PMC9478291/]
- 25. Establishment and validation of a ubiquitination-related ... [https://pmc.ncbi.nlm.nih.gov/articles/PMC10289160/]
- 26. A novel ubiquitin-related genes-based signature ... [https://pubmed.ncbi.nlm.nih.gov/40183093]
- 27. A nine–consensus–prognostic –gene–based ... [https://www.frontiersin.org/journals/genetics/articles/10.3389/fgene.2022.909175/full]
- 28. The relationship between URG4 and clinicopathologic ... [https://pmc.ncbi.nlm.nih.gov/articles/PMC11460518/]
- 29. URG4 overexpression is correlated with cervical cancer ... [https://bmccancer.biomedcentral.com/articles/10.1186/1471-2407-14-885]
- 30. The expression of novel gene URG4 in osteosarcoma ... [https://www.sciencedirect.com/science/article/pii/S0031302516320414]
- 31. The Next Generation Cancer Knowledge Base | NCI Genomic Data ... [https://gdc.cancer.gov/]
- 32. Use GDC to view and download API - Programmer Sought TCGA data [https://programmersought.com/article/43236951685/]
- 33. GEO Accession viewer - NCBI - NIH [https://www.ncbi.nlm.nih.gov/geo/query/acc.cgi]
- 34. UUIDS to TCGA barcode (SampleID) in R TCGA [https://www.biostars.org/p/215175/]
- 35. A novel ubiquitin-related genes-based signature ... [https://www.frontiersin.org/journals/pharmacology/articles/10.3389/fphar.2025.1513948/full]
- 36. Transcriptome Analysis and Single-Cell Sequencing Analysis... [https://pubmed.ncbi.nlm.nih.gov/35774799/]
- 37. Integrated systems biology reveals an 8-gene signature ... [https://www.nature.com/articles/s41598-025-18567-w]
- 38. Cox regression - MedCalc Statistical Software Manual [https://www.medcalc.org/en/manual/cox-regression.php]
- 39. Analysis of gene expression levels and their impact on ... [https://pmc.ncbi.nlm.nih.gov/articles/PMC9559014/]
- 40. Lasso-Cox Regression for Variable Selection in Survival ... [https://www.serdarbalci.com/jsurvival/articles/09-lassocox-comprehensive.html]
- 41. Risk modeling for esophageal cancer based on adaptive ... [https://pmc.ncbi.nlm.nih.gov/articles/PMC12355212/]
- 42. LASSO-Cox model in the prognostic evaluation of ... [https://pmc.ncbi.nlm.nih.gov/articles/PMC12174080/]
- 43. an analytical approach utilizing lasso-cox regression | BMC ... [https://bmccancer.biomedcentral.com/articles/10.1186/s12885-025-13810-z]
- 44. Risk score model for predicting local control and survival in ... [https://pmc.ncbi.nlm.nih.gov/articles/PMC11962578/]
- 45. Discovery and Validation of Predictive Biomarkers ... [https://pmc.ncbi.nlm.nih.gov/articles/PMC4563120/]
- 46. Assessment of performance of survival prediction models for ... [https://bmcmedresmethodol.biomedcentral.com/articles/10.1186/1471-2288-12-102]
- 47. The Clinical Prediction Value of the Ubiquitination Model Reflecting... [https://www.jcancer.org/v16p0784.htm]
- 48. Frontiers | Identification and validation of ubiquitination -related genes... [https://www.frontiersin.org/journals/genetics/articles/10.3389/fgene.2025.1578075/full]
- 49. Ubiquitin-conjugating enzyme E2S (UBE2S) as a ... [https://www.sciencedirect.com/science/article/abs/pii/S1567576925005351]
- 50. Ubiquitination and ALL: Identifying FBXO8 as a prognostic ... [https://www.frontiersin.org/journals/immunology/articles/10.3389/fimmu.2025.1554231/full]
- 51. Transcriptomics-based exploration of ubiquitination -related... [https://pmc.ncbi.nlm.nih.gov/articles/PMC12070575/]
- 52. Consensus clustering methodology to improve molecular ... [https://www.nature.com/articles/s41598-023-33954-x]
- 53. Prognostic molecular subtype reveals the heterogeneity of ... [https://www.nature.com/articles/s41598-025-96686-0]
- 54. Profiling the heterogeneity of colorectal cancer consensus ... [https://www.nature.com/articles/s41698-023-00488-4]
- 55. Evaluating generalizability of oncology trial results to real- ... [https://www.nature.com/articles/s41591-024-03352-5]
- 56. Iterated cross validation method for prediction of survival in ... [https://www.nature.com/articles/s41598-023-28394-6]
- 57. Frontiers | A ubiquitin-related gene signature for predicting prognosis and constructing molecular subtypes in osteosarcoma [https://www.frontiersin.org/articles/10.3389/fphar.2022.904448/full]
- 58. Development and validation of a machine learning–based ... [https://pmc.ncbi.nlm.nih.gov/articles/PMC12638397/]
- 59. Gene signature and prognostic value of ubiquitination-related genes in endometrial cancer - PubMed [https://pubmed.ncbi.nlm.nih.gov/36611207/]
- 60. Exploration of the ubiquitination-related molecular ... [https://pmc.ncbi.nlm.nih.gov/articles/PMC11390591/]
- 61. Development and verification of a novel risk model related ... [https://www.nature.com/articles/s41598-024-75948-3]
- 62. The Clinical Prediction Value of the Ubiquitination Model Reflecting... [https://pmc.ncbi.nlm.nih.gov/articles/PMC11705054/]
- 63. Prognostic Role of Tumor Mutational Burden in Cancer ... [https://pmc.ncbi.nlm.nih.gov/articles/PMC8358612/]
- 64. The predictive efficacy of tumor mutation burden in ... [https://www.sciencedirect.com/science/article/pii/S1936523322000377]
- 65. The prognostic value of tumor mutation burden (TMB) and its ... [https://eurjmedres.biomedcentral.com/articles/10.1186/s40001-023-01058-x]
- 66. Methods for multi-omic data integration in cancer research [https://pmc.ncbi.nlm.nih.gov/articles/PMC11446849/]
- 67. Machine learning for multi-omics data integration in cancer [https://www.sciencedirect.com/science/article/pii/S2589004222000682]
- 68. Mechanisms of Generating Polyubiquitin Chains ... [https://pmc.ncbi.nlm.nih.gov/articles/PMC4197637/]
- 69. Ubiquitination in the regulation of inflammatory cell death ... [https://www.nature.com/articles/s41418-020-00708-5]
- 70. Emerging functions of branched ubiquitin chains [https://www.nature.com/articles/s41421-020-00237-y]
- 71. A ubiquitin-related gene signature for predicting prognosis ... [https://www.frontiersin.org/journals/pharmacology/articles/10.3389/fphar.2022.904448/full]
- 72. Mechanisms underlying linear ubiquitination and ... [https://pmc.ncbi.nlm.nih.gov/articles/PMC10685518/]
- 73. Analysis of the topology of ubiquitin chains - PMC [https://pmc.ncbi.nlm.nih.gov/articles/PMC6989142/]
- 74. Emerging biomarkers for early cancer detection and diagnosis [https://pmc.ncbi.nlm.nih.gov/articles/PMC12359849/]
- 75. of a lncRNA Prognostic in early-stage invasive breast... value signature [https://cancerci.biomedcentral.com/articles/10.1186/s12935-025-03832-9]
- 76. Frontiers | Comprehensive analysis based on the ubiquitination - and... [https://www.frontiersin.org/journals/immunology/articles/10.3389/fimmu.2025.1632090/full]
- 77. Integrated Single-Cell and Transcriptome Sequencing Analyses... [https://www.imrpress.com/journal/FBL/28/11/10.31083/j.fbl2811304]
- 78. Preclinical vs. Clinical Biomarkers: Understanding Their ... [https://blog.crownbio.com/preclinical-vs-clinical-biomarkers-understanding-their-distinct-roles-in-drug-development]
- 79. New clinical trial design in precision medicine [https://www.nature.com/articles/s41392-024-01760-0]
- 80. Systematic scoping review of external validation studies ... [https://pmc.ncbi.nlm.nih.gov/articles/PMC12145442/]
- 81. External validation of 87 clinical prediction models ... [https://www.sciencedirect.com/science/article/pii/S0960977623004381]
- 82. Externally validated and clinically useful machine learning ... [https://bmcmedresmethodol.biomedcentral.com/articles/10.1186/s12874-025-02463-y]
- 83. Gene signature and prognostic value of ubiquitination-related ... [https://pmc.ncbi.nlm.nih.gov/articles/PMC9824913/]
- 84. Identification and validation of ubiquitin-proteasome ... [https://www.aging-us.com/article/204383/text]
- 85. Prognostic value of ubiquitination-related differentially ... [https://pmc.ncbi.nlm.nih.gov/articles/PMC11635202/]
- 86. Identification of ubiquitination-related gene classification ... [https://pmc.ncbi.nlm.nih.gov/articles/PMC9853012/]
- 87. UBE2N as a novel prognostic and therapeutic biomarker of ... [https://pmc.ncbi.nlm.nih.gov/articles/PMC12375651/]
- 88. Frontiers | Constructing a novel mitochondrial-related gene signature... [https://www.frontiersin.org/journals/genetics/articles/10.3389/fgene.2025.1543593/full]
- 89. Prognostic values of immune and scores ... immune [https://pmc.ncbi.nlm.nih.gov/articles/PMC7138561/]
- 90. Development and validation of a novel ubiquitination -related gene... [https://tcr.amegroups.org/article/view/67645/html]
- 91. Predicting resistance to chemotherapy using chromosomal ... [https://www.nature.com/articles/s41588-025-02233-y]
- 92. Frontiers | Multi-omics analysis reveals the sensitivity of... [https://www.frontiersin.org/journals/immunology/articles/10.3389/fimmu.2025.1479550/full]
- 93. Frontiers | Integration of ubiquitination-related genes in predictive... [https://www.frontiersin.org/journals/oncology/articles/10.3389/fonc.2024.1446522/full]
- 94. Identification of WDR74 and TNFRSF12A as biomarkers for early... [https://pubmed.ncbi.nlm.nih.gov/39935469/]
- 95. Implementation and validation of single-cell genomics ... [https://pubmed.ncbi.nlm.nih.gov/39627589/]
- 96. Zero-preserving imputation of single-cell RNA-seq data [https://www.nature.com/articles/s41467-021-27729-z]