Ubiquitylomics in Cancer Research: Comprehensive Analysis of Ubiquitination Landscapes in Malignant vs Normal Tissues
This article provides a comprehensive examination of ubiquitylomics—the large-scale study of protein ubiquitination—in the context of cancer biology and therapeutic development.
Ubiquitylomics in Cancer Research: Comprehensive Analysis of Ubiquitination Landscapes in Malignant vs Normal Tissues
Abstract
This article provides a comprehensive examination of ubiquitylomics—the large-scale study of protein ubiquitination—in the context of cancer biology and therapeutic development. Targeting researchers, scientists, and drug development professionals, we explore the fundamental principles of ubiquitin signaling dysregulation in tumorigenesis, advanced mass spectrometry methodologies for ubiquitination profiling, optimization strategies for overcoming technical challenges in tissue analysis, and validation approaches for translating findings into clinical applications. Through comparative analysis of cancerous versus normal tissues, this review highlights how ubiquitylomics identifies novel therapeutic targets, reveals disease mechanisms, and informs the development of targeted cancer therapies including proteasome inhibitors and E3 ligase modulators.
Decoding the Ubiquitin Code: Fundamental Principles and Cancer Relevance
The Ubiquitin-Proteasome System (UPS) is a crucial mechanism for maintaining cellular protein homeostasis, responsible for the controlled degradation of short-lived, misfolded, and damaged proteins [1] [2]. This system regulates the turnover of over 80% of cellular proteins and is integral to fundamental biological processes, including cell cycle progression, gene expression, DNA damage repair, and responses to oxidative and inflammatory stress [1] [3]. The UPS operates through a coordinated enzymatic cascade that tags target proteins with ubiquitin chains, marking them for degradation by the 26S proteasome [1] [2]. Dysregulation of the UPS has been implicated in the pathogenesis of numerous diseases, most notably cancer, making it a focal point for therapeutic development [1] [4]. In cancerous tissues, alterations in UPS components lead to aberrant stability of oncoproteins and tumor suppressors, driving tumorigenesis and progression [4]. This application note details the core components of the UPS and provides methodological frameworks for ubiquitylomics analysis in cancer research.
The Enzymatic Cascade of Ubiquitination
Ubiquitination involves a sequential, ATP-dependent cascade mediated by three key enzyme families: E1 (ubiquitin-activating enzyme), E2 (ubiquitin-conjugating enzyme), and E3 (ubiquitin ligase) [2] [5]. The process culminates in the covalent attachment of ubiquitin to target proteins, which can signal for proteasomal degradation or alter the protein's function, localization, or interactions [1].
Table 1: Core Enzymes of the Ubiquitination Cascade
| Enzyme | Number in Humans | Primary Function | Key Functional Domains |
|---|---|---|---|
| E1 (Activating Enzyme) | Few | Activates ubiquitin in an ATP-dependent manner and transfers it to E2 enzymes. | Active cysteine site for thioester bond formation with ubiquitin. |
| E2 (Conjugating Enzyme) | ~40 | Accepts activated ubiquitin from E1 and collaborates with E3 to transfer ubiquitin to the substrate. | Active cysteine site for thioester bond with ubiquitin. |
| E3 (Ligase Enzyme) | >600 | Confers substrate specificity by recognizing and binding target proteins, facilitating ubiquitin transfer from E2 to substrate. | RING, HECT, or RBR domains that determine the mechanism of ubiquitin transfer. |
The Ubiquitin Transfer Mechanism
The ubiquitination cascade begins with the E1 enzyme, which activates ubiquitin in an ATP-dependent reaction, forming a high-energy thioester bond between its own active cysteine residue and the C-terminal glycine of ubiquitin [5]. The activated ubiquitin is then transferred to the active cysteine site of an E2 enzyme. Finally, an E3 ubiquitin ligase recruits the E2~ubiquitin complex and a specific substrate protein. The E3 catalyzes the transfer of ubiquitin from the E2 to a lysine residue on the substrate protein, forming an isopeptide bond [1] [2]. The mechanism of this final transfer depends on the E3 type: RING-type E3s facilitate direct transfer from the E2 to the substrate, while HECT and RBR-type E3s form a transient thioester intermediate with ubiquitin before transferring it to the substrate [1] [5].
Ubiquitin Linkage Types and Functional Consequences
Ubiquitin itself contains eight primary attachment sites: seven lysine residues (K6, K11, K27, K29, K33, K48, K63) and the N-terminal methionine (M1) [6] [1] [2]. These sites allow for the formation of diverse polyubiquitin chains, each encoding distinct cellular signals.
Table 2: Ubiquitin Linkage Types and Their Primary Functions
| Linkage Type | Primary Cellular Functions | Proteasomal Degradation |
|---|---|---|
| K48-linked | The primary signal for proteasomal degradation of substrate proteins. [1] [5] | Yes |
| K63-linked | Regulates non-proteolytic processes: DNA damage repair, kinase activation, inflammatory signaling, and endocytosis. [6] [1] | No |
| M1-linked (Linear) | Activates NF-κB signaling by modulating the IKK complex; regulates inflammation. [6] [1] | No |
| K11-linked | Involved in cell cycle regulation and ER-associated degradation (ERAD). [1] | Yes (Hybrid chains) |
| K27/K29-linked | DNA damage response, mitochondrial quality control, and innate immune signaling. [1] | Context-dependent |
| K6/K33-linked | DNA damage repair and regulation of intracellular trafficking. [1] | No |
E3 Ubiquitin Ligases and Deubiquitinases (DUBs)
Classification and Function of E3 Ubiquitin Ligases
E3 ubiquitin ligases are the most diverse components of the UPS, providing substrate specificity. With over 600 members in the human genome, they are classified based on their structural domains and mechanisms of ubiquitin transfer [1] [5].
- RING (Really Interesting New Gene) E3 Ligases: This is the largest family of E3 ligases. They function as scaffolds that simultaneously bind the E2~Ub complex and the substrate, facilitating the direct transfer of ubiquitin from the E2 to the substrate without forming an E3-Ub intermediate [1]. Examples include TRAF6 and Cullin-RING Ligases (CRLs), which are multi-subunit complexes [6] [1].
- HECT (Homologous to the E6AP C-Terminus) E3 Ligases: HECT E3s feature an active cysteine residue within their HECT domain. They catalyze a two-step reaction: first, they accept ubiquitin from the E2 enzyme, forming a thioester bond; then, they transfer the ubiquitin to the substrate protein. The Nedd4 family and HERC family are prominent subclasses [1].
- RBR (RING-Between-RING) E3 Ligases: RBR E3s hybridize the mechanisms of RING and HECT types. They contain a RING1 domain that binds the E2~Ub and an intermediate "RING2" domain with an active cysteine residue that accepts ubiquitin before transferring it to the substrate, similar to HECT E3s [1] [5].
The Role of Deubiquitinases (DUBs)
Deubiquitination is the reverse process, catalyzed by Deubiquitinases (DUBs). DUBs are proteases that cleave ubiquitin from substrate proteins, thereby reversing ubiquitin signals and maintaining the pool of free ubiquitin [2]. They play critical editing roles by:
- Rescuing proteins from proteasomal degradation by removing K48-linked chains.
- Terminating ubiquitin-mediated signals, such as those in kinase activation or DNA repair.
- Processing ubiquitin precursors and cleaving polyubiquitin chains to recycle ubiquitin [2].
DUBs are classified into several families, including Ubiquitin-Specific Proteases (USPs), Otubain (OTU) proteases, Ubiquitin C-terminal Hydrolases (UCHs), and JAMM/MPN metalloenzymes [6] [2].
Quantitative Ubiquitylomics in Cancer Research
Quantitative ubiquitylomics is a powerful proteomic approach for globally profiling ubiquitination sites, enabling the systematic comparison of ubiquitinated proteins between cancerous and normal tissues [4]. This methodology is critical for identifying dysregulated pathways and novel therapeutic targets.
Key Experimental Protocol: 4D Label-Free Quantitative Ubiquitylomics
The following protocol is adapted from a study investigating ubiquitination in Oral Adenoid Cystic Carcinoma (OACC) [4].
Objective: To identify and quantify differentially ubiquitinated proteins between OACC tumor tissues and adjacent normal tissues.
Workflow Overview:
- Sample Preparation: Homogenize frozen tissue samples (OACC vs. normal) in a lysis buffer containing protease inhibitors, phosphatase inhibitors, and deubiquitinase inhibitors (e.g., N-Ethylmaleimide).
- Protein Digestion: Denature and reduce lysates. Alkylate cysteine residues. Digest proteins to peptides using trypsin.
- Ubiquitinated Peptide Enrichment: Use anti-di-glycine (K-ε-GG) antibody-conjugated beads to immunoaffinity purify peptides containing the diglycine remnant left after tryptic digestion of ubiquitinated proteins. This is a critical step for enriching low-abundance ubiquitinated peptides.
- LC-MS/MS Analysis:
- Chromatography: Separate enriched peptides using nano-scale liquid chromatography (nanoLC).
- Mass Spectrometry: Analyze peptides using a timsTOF mass spectrometer configured for 4D proteomics (adding ion mobility as a fourth dimension). Data is acquired in a data-independent acquisition (DIA) mode for deep, reproducible quantification.
- Data Processing and Bioinformatic Analysis:
- Identification: Search MS/MS spectra against a human protein database to identify ubiquitination sites.
- Quantification: Use label-free quantification algorithms to compare ubiquitination site abundance between tumor and normal groups.
- Bioinformatics: Perform Gene Ontology (GO) enrichment, Kyoto Encyclopedia of Genes and Genomes (KEGG) pathway analysis, and motif analysis on the differentially ubiquitinated proteins.
Key Findings from Ubiquitylomics Profiling
The application of quantitative ubiquitylomics in OACC research successfully identified 4,152 ubiquitination sites on 1,993 proteins [4]. Bioinformatic analysis of these sites revealed distinct protein clusters and ubiquitination motifs that are dysregulated in carcinoma compared to normal tissues. This systematic mapping provides a rich resource for identifying potential biomarkers and therapeutic targets for this rare salivary gland tumor [4].
The Scientist's Toolkit: Research Reagent Solutions
Table 3: Essential Reagents for Ubiquitylomics and UPS Research
| Reagent / Tool | Function & Application | Example / Note |
|---|---|---|
| K-ε-GG Motif Antibody | Immunoaffinity enrichment of ubiquitinated peptides for mass spectrometry. Critical for ubiquitylomics. [4] | Available as monoclonal antibodies from several vendors (e.g., Cell Signaling Technology, PTM Bio). |
| Proteasome Inhibitors | To block protein degradation and stabilize ubiquitinated proteins for study. | Bortezomib, MG132. Used in cell culture and in vivo studies. [6] [3] |
| Deubiquitinase (DUB) Inhibitors | To preserve ubiquitin chains during sample preparation by preventing their cleavage by endogenous DUBs. | N-Ethylmaleimide (NEM), PR-619. Added to lysis buffers. [4] |
| PROTACs (Proteolysis Targeting Chimeras) | Bifunctional molecules that recruit E3 ligases to target proteins of interest, inducing their degradation. A major therapeutic modality. [6] [1] | Consist of a target protein ligand linked to an E3 ligase ligand (e.g., von Hippel-Lindau or Cereblon). |
| TUBE (Tandem Ubiquitin Binding Entity) | Affinity matrices to purify polyubiquitinated proteins from complex lysates. | Used for pull-down assays to study endogenous protein ubiquitination. |
| Recombinant E1, E2, E3 Enzymes | For in vitro ubiquitination assays to study specific enzyme activities, kinetics, and substrate identification. | Available from specialized protein suppliers. |
Ubiquitination is a critical post-translational modification that regulates nearly every cellular process in eukaryotes, employing a simple 9.6 kDa protein—ubiquitin—to generate complex signals that control protein fates [7]. The remarkable functional diversity of ubiquitination stems from the various architectures of ubiquitin chains that can be formed, known collectively as the "ubiquitin code" [7]. These architectures include monoubiquitination, multi-monoubiquitination, and polyubiquitin chains that can be homotypic (uniformly linked through the same ubiquitin residue), heterotypic mixed (containing multiple linkage types but with each ubiquitin modified at only one site), or heterotypic branched (containing ubiquitin monomers simultaneously modified at two or more different sites) [8]. The specificity of ubiquitin signaling is determined by the combination of linkage types, chain length, and overall architecture, which are recognized by specific ubiquitin-binding proteins (UBPs) containing ubiquitin-binding domains (UBDs) to execute appropriate cellular responses [7] [8].
The two most abundant and well-studied linkage types are lysine 48-linked (K48) and lysine 63-linked (K63) ubiquitin chains. K48-linked chains represent the classical degradation signal, predominantly targeting proteins for proteasomal degradation, while K63-linked chains primarily regulate non-degradative functions including signal transduction, protein trafficking, autophagy, and DNA repair pathways [7] [8] [9]. Recent research has revealed that these linkage types do not always function independently; they can combine to form branched ubiquitin chains that create unique signaling properties not present in homotypic chains [7] [8] [10]. Understanding the intricacies of ubiquitin linkage diversity is particularly crucial in cancer research, where dysregulation of ubiquitin signaling contributes to tumor development, progression, and therapeutic resistance [11] [12] [13].
Ubiquitin Chain Types and Their Cellular Functions
Specification of Major Ubiquitin Linkages
The ubiquitin code encompasses a diverse array of chain types that regulate distinct cellular outcomes. Table 1 summarizes the key ubiquitin linkage types, their structural characteristics, and primary cellular functions.
Table 1: Major Ubiquitin Linkage Types and Their Functions
| Linkage Type | Chain Architecture | Primary Cellular Functions | Key Recognition Proteins/Pathways |
|---|---|---|---|
| K48-linked | Homotypic or branched | Proteasomal degradation, cell cycle control | Proteasome, RAD23B, DDI2 [7] [8] |
| K63-linked | Homotypic or branched | NF-κB signaling, autophagy, DNA repair, protein trafficking | TAB2/3, EPN2, CCDC50 [7] [8] [9] |
| K48/K63-branched | Heterotypic branched | NF-κB signaling amplification, proteasomal degradation (context-dependent) | TAB2, HIP1, PARP10, UBR4 [7] [10] |
| K11-linked | Homotypic or branched | ER-associated degradation, cell cycle regulation | Proteasome, CDC50 [8] |
| M1-linked (linear) | Homotypic | NF-κB activation, inflammation | NEMO, HOIP [8] |
| K6-, K27-, K29-, K33-linked | Homotypic or branched | DNA damage response, immune signaling, kinase regulation (less characterized) | Various specialized UBPs [8] [14] |
K48-Linked Chains: The Classical Degradation Signal
K48-linked ubiquitin chains represent the most abundant linkage type in cells and serve as the primary signal for proteasomal degradation [7] [8]. The conventional understanding holds that proteins tagged with K48-linked chains containing at least four ubiquitin molecules (K48-Ub4) are recognized by the 26S proteasome, leading to their ATP-dependent degradation [7]. This pathway is essential for maintaining cellular homeostasis by controlling the turnover of regulatory proteins, eliminating misfolded proteins, and supporting cell cycle progression [7] [12]. Recent research has identified specific interactors that recognize K48-linked chains, including RAD23B and the ubiquitin-directed endoprotease DDI2, which exhibit preference for longer K48-linked chains (Ub3 over Ub2) [7]. The K48 linkage also participates in branched chain architectures, particularly in combination with K63 linkages, creating complex signals that can influence protein stability and function in ways distinct from homotypic K48 chains [7] [8] [10].
K63-Linked Chains: Multifunctional Non-degradative Signals
In contrast to K48-linked chains, K63-linked ubiquitin chains primarily mediate non-degradative functions across multiple cellular pathways [7] [8] [9]. These chains serve as scaffolds for the assembly of signaling complexes in the NF-κB and MAPK pathways, where they facilitate protein-protein interactions and kinase activation [7] [9]. In autophagy, K63 chains mark cargo proteins for lysosomal degradation through recognition by autophagy receptors [7]. They also play critical roles in DNA damage repair mechanisms, endocytic trafficking, and inflammatory responses [7] [8] [9]. The functional diversity of K63-linked chains is enabled by specialized receptors that recognize this linkage type, including TAB2 in the NF-κB pathway and EPN2 in protein trafficking [7]. Like K48 linkages, K63 chains can form branched architectures, expanding their signaling capabilities beyond homotypic chains [7] [8] [10].
Branched Ubiquitin Chains: Complex Signals with Unique Properties
Branched ubiquitin chains containing K48 and K63 linkages (K48/K63-branched Ub) represent a emerging area of research that reveals how combinations of linkage types can generate unique signaling outcomes [7] [8] [10]. These branched chains constitute approximately 20% of all K63 linkages in cells and exhibit functions distinct from their homotypic counterparts [7] [10]. For instance, during IL-1β signaling, the E3 ligase HUWE1 generates K48 branches on K63 chains assembled by TRAF6, creating K48/K63-branched chains that simultaneously promote NF-κB activation while protecting the K63 linkages from deubiquitination by CYLD [10]. This combination of K48 and K63 linkages creates a stabilized signaling platform that amplifies NF-κB responses [10]. In other contexts, such as during the apoptotic response, K48/K63-branched chains formed by collaboration between ITCH and UBR5 target the pro-apoptotic regulator TXNIP for proteasomal degradation [8]. These findings illustrate how branched chains can either enhance signaling or promote degradation depending on cellular context and the specific E3 ligases involved.
Ubiquitin Linkages in Cancer: Implications for Diagnosis and Therapy
Ubiquitylome Alterations in Cancer Progression
Comprehensive proteomic analyses have revealed significant alterations in ubiquitination patterns across multiple cancer types, highlighting the diagnostic and therapeutic potential of targeting ubiquitin signaling pathways [11] [15]. In hepatocellular carcinoma (HCC) cell lines with increasing metastatic potential, systematic ubiquitylome profiling identified 83 ubiquitinated proteins with steadily changing abundance according to metastatic potential [11]. These proteins participate in biological processes tightly associated with tumor metastasis, with ribosome and proteasome pathways significantly over-activated in highly metastatic cells [11]. Notably, Ku80 ubiquitination was significantly down-regulated in high-metastatic cells compared to low-metastatic cells, establishing a clear correlation between specific ubiquitination events and metastatic behavior [11].
Pan-cancer proteomic studies encompassing 16 major cancer types have identified both universally expressed proteins and cancer-type-specific proteins within the ubiquitin system, providing a resource for understanding how ubiquitination contributes to cancer-specific pathways [15]. These proteomic signatures not only advance our understanding of cancer biology but also facilitate the development of diagnostic and therapeutic targets [15]. The ability to analyze formalin-fixed paraffin-embedded (FFPE) tissue samples using advanced mass spectrometry has further enabled retrospective biomarker discovery, identifying ubiquitination-related proteins associated with therapeutic resistance in colorectal cancer [16].
USP39: A Ubiquitin System Component in Cancer Progression
The deubiquitinating enzyme USP39 exemplifies how components of the ubiquitin system contribute to cancer progression [13]. Although initially classified as an inactive ubiquitin-specific protease due to atypical catalytic residues, USP39 has demonstrated deubiquitination capabilities, stabilizing oncogenic proteins such as CHK2 and β-catenin by removing degradative ubiquitin chains [13]. USP39 is overexpressed in various cancers including hepatocellular, lung, gastric, breast, and ovarian carcinomas, where it promotes cell proliferation, invasion, metastasis, and drug resistance [13]. Beyond its deubiquitinating activity, USP39 functions as a splicing factor that affects the maturation of specific mRNAs, including those encoding oncogenic proteins such as EGFR and Aurora B [13]. This dual functionality enables USP39 to promote tumor development through both regulation of protein stability and control of gene expression, making it a promising therapeutic target [13].
Targeting Ubiquitin Pathways for Cancer Therapy
The therapeutic potential of targeting ubiquitin system components is increasingly recognized in cancer drug development [12] [9]. Several strategies have emerged, including small-molecule inhibitors targeting specific E3 ligases or DUBs, and novel approaches such as proteolysis-targeting chimeras (PROTACs) that hijack E3 ubiquitin ligases to selectively degrade target proteins [12] [9]. PROTACs are heterobifunctional molecules that simultaneously bind to a target protein and an E3 ligase, facilitating target ubiquitination and degradation via the proteasome [9]. This approach has been successfully applied to target previously "undruggable" proteins in cancer, including androgen receptor, estrogen receptor, BTK, and BCL2 [9]. The development of chain-specific TUBEs (Tandem Ubiquitin Binding Entities) with nanomolar affinities for specific polyubiquitin chains enables high-throughput screening of compounds that modulate linkage-specific ubiquitination, accelerating drug discovery in this area [9].
Experimental Protocols for Ubiquitin Linkage Analysis
Ubiquitin Interactor Pull-Down with Mass Spectrometry
Purpose: To identify linkage-specific ubiquitin-binding proteins (UBPs) and characterize their chain length preferences [7].
Workflow:
- Ubiquitin Chain Synthesis: Enzymatically synthesize native homotypic (K48 or K63) Ub2, Ub3, and heterotypic branched K48/K63 Ub3 chains using linkage-specific E2 enzymes (e.g., CDC34 for K48, Ubc13/Uev1a for K63, Ubc1 for K48-branching) [7].
- Immobilization: Add a serine/glycine linker with a single cysteine residue after the C-terminus of the proximal Ub. Conjugate biotin molecules using cysteine-maleimide chemistry and immobilize on streptavidin resin [7].
- Lysate Preparation: Prepare cell lysates (HeLa or yeast) in lysis buffer supplemented with deubiquitinase (DUB) inhibitors (chloroacetamide, CAA, or N-ethylmaleimide, NEM) to preserve chain integrity [7].
- Pulldown Experiment: Incubate immobilized ubiquitin chains with lysate. Wash extensively to remove non-specific binders [7].
- Protein Identification: Elute bound proteins and identify by liquid chromatography-mass spectrometry (LC-MS/MS) [7].
- Data Analysis: Statistically compare enrichment patterns across different chain types to identify linkage-specific, chain length-dependent, and branch-specific interactors [7].
Critical Considerations: The choice of DUB inhibitor significantly impacts results. NEM provides more complete chain stabilization but may have off-target effects on cysteine-containing proteins, while CAA is more cysteine-specific but allows partial chain disassembly [7]. Validation of identified interactors using complementary techniques such as surface plasmon resonance (SPR) is recommended [7].
TUBE-Based Analysis of Linkage-Specific Ubiquitination
Purpose: To investigate context-dependent linkage-specific ubiquitination of endogenous proteins in high-throughput format [9].
Workflow:
- Cell Stimulation/Treatment: Treat cells (e.g., THP-1 human monocytic cells) with stimuli that induce specific ubiquitination (e.g., L18-MDP for K63 ubiquitination of RIPK2) or PROTACs that induce K48 ubiquitination for degradation [9].
- Cell Lysis: Lyse cells in DUB-inhibiting buffer (e.g., 50 mM Tris-HCl pH 7.5, 0.15 M NaCl, 1% NP-40, 1 mM EDTA) supplemented with DUB inhibitors to preserve ubiquitination states [9].
- TUBE Enrichment: Incubate cell lysates with chain-specific TUBEs (K48-TUBE, K63-TUBE, or pan-TUBE) conjugated to magnetic beads [9].
- Target Detection: Wash beads extensively, elute bound proteins, and detect specific ubiquitinated targets by immunoblotting with target-specific antibodies [9].
- Quantification: Quantify signals to compare linkage-specific ubiquitination under different conditions [9].
Applications: This protocol enables rapid assessment of PROTAC efficiency and specificity, evaluation of inflammatory signaling activation, and screening for compounds that modulate specific ubiquitination events [9].
Di-Gly Antibody-Based Ubiquitylome Profiling
Purpose: To comprehensively profile ubiquitination sites and identify alterations in cancer tissues or cell lines [11] [14].
Workflow:
- Sample Preparation: Extract proteins from tissues or cells. For FFPE tissues, use extended lysis with high concentrations of urea and SDS, followed by multiple heating and sonication steps [16].
- Protein Digestion: Digest proteins with trypsin/Lys-C mix to generate peptides [11] [16].
- Di-Gly Peptide Enrichment: Incubate peptides with anti-di-glycine remnant antibody-conjugated beads to specifically enrich ubiquitinated peptides [11].
- LC-MS/MS Analysis: Analyze enriched peptides using liquid chromatography coupled to tandem mass spectrometry [11].
- Data Analysis: Identify ubiquitination sites by detecting the di-glycine remnant signature (114.04 Da mass shift on modified lysine residues) and quantify differences between sample groups [11] [14].
Applications: This approach has been successfully used to identify ubiquitination patterns associated with cancer metastasis and therapeutic response, enabling biomarker discovery from clinical specimens [11] [16].
Visualization of K48/K63-Branched Ubiquitin in NF-κB Signaling
The following diagram illustrates how K48/K63-branched ubiquitin chains regulate NF-κB signaling through collaboration between K63-linked chain assembly and K48-specific branching events, protecting the signal from deubiquitination.
Figure 1: K48/K63-Branched Ubiquitin Chain Regulation of NF-κB Signaling
Table 2: Essential Research Tools for Ubiquitin Linkage Analysis
| Tool/Reagent | Specific Examples | Function/Application | Considerations |
|---|---|---|---|
| Linkage-Specific TUBEs | K48-TUBE, K63-TUBE, Pan-TUBE [9] | High-affinity capture of linkage-specific ubiquitinated proteins from native cell lysates | Enables high-throughput screening; preserves native ubiquitination states |
| DUB Inhibitors | Chloroacetamide (CAA), N-ethylmaleimide (NEM) [7] | Prevent deubiquitination during lysis and purification | NEM more potent but has off-target effects; CAA more cysteine-specific |
| Linkage-Specific Antibodies | K48-linkage specific, K63-linkage specific [14] | Immunoblotting and immunofluorescence detection of specific chain types | Variable specificity between commercial sources requires validation |
| Tagged Ubiquitin Variants | His-tagged Ub, Strep-tagged Ub, HA-tagged Ub [14] | Affinity purification of ubiquitinated proteins from cell lysates | May not perfectly mimic endogenous ubiquitin; potential for artifacts |
| Activity-Based Probes | Ub-VS, Ub-AMC, Linkage-specific DUB probes [14] | Profiling DUB activity and specificity | Can distinguish functional DUB activities in complex mixtures |
| Branched Ubiquitin Chains | K48/K63-branched Ub3, K11/K48-branched chains [7] [8] | Study of branched chain recognition and function | Require complex enzymatic synthesis; structural validation essential |
The complexity of the ubiquitin code extends far beyond the simple dichotomy of K48-mediated degradation versus K63-mediated signaling. The emerging understanding of branched ubiquitin chains and their unique functions reveals how combinations of linkage types can create signaling outputs not achievable by homotypic chains alone [7] [8] [10]. In cancer biology, comprehensive ubiquitylome analyses have demonstrated that specific ubiquitination patterns correlate with disease progression, metastatic potential, and therapeutic response [11] [15] [16]. The continued development of sophisticated tools for ubiquitin research—including chain-specific TUBEs, improved DUB inhibitors, and advanced mass spectrometry methods—is enabling increasingly precise dissection of ubiquitin linkage functions in both physiological and pathological contexts [9] [14]. As our understanding of ubiquitin linkage diversity grows, so too does the potential for developing targeted therapies that exploit specific ubiquitin signals, such as PROTACs for targeted protein degradation and DUB inhibitors for modulating ubiquitin-dependent signaling pathways in cancer and other diseases [12] [13] [9].
Protein ubiquitination is an evolutionarily conserved post-translational modification that regulates diverse cellular functions, primarily through targeting substrate proteins for proteasomal degradation [17]. The ubiquitin-proteasome system consists of numerous enzymes, including ubiquitin ligases and deubiquitinases (DUBs), which regulate intracellular processes such as cell cycle progression, selective autophagy, and response to growth factors [18]. Dysregulation of this system contributes to loss of cell cycle control and carcinogenesis, making ubiquitylomics—the system-wide study of ubiquitinated proteins—essential for understanding cancer mechanisms and identifying therapeutic targets [18] [17].
Mass spectrometry-based ubiquitinomics provides a system-level understanding of ubiquitin signaling, enabling researchers to profile thousands of ubiquitination events simultaneously [18]. This approach is particularly valuable for comparing cancerous and normal tissues, as it can reveal disease-specific ubiquitination signatures and identify novel drug targets. In oncology research, ubiquitylomics facilitates rapid mode-of-action profiling of candidate drugs targeting DUBs or ubiquitin ligases with high precision and throughput [18].
Key Methodological Advances in Ubiquitylomics
Optimized Sample Preparation for Deep Ubiquitinome Coverage
Sample preparation is critical for comprehensive ubiquitinome profiling. Traditional urea-based lysis buffers have been superseded by sodium deoxycholate-based protocols that significantly improve ubiquitin site coverage. This optimized lysis method, when supplemented with chloroacetamide for immediate cysteine protease inactivation, yields approximately 38% more K-ε-GG remnant peptides compared to conventional urea buffer [18]. This enhancement occurs without compromising enrichment specificity, simultaneously improving both quantification precision and reproducibility across experimental replicates.
The protein input amount dramatically affects identification numbers in ubiquitylomics studies. Experimental data demonstrates that 2 mg of protein input typically yields approximately 30,000 identifiable K-ε-GG peptides, while inputs of 500 µg or less result in identification numbers dropping below 20,000 peptides [18]. This relationship underscores the importance of sufficient starting material for achieving deep ubiquitinome coverage, particularly when studying subtle ubiquitination changes between cancerous and normal tissues.
Table 1: Comparison of Lysis Buffer Performance in Ubiquitylomics
| Parameter | SDC-Based Lysis | Urea-Based Lysis |
|---|---|---|
| Average K-ε-GG Peptide Identification | 26,756 | 19,403 |
| Enrichment Specificity | High | High |
| Reproducibility (CV < 20%) | Significantly Improved | Standard |
| Recommended Protein Input | 2 mg | 2 mg |
| Cysteine Protease Inactivation | Immediate with CAA | Less effective |
Data-Independent Acquisition Mass Spectrometry
Data-independent acquisition mass spectrometry represents a transformative advancement over traditional data-dependent acquisition methods for ubiquitylomics. While DDA typically identifies approximately 21,434 K-ε-GG peptides per sample, DIA more than triples this coverage to over 68,429 peptides in single MS runs [18]. This dramatic improvement stems from DIA's comprehensive fragmentation of all eluting peptides within sequential isolation windows, eliminating the semi-stochastic sampling inherent to DDA.
The quantitative precision of DIA-based ubiquitylomics significantly exceeds DDA performance, with median coefficients of variation below 10% for quantified K-ε-GG peptides [18]. This enhanced reproducibility is particularly valuable for cancer versus normal tissue studies, where robust quantification is essential for identifying genuine ubiquitination differences amid biological variability. When coupled with deep neural network-based processing tools like DIA-NN, which includes specialized scoring modules for modified peptides, identification confidence for K-ε-GG peptides matches or exceeds that achieved with DDA workflows [18].
Table 2: Performance Comparison of MS Acquisition Methods in Ubiquitylomics
| Performance Metric | DIA-MS | DDA-MS |
|---|---|---|
| Average K-ε-GG Peptides Identified | 68,429 | 21,434 |
| Median Quantitative CV | <10% | >20% |
| Missing Values in Replicates | Minimal | Substantial (~50%) |
| Required Spectral Library | Optional (library-free mode available) | Mandatory |
| Compatibility with Neural Network Processing | Excellent (DIA-NN) | Limited |
Experimental Protocol for Ubiquitylomics Profiling in Cancer Research
Sample Preparation and Protein Extraction
Tissue Collection and Preservation: Snap-freeze freshly excised cancerous and matched normal tissues in liquid nitrogen. Store at -80°C until processing. For cancers without available adjacent normal tissues, consult resources like the GTEx project for reference normal samples [19].
Protein Extraction with SDC Buffer: Homogenize tissue samples in SDC lysis buffer (1% sodium deoxycholate, 100 mM Tris-HCl pH 8.5, 10 mM TCEP, 40 mM chloroacetamide) using a mechanical homogenizer. Immediate addition of chloroacetamide is crucial for rapid inactivation of cysteine ubiquitin proteases [18].
Protein Digestion: Digest proteins with Lys-C (1:100 enzyme-to-protein ratio) for 3 hours at 30°C, followed by trypsin digestion (1:100 ratio) overnight at 37°C. Acidify with trifluoroacetic acid to precipitate SDC, then centrifuge to remove the precipitate.
K-ε-GG Peptide Enrichment: Use anti-K-ε-GG antibody-conjugated beads for immunoaffinity purification. Incubate digested peptides with antibody beads for 2 hours at 4°C with gentle rotation. Wash beads thoroughly before peptide elution with 0.1% trifluoroacetic acid.
Liquid Chromatography and Mass Spectrometry Analysis
Chromatographic Separation: Desalt enriched K-ε-GG peptides using C18 stage tips and separate with nanoflow liquid chromatography employing a 75-minute linear gradient from 2% to 30% acetonitrile in 0.1% formic acid [18].
DIA-MS Acquisition: Utilize a Q-Exactive HF-X or similar mass spectrometer with optimized DIA methods. Fragment ions using higher-energy collisional dissociation with normalized collision energy of 27-30%. Set MS1 resolution to 120,000 with an m/z range of 350-1650, and MS2 resolution to 30,000 [18].
Data Processing: Process raw files using DIA-NN software in "library-free" mode against the human UniProt database. Enable the neural network-based scoring for K-ε-GG peptides and set the false discovery rate to 1% at both peptide and protein levels [18].
Data Analysis and Normal Tissue Selection Strategy
For cancers lacking matched normal tissues, implement a computational strategy to select appropriate reference samples from databases like GTEx. Employ autoencoder neural networks to create reduced features for similarity measurement between cancer samples and potential normal references [19]. This approach correctly predicts tissue of origin for 12 of 14 cancers and ensures that disease signatures derived from GTEx normal samples show strong consistency with those derived from adjacent samples in TCGA [19].
Differential expression analysis between tumor and selected normal tissues should be performed using tools like edgeR, with significance thresholds set at absolute log fold change >1 and adjusted p-value <0.001 [19]. For signature validation, assess consistency based on overlapping gene significance and correlation of fold changes between TCGA-derived and GTEx-derived disease signatures.
Research Reagent Solutions for Ubiquitylomics
Table 3: Essential Research Reagents for Ubiquitylomics Studies
| Reagent/Material | Function | Application Notes |
|---|---|---|
| Anti-K-ε-GG Antibody Beads | Immunoaffinity purification of ubiquitinated peptides | Critical for enriching low-abundance ubiquitinated peptides from complex digests |
| Sodium Deoxycholate (SDC) | Lysis buffer detergent | Superior to urea for ubiquitinome coverage; prevents di-carbamidomethylation artifacts |
| Chloroacetamide (CAA) | Cysteine alkylating agent | Rapidly inactivates DUBs during lysis; preferred over iodoacetamide |
| Recombinant Lys-C/Trypsin | Proteolytic enzymes | Generate K-ε-GG remnant peptides with C-terminal diglycine motif |
| DIA-NN Software | Data processing | Deep neural network-based analysis specifically optimized for ubiquitinomics data |
| USP7 Inhibitors | DUB targeting compounds | Enable studies of ubiquitination dynamics and substrate identification |
Application in Cancer Biology: USP7 Target Profiling
The power of advanced ubiquitylomics is exemplified in comprehensive mapping of substrates for deubiquitinase USP7, an actively investigated anticancer drug target [18]. Following USP7 inhibition, simultaneous monitoring of ubiquitination changes and corresponding protein abundance alterations at high temporal resolution reveals that while ubiquitination of hundreds of proteins increases within minutes, only a small fraction of those targets undergo degradation [18]. This critical distinction helps dissect the scope of USP7 action, separating regulatory ubiquitination events from those leading to proteasomal degradation.
In specific cancer types like oral adenoid cystic carcinoma, ubiquitylomics profiling has identified 4,152 ubiquitination sites across 1,993 proteins, revealing potential biomarkers and therapeutic targets [17]. Systematic bioinformatics analysis of differentially modified proteins between tumor and adjacent normal tissues provides important references for developing targeted therapies for this rare salivary gland tumor with poor prognosis [17].
Advanced ubiquitylomics workflows combining optimized sample preparation, DIA-MS, and sophisticated computational analysis now enable unprecedented insights into ubiquitin signaling dynamics in cancer. The ability to distinguish degradative from non-degradative ubiquitination events provides a more nuanced understanding of cancer mechanisms and reveals novel therapeutic opportunities. As these methodologies continue to evolve, ubiquitylomics will play an increasingly central role in cancer drug development, particularly for targeted protein degradation therapies and DUB inhibitor programs.
The commercialization of antibodies specifically recognizing the lysine-ε-glycine-glycine (K-ε-GG) remnant has fundamentally transformed the proteomic landscape of ubiquitination research [20]. This methodology capitalizes on a fundamental biochemical event: when trypsin digests ubiquitinated proteins, it cleaves after the arginine residue at position 74 of ubiquitin, leaving a characteristic diGly remnant attached via an isopeptide bond to the modified lysine residue on the substrate peptide [21]. This diGly signature serves as a universal handle for enriching low-abundance ubiquitination sites from complex proteomic digests.
Prior to the development of these highly specific antibodies, proteomics studies were limited to identifying only several hundred ubiquitination sites, severely constraining the scope of biological investigations [20]. The advent of K-ε-GG immunoenrichment has enabled researchers to identify >50,000 ubiquitylation sites in human cells, providing unprecedented insights into the breadth and regulatory complexity of the ubiquitin system [21]. This approach has become an indispensable tool for systematically interrogating protein ubiquitylation with site-level resolution, revealing dynamic changes in ubiquitination in response to cellular stimuli, stressors, and in disease pathologies such as cancer [21] [22].
It is critical to note that while this method primarily captures ubiquitination events, the C-terminal sequences of ubiquitin-like proteins (NEDD8 and ISG15) also generate identical diGly remnants upon trypsinolysis [21]. However, methodological studies have demonstrated that approximately 95% of all diGly-peptides identified using this enrichment approach arise from genuine ubiquitination events rather than neddylation or ISGylation [21].
Table 1: Key Characteristics of the DiGly Remnant Enrichment Technology
| Aspect | Technical Specification | Functional Impact |
|---|---|---|
| Target Epitope | K-ε-GG remnant after trypsin digestion [21] | Enables specific enrichment of ubiquitinated peptides from complex mixtures |
| Coverage | >50,000 ubiquitination sites identifiable in human cells [21] | Provides systems-level view of ubiquitination landscape |
| Specificity | ~95% of enriched peptides derive from ubiquitin (vs. NEDD8/ISG15) [21] | Ensures biological relevance of identified modifications |
| Quantitative Capability | Compatible with SILAC, TMT, and label-free quantification [20] [22] [23] | Enables dynamic tracking of ubiquitination changes |
| Sample Compatibility | Cell lines, primary tissues, and in vivo models [21] [22] | Facilitates translation from basic research to clinical applications |
Optimized Experimental Workflow and Protocols
Sample Preparation and Lysis Considerations
Proper sample preparation is paramount for preserving the endogenous ubiquitination landscape, given the transient nature of many ubiquitination events and the rapid activity of deubiquitinating enzymes (DUBs). Effective lysis requires denaturing conditions to inactivate DUBs and proteases immediately upon cell disruption [24].
A recommended lysis buffer consists of:
- 8 M Urea or other strong denaturant [20] [21]
- 50 mM Tris-HCl, pH 7.5-8.0 [20] [21]
- 150 mM NaCl [20] [21]
- Protease and DUB inhibitors (e.g., 5 mM N-Ethylmaleimide/NEM, 50 μM PR-619) [20] [21] [24]
- Phosphatase inhibitors (e.g., 1 mM NaF, 1 mM β-glycerophosphate) when studying crosstalk with phosphorylation [21]
For cancer tissue samples, as used in OACC research, samples should be snap-frozen and powdered under liquid nitrogen before adding lysis buffer [22]. Including proteasome inhibitors (e.g., MG-132) can stabilize ubiquitination events targeting proteins for degradation, but requires caution due to potential compensatory effects and toxicity in vivo [23] [24].
Protein Digestion and Pre-Fractionation
Following reduction and alkylation, proteins are digested using trypsin, which generates the diagnostic diGly remnant. A two-step enzymatic digestion is often beneficial:
To achieve deep ubiquitinome coverage, offline high-pH reverse-phase fractionation is recommended prior to diGly enrichment. This reduces sample complexity and minimizes interference from highly abundant non-modified peptides [20] [25]. A typical workflow involves separating peptides using a basic reversed-phase (bRP) column with ammonium formate (pH 10) and acetonitrile gradients, followed by non-contiguous pooling of fractions to maximize efficiency [20]. For instance, pooling fractions 1, 9, 17, etc., into eight final pooled fractions significantly enhances identifications without increasing MS instrument time [20].
DiGly Peptide Immunoenrichment
The core enrichment process utilizes cross-linked antibody beads to capture diGly-modified peptides:
Diagram: DiGly Peptide Immunoenrichment Workflow
Critical parameters for optimal enrichment:
- Antibody cross-linking using dimethyl pimelimidate (DMP) prevents antibody leaching and improves specificity [20]
- Input optimization: ~1 mg peptide material with 31.25 μg antibody provides excellent yield [23]
- Incubation conditions: 1-2 hours at 4°C with rotation in IAP buffer (50 mM MOPS, pH 7.2, 10 mM sodium phosphate, 50 mM NaCl) [20]
- Stringent washing with ice-cold PBS to remove non-specifically bound peptides [20] [25]
- Gentle elution with 0.15% TFA to preserve peptide integrity [20]
Mass Spectrometry Analysis and Acquisition Strategies
Recent advances in mass spectrometry have significantly enhanced diGly peptide detection. Data-Independent Acquisition (DIA) methods have demonstrated particular advantages for ubiquitinome analysis, identifying approximately 35,000 distinct diGly peptides in single measurements—nearly double the identification rate of traditional Data-Dependent Acquisition (DDA) methods [23].
Key MS parameter considerations:
- Optimized DIA window schemes tailored to diGly precursor characteristics [23]
- High MS2 resolution (30,000) for improved specificity [23]
- LC gradient optimization: 60-120 minute gradients depending on depth requirements [22] [23]
- Spectral libraries: Comprehensive libraries (>90,000 diGly peptides) enable robust DIA analysis [23]
Quantitative Profiling in Cancer Research
The application of diGly proteomics to cancer research has revealed profound alterations in ubiquitination networks between tumor and normal tissues. In adenoid cystic carcinoma (OACC), quantitative ubiquitylomics identified 4,152 ubiquitination sites on 1,993 proteins, with 1648 sites on 859 proteins quantifiable between tumor and adjacent normal tissues [22]. This analysis revealed 555 significantly up-regulated ubiquitination sites in 385 proteins and 112 down-regulated sites in 95 proteins in OACC tumors [22].
Table 2: Quantitative DiGly Proteomics Applications in Cancer Models
| Study Model | Quantitative Approach | Key Findings | Technical Insights |
|---|---|---|---|
| Oral Adenoid Cystic Carcinoma (OACC) [22] | 4D-label-free quantification | 4152 ubiquitination sites identified; 555 up-regulated and 112 down-regulated sites in tumors | Applied to clinical tissue samples; requires appropriate normalization strategies |
| TNF Signaling Pathway [23] | DIA with SILAC labeling | Comprehensive capture of known and novel ubiquitination sites in signaling networks | DIA provides superior data completeness and quantitative accuracy for signaling studies |
| E3 Ligase Substrate Identification [26] | SILAC with inducible RNAi | Identification of DDIT4 as novel substrate for HUWE1 E3 ligase | Combines genetic perturbation with diGly proteomics for substrate discovery |
| Circadian Biology [23] | DIA with label-free quantification | Hundreds of cycling ubiquitination sites discovered on membrane receptors and transporters | Reveals dynamic regulation of ubiquitination across time courses |
The integration of diGly proteomics with functional bioinformatics enables systems-level interpretation of cancer-related ubiquitination changes. This includes:
- Pathway enrichment analysis of differentially ubiquitinated proteins [22]
- Protein interaction network mapping to identify coordinated regulatory modules [22]
- Motif analysis to identify sequence preferences around cancer-associated ubiquitination sites [22]
- Crosstalk analysis with other PTMs (e.g., phosphorylation, acetylation) that may compete for the same lysine residues [23]
The Scientist's Toolkit: Essential Research Reagents
Table 3: Key Research Reagent Solutions for DiGly Proteomics
| Reagent / Tool | Function | Application Notes |
|---|---|---|
| Anti-K-ε-GG Antibody (Cell Signaling Technology) [20] [21] | Immunoaffinity enrichment of diGly-modified peptides | Core reagent; cross-linking recommended to prevent antibody leaching |
| DUB Inhibitors (PR-619, NEM) [20] [21] [24] | Preserve endogenous ubiquitination by inhibiting deubiquitinases | Essential in lysis buffers; concentration must be sufficient for complete inhibition |
| Proteasome Inhibitors (MG-132, Bortezomib) [20] [23] | Stabilize ubiquitinated proteins targeted for degradation | Use with caution due to potential compensatory pathways and toxicity |
| Stable Isotope Labels (SILAC amino acids) [20] [21] | Enable accurate quantification of ubiquitination dynamics | Heavy Lys8 and Arg10 recommended for minimal label incorporation errors |
| Basic Reverse-Phase Chromatography | Pre-fractionation to reduce sample complexity | Significant improvement in depth of coverage; non-contiguous pooling recommended |
| Tandem Ubiquitin Binding Entities (TUBEs) [14] [24] | Alternative enrichment of ubiquitinated proteins | Useful for protein-level enrichment; does not provide site-specific information |
| Linkage-Specific Ubiquitin Antibodies [14] | Detection of specific polyubiquitin chain types | Limited to known linkage types; commercial availability varies |
The development of K-ε-GG antibodies and optimized diGly remnant enrichment protocols represents a transformative advancement in ubiquitin research, enabling unprecedented characterization of the ubiquitinome in cancer and other disease contexts. The continued refinement of these methodologies—including enhanced fractionation strategies, antibody cross-linking techniques, and advanced mass spectrometry acquisition methods—has progressively increased the depth and quantitative accuracy of ubiquitination site mapping. When applied to cancer research, these approaches reveal extensive rewiring of ubiquitination networks in tumors, offering new insights into cancer mechanisms and potential therapeutic targets. As these technologies continue to evolve and integrate with complementary proteomic approaches, they promise to further illuminate the complex landscape of ubiquitin signaling in health and disease.
Ubiquitination, a fundamental post-translational modification, governs nearly all cellular processes in eukaryotic cells, including protein degradation, cell cycle progression, DNA repair, and immune responses [27] [28]. The ubiquitin-proteasome system (UPS) mediates approximately 80-90% of intracellular protein degradation, making it a critical regulator of cellular homeostasis [27]. This enzymatic cascade involves three key components: ubiquitin-activating enzymes (E1), ubiquitin-conjugating enzymes (E2), and ubiquitin ligases (E3), which work in concert to attach ubiquitin molecules to substrate proteins, targeting them for proteasomal degradation or functional modification [29] [27]. The reverse process, deubiquitination, is mediated by deubiquitinating enzymes (DUBs) that remove ubiquitin chains from substrates [29] [27].
Mounting evidence from multi-cancer studies demonstrates that dysregulation of ubiquitination pathways is a hallmark of cancer pathogenesis [27] [28]. Genetic alterations, expression perturbations, and functional abnormalities in ubiquitination regulators (UBRs) have been identified across diverse cancer types, contributing to tumor initiation, progression, metabolic reprogramming, immune evasion, and therapeutic resistance [27] [28] [30]. This application note synthesizes evidence from recent pan-cancer analyses to elucidate the critical roles of ubiquitination dysregulation in cancer and provides detailed protocols for investigating ubiquitination-related mechanisms in cancer research.
Results
Expression Perturbations of Ubiquitination Regulators in Pan-Cancer
Comprehensive analysis of UBRs across multiple cancer types has revealed widespread expression perturbations affecting E1, E2, E3 enzymes, and DUBs. Systematic characterization of 877 human UBRs demonstrated heterogeneous expression patterns across tissues, with the testis showing the most distinct pattern [28]. In malignant tissues, these expression perturbations have profound functional consequences.
Table 1: Pan-Cancer Expression Patterns of Key Ubiquitination Regulators
| Ubiquitination Regulator | Cancer Types with Overexpression | Functional Consequences | Prognostic Impact |
|---|---|---|---|
| UBA1 (E1 enzyme) | BRCA, COAD, KIRC, LUAD [31] | Promotes tumor proliferation, associated with poor prognosis [31] | Shorter overall survival in multiple cancers [31] |
| UBA6 (E1 enzyme) | BRCA, COAD, KIRC, LUAD [31] | Regulates immune response, linked to cancer stage [31] | Correlated with unfavorable prognosis [31] |
| UBD/FAT10 (Ubiquitin-like protein) | 29 cancer types including GBM, COAD, LIHC, BRCA [32] | Induces chromosomal instability, activates NF-κB, Wnt signaling [32] | Reduced overall survival in amplified cases [32] |
| UBE2T (E2 enzyme) | Hepatocellular carcinoma [27] | Regulates γH2AX monoubiquitination, enhances radioresistance [27] | Contributes to treatment resistance [27] |
| FBXO45 (E3 ligase) | Ovarian cancer [33] | Promotes growth via Wnt/β-catenin pathway [33] | Independent prognostic factor [33] |
A notable example is UBD (Ubiquitin D), which shows overexpression in 29 cancer types and is linked to poor prognosis and higher histological grades [32]. Genetic alterations, particularly gene amplifications, are common in UBD, and patients with these alterations exhibit significantly reduced overall survival rates [32]. Epigenetically, reduced UBD promoter methylation has been observed in 16 cancer types, suggesting a potential mechanism for its overexpression [32].
Ubiquitination-Related Prognostic Models Across Cancers
The development of ubiquitination-related prognostic signatures has demonstrated remarkable utility in stratifying cancer patients across multiple tumor types.
In ovarian cancer, a 17-gene ubiquitination-related prognostic model effectively stratified patients into high-risk and low-risk groups with significantly different overall survival (1-year AUC = 0.703, 3-year AUC = 0.705, 5-year AUC = 0.705) [33]. The high-risk group showed markedly lower overall survival (P < 0.05), and immune analysis revealed higher levels of CD8+ T cells (P < 0.05), M1 macrophages (P < 0.01), and follicular helper T cells (P < 0.05) in the low-risk group [33]. High-risk patients had more mutations in MUC17 and LRRK2, while low-risk patients had more RYR2 mutations [33].
Similarly, in lung adenocarcinoma (LUAD), a risk model based on nine ubiquitination-related genes (B4GALT4, DNAJB4, GORAB, HEATR1, LPGAT1, FAT1, GAB2, MTMR4, and TCP11L2) effectively classified patients into low-risk and high-risk groups [34]. Low-risk patients had significantly better overall survival than those in the high-risk group, and substantial differences in immune cell infiltration were observed between the two groups [34].
A pan-cancer ubiquitination-related prognostic signature (URPS) developed from 4,709 patients across 26 cohorts and five solid tumor types (lung cancer, esophageal cancer, cervical cancer, urothelial cancer, and melanoma) effectively stratified patients into high-risk and low-risk groups with distinct survival outcomes across all analyzed cancers [30]. This signature also served as a novel biomarker for predicting immunotherapy response, with potential to identify patients more likely to benefit from immunotherapy in clinical settings [30].
Ubiquitination in Cancer Immune Regulation
Ubiquitination plays a crucial role in regulating tumor immune microenvironment components and immune checkpoint expression. UBD expression shows significant correlations with tumor microenvironment features, including immune infiltration, checkpoints, microsatellite instability (MSI), tumor mutational burden (TMB), and neoantigens (NEO) [32].
Table 2: Ubiquitination-Mediated Regulation of Immune Checkpoints in Cancer
| Immune Checkpoint | Ubiquitination Regulator | Mechanism of Action | Cancer Type |
|---|---|---|---|
| PD-L1 | MTSS1/AIP4 complex [27] | Promotes monoubiquitination at K263, leading to internalization and lysosomal degradation [27] | Lung adenocarcinoma |
| PD-1 | USP2 [27] | Stabilizes PD-1 through deubiquitination, promoting tumor immune escape [27] | Multiple cancers |
| PD-L1 | UBD/FAT10 [32] | Upregulates PD-L1 expression, fostering immunosuppressive microenvironment [32] | Hepatocellular carcinoma |
The correlation between UBR expression and immune cell infiltration has been extensively documented. For instance, UBA1 and UBA6 expression shows close ties with immune scores, immune subtypes, and tumor-infiltrating immune cells across various cancer types [31]. In ovarian cancer, the ubiquitination-related prognostic model revealed distinct immune infiltration patterns between risk groups, with low-risk patients exhibiting significantly higher levels of CD8+ T cells, M1 macrophages, and follicular helper T cells [33].
Ubiquitination in Metabolic Reprogramming
Cancer cells undergo metabolic reprogramming to support rapid growth and proliferation, and ubiquitination plays a crucial regulatory role in this process. Key enzymes in lipid metabolism are particularly regulated by ubiquitination.
Table 3: Ubiquitination Regulation of Lipid Metabolism Enzymes in Cancer
| Metabolic Enzyme | Ubiquitination Regulator | Mechanism | Cancer Type |
|---|---|---|---|
| ACLY | NEDD4 [29] | E3 ligase NEDD4 binds to ACLY, promoting its ubiquitination and degradation [29] | Lung cancer |
| ACLY | UBR4 [29] | Reduced binding with acetylated ACLY decreases ubiquitination, enhancing stability [29] | Lung cancer |
| ACLY | CUL3-KLHL25 complex [29] | Ubiquitinates and degrades ACLY, inhibiting lipid synthesis [29] | Lung cancer |
| FASN | COP1/Shp2 complex [29] | Forms FASN-Shp2-COP1 complex, mediating ubiquitination and degradation [29] | Liver cancer |
| FASN | TRIM21 [29] | HDAC3 deacetylates FASN, enhancing TRIM21 binding and ubiquitination [29] | Multiple cancers |
| FASN | SPOP [29] | E3 ligase reduces FASN expression and fatty acid synthesis [29] | Prostate cancer |
The regulation of metabolic enzymes by ubiquitination represents a critical interface between metabolic reprogramming and oncogenic signaling. For instance, the E3 ligase Parkin facilitates the ubiquitination of pyruvate kinase M2 (PKM2), while the deubiquitinase OTUB2 interacts with PKM2 to inhibit its ubiquitination by Parkin, thereby enhancing glycolysis and accelerating colorectal cancer progression [27].
Discussion
Therapeutic Implications and Emerging Strategies
The comprehensive understanding of ubiquitination dysregulation in cancer has paved the way for novel therapeutic strategies. Several approaches have shown promising results:
PROTACs (Proteolysis Targeting Chimeras) represent a breakthrough technology that leverages the ubiquitin-proteasome system to target specific proteins for degradation. ARV-110 (bavdegalutamide) and ARV-471 (vepdegestrant) are pioneering PROTAC drugs that have progressed to phase II clinical trials [27]. ARV-110 is designed to selectively target and bind to the androgen receptor (AR), facilitating its degradation by recruiting an E3 ubiquitin ligase, showing promising results in metastatic castration-resistant prostate cancer [27].
Molecular Glues offer another innovative approach. CC-90009 facilitates the ubiquitination-mediated degradation of G1-to-S phase transition 1 (GSPT1) by recruiting the E3 ligase complex CUL4-DDB1-CRBN-RBX1 (CRL4CRBN) and is in phase II clinical trials for leukemia therapy [27]. Compared to PROTACs, molecular glues have smaller molecular dimensions, simplifying the optimization of their chemical characteristics [27].
Targeting Specific UBRs has shown therapeutic potential. For instance, LCL161, an IAP inhibitor, induces TNF-dependent apoptosis in multiple myeloma cells and enhances the anti-tumor immune response [29]. The small molecule inhibitor SIM0501, which targets USP1, has FDA clinical approval and is planned for trials in advanced solid tumors [29].
Future Perspectives
The integration of multi-omics data continues to reveal the complexity of ubiquitination networks in cancer pathogenesis. Future research directions should focus on:
Comprehensive Ubiquitinome Mapping: Systematic characterization of ubiquitination patterns across cancer types and stages will provide deeper insights into the dynamic regulation of oncogenic pathways.
Single-Cell Ubiquitination Analysis: Advancements in single-cell technologies will enable the exploration of ubiquitination heterogeneity within tumor ecosystems, potentially revealing novel cell-type-specific therapeutic targets.
Ubiquitination-Based Biomarker Development: The development of standardized ubiquitination-related prognostic signatures across cancer types could revolutionize patient stratification and treatment selection.
Combination Therapies: Strategic combinations of ubiquitination-targeting agents with conventional therapies, targeted therapies, and immunotherapies may overcome resistance mechanisms and improve clinical outcomes.
Methods
Pan-Cancer Analysis of Ubiquitination Regulators
Data Collection and Processing
Data Sources: Collect transcriptomic data from public repositories including The Cancer Genome Atlas (TCGA), Genotype-Tissue Expression (GTEx) project, and Gene Expression Omnibus (GEO) [31] [28] [34]. For comprehensive analysis, include data from at least 33 cancer types covering major anatomical sites [28].
UBR Gene Set Curation: Compile a comprehensive list of ubiquitination regulators from specialized databases such as UUCD (http://uucd.biocuckoo.org/) [33] [28]. The standard UBR set should include E1 activating enzymes (8 genes), E2 conjugating enzymes (39 genes), E3 ligases (882 genes), and deubiquitinating enzymes (DUBs) [33].
Data Normalization: Process raw RNA-seq data using standardized pipelines. Convert counts to reads per million mapped (FPKM) format and apply log2 transformation to normalize expression distributions [34]. For microarray data, perform background correction, quantile normalization, and probe summarization using the "limma" R package [34].
Differential Expression Analysis
Expression Comparison: Use the Wilcoxon rank sum test to identify differentially expressed UBRs between tumor and normal tissues [28] [34]. Apply multiple testing correction using the Benjamini-Hochberg method to control false discovery rate.
Inclusion Criteria: Define significant differential expression using thresholds of |logFC| ≥ 1 (fold change ≥ 2) and adjusted p-value < 0.01 [28]. For studies with limited normal samples, include cancer types with at least ten normal samples to ensure statistical reliability [28].
Validation: Verify protein-level expression differences using the Human Protein Atlas (HPA) database for immunohistochemical staining patterns in normal and cancer tissues [31].
Survival Analysis
Prognostic Assessment: Evaluate the association between UBR expression and patient survival using overall survival (OS) and disease-specific survival (DSS) as endpoints [32].
Statistical Methods: Perform univariate Cox regression analysis to identify UBRs with significant prognostic value [33] [28]. For multivariate analysis, include clinical parameters such as age, stage, and grade as covariates.
Stratification: Divide patients into high-expression and low-expression groups based on median expression or optimal cut-off values determined by maximally selected rank statistics [32]. Generate Kaplan-Meier survival curves and compare using log-rank tests.
Construction of Ubiquitination-Related Prognostic Models
Feature Selection
Preliminary Screening: Perform univariate Cox regression analysis on ubiquitination-related genes to identify candidates with significant prognostic association (p < 0.05) [33] [34].
Regularization: Apply LASSO (Least Absolute Shrinkage and Selection Operator) Cox regression to prevent overfitting and select the most informative genes for the prognostic model [33] [34]. Use 10-fold cross-validation to determine the optimal penalty parameter λ.
Final Gene Selection: Further refine the gene set using the DEVIANCE test with selection criteria of |logFC| ≥ 1 and adjusted p-values < 0.05 [33].
Risk Score Calculation
Formula Application: Calculate risk scores for each patient using the formula: Risk score = Σ(Coefi × Expri), where Coefi represents the regression coefficient from multivariate Cox analysis, and Expri represents the expression level of each selected gene [33].
Patient Stratification: Classify patients into high-risk and low-risk groups based on the median risk score or optimal cut-off value determined by survival analysis [33] [34].
Model Validation: Assess model performance using time-dependent receiver operating characteristic (ROC) curves at 1, 3, and 5 years [33]. Validate the model in independent datasets using the same risk score formula and stratification criteria [34].
Clinical Utility Assessment
Nomogram Construction: Develop a comprehensive nomogram that integrates the risk score with clinical parameters (age, stage, grade) to predict individual patient prognosis [33] [34].
Decision Curve Analysis: Evaluate the clinical net benefit of the model compared to traditional staging systems across different threshold probabilities [34].
Drug Sensitivity Prediction: Correlate risk scores with IC50 values of common chemotherapeutic and targeted agents using databases such as GDSC or CTRP to guide treatment selection [34].
Immune Infiltration Analysis
Immune Cell Quantification
Algorithm Selection: Employ multiple deconvolution algorithms (e.g., CIBERSORT, EPIC, TIMER, QUANTISEQ) to estimate immune cell abundances from bulk tumor transcriptomes [31] [32]. Use the consensus of multiple methods to increase reliability.
Immune Scoring: Calculate immune scores, stromal scores, and estimate scores using the ESTIMATE algorithm to characterize the tumor microenvironment [31] [33].
Statistical Comparison: Compare immune cell infiltration between risk groups using Wilcoxon rank sum test with significance threshold of p < 0.05 [33].
Immune Checkpoint and Microenvironment Analysis
Checkpoint Expression: Examine the correlation between UBR expression and immune checkpoint genes (PD-1, PD-L1, CTLA-4, LAG-3, etc.) using Spearman correlation analysis [31] [32].
Tumor Immunogenicity Assessment: Evaluate the relationship between UBR expression and tumor mutational burden (TMB), microsatellite instability (MSI), and neoantigen load using Spearman correlation tests [32].
Immunotherapy Response Prediction: Analyze differential response rates to immune checkpoint inhibitors between risk groups in available immunotherapy cohorts (e.g., IMvigor210, GSE135222) [30].
Functional Validation Experiments
In Vitro Cellular Assays
Gene Modulation: Perform knockdown or overexpression of target UBRs in cancer cell lines using siRNA, shRNA, or cDNA expression vectors. Use Lipofectamine 2000 or similar transfection reagents with optimization for specific cell types [33].
Proliferation Assessment: Evaluate cell viability using CCK-8 assay according to manufacturer's protocol. Measure absorbance at 450nm at 0, 24, 48, and 72 hours post-treatment [34].
Migration and Invasion Evaluation: Conduct wound healing assays by creating a scratch wound and monitoring closure at 0, 24, and 48 hours. Perform transwell invasion assays using Matrigel-coated chambers with 10% FBS as chemoattractant [34].
Western Blot Analysis: Extract proteins using high-performance RIPA lysis buffer with protease and phosphatase inhibitors. Separate proteins by SDS-PAGE, transfer to PVDF membranes, and probe with primary antibodies overnight at 4°C [33].
Pathway Analysis
Gene Set Enrichment: Perform Gene Set Enrichment Analysis (GSEA) using hallmark gene sets from MSigDB to identify pathways enriched in high-risk groups or UBR-overexpressing samples [28] [30].
GSVA Scoring: Calculate pathway activity scores using Gene Set Variation Analysis (GSVA) with the "GSVA" R package [28]. Use Spearman correlation to assess associations between UBR expression and pathway activity.
Protein-Protein Interaction Networks: Construct PPI networks using the STRING database and identify functional modules using Molecular Complex Detection (MCODE) plugin in Cytoscape [28].
The Scientist's Toolkit
Table 4: Essential Research Reagents and Resources for Ubiquitination Studies in Cancer
| Category | Resource/Reagent | Specification/Application | Key Features |
|---|---|---|---|
| Databases | TCGA (https://www.cancer.gov/ccg/research/genome-sequencing/tcga) [28] [32] | Pan-cancer molecular and clinical data | Multi-omics data for 33+ cancer types |
| GTEx (https://www.gtexportal.org/) [28] [32] | Normal tissue transcriptome reference | Normal tissue expression baseline | |
| UUCD (http://uucd.biocuckoo.org/) [33] [28] | Ubiquitin and ubiquitin-like conjugation database | Curated repository of UBRs | |
| cBioPortal (https://www.cbioportal.org/) [32] | Cancer genomics data exploration | User-friendly visualization tools | |
| Computational Tools | GEPIA2 (http://gepia2.cancer-pku.cn/) [32] | Gene expression analysis | TCGA and GTEx data integration |
| UALCAN (https://ualcan.path.uab.edu/) [31] [32] | Protein expression and promoter methylation | CPTAC proteomics data integration | |
| TISIDB (http://cis.hku.hk/TISIDB/) [31] | Tumor-immune system interactions | Immunogenomics analysis | |
| TIMER (https://cistrome.shinyapps.io/timer/) [32] | Immune infiltration estimation | Multiple deconvolution algorithms | |
| Experimental Reagents | CCK-8 assay kit [34] | Cell proliferation and viability assessment | Non-radioactive, high sensitivity |
| Transwell chambers [34] | Cell migration and invasion measurement | Matrigel coating for invasion assays | |
| RIPA lysis buffer [33] | Protein extraction from cells and tissues | Compatible with phosphatase/protease inhibitors | |
| Protease/phosphatase inhibitor cocktail [33] | Preservation of protein phosphorylation | Maintains ubiquitination status |
Visualizations
Ubiquitination Cascade and Cancer Dysregulation
Ubiquitination-Related Prognostic Model Workflow
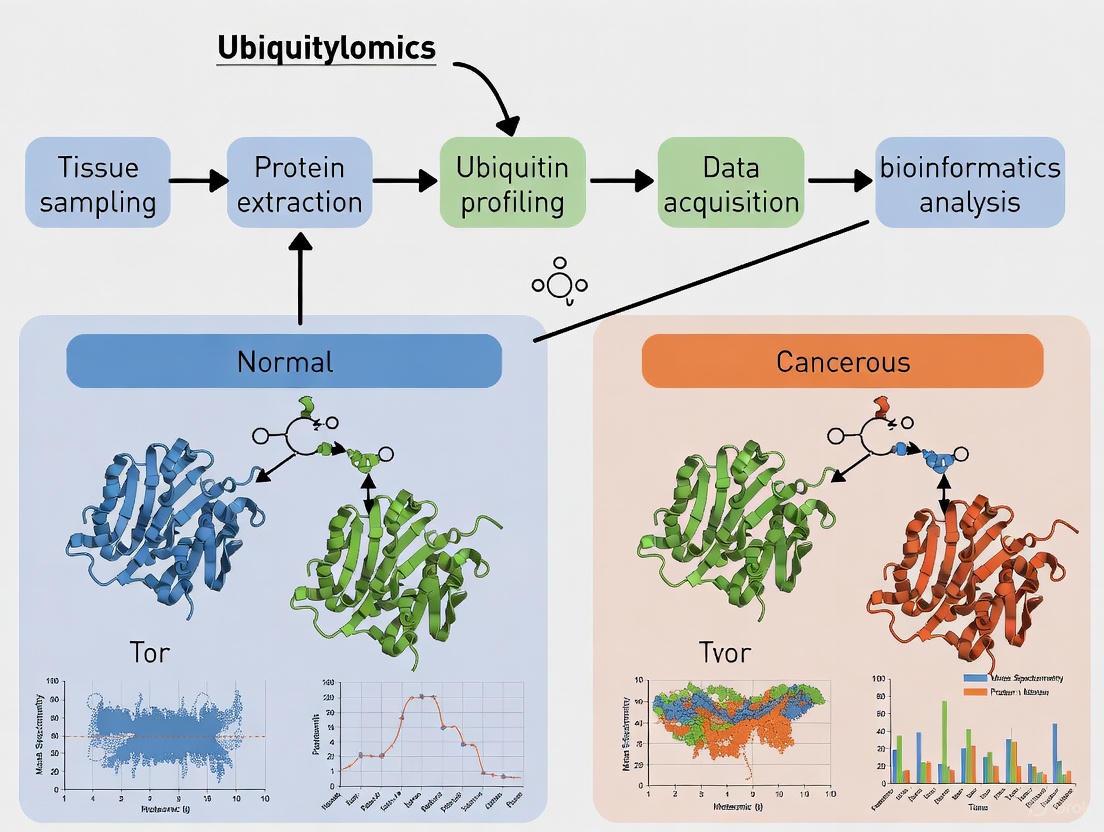
Advanced Ubiquitylomics Workflows: From Tissue Processing to Data Acquisition
The pursuit of reliable ubiquitylomics data from clinical tissue samples, particularly in the context of cancer research, demands rigorous and reproducible sample preparation. The quality of this initial stage fundamentally determines the success of all downstream analyses, including mass spectrometry, which is used to characterize the ubiquitin code in cancerous versus normal tissues [22] [35]. This protocol details the essential steps for the preparation of tissue lysates suitable for ubiquitination profiling, with a specific focus on preserving the post-translational modifications of interest and maintaining the integrity of the proteome. The methods described herein are framed within a broader research objective of identifying differentially ubiquitinated proteins that may serve as biomarkers or therapeutic targets in human cancers, drawing from established practices in ubiquitinomics studies [22] [35] [36].
Experimental Workflow and Key Reagents
The journey from tissue specimen to analytical-ready sample involves a coordinated sequence of steps, each critical for preserving the native ubiquitinome.
The diagram below outlines the core experimental workflow for tissue sample preparation in ubiquitylomics studies.
Research Reagent Solutions
The following table catalogues the essential reagents required for the successful implementation of this protocol.
Table 1: Essential Reagents for Tissue Lysis and Protein Preparation
| Reagent Category | Specific Examples | Function & Rationale |
|---|---|---|
| Lysis Buffers | RIPA, NP-40, Urea-based Buffer (8 M Urea, 50 mM TEAB) [37] [16] [36] | Disrupts tissue architecture and cell membranes to solubilize proteins. Choice depends on protein localization and downstream application [38] [37]. |
| Protease Inhibitors | PMSF (1 mM), Aprotinin (2 µg/mL), Leupeptin (1-10 µg/mL), Pepstatin A (1 µg/mL), EDTA (1-5 mM) [37] | Prevents co-extracted proteases from degrading target proteins, preserving the native protein and ubiquitination state [38] [39]. |
| Phosphatase Inhibitors | Sodium Fluoride (5-10 mM), Sodium Orthovanadate (1 mM), β-Glycerophosphate (1-2 mM) [37] | Preserves labile phosphorylation states, which is often crucial for signaling studies in cancer [38]. |
| Chaotropic Agents | Urea (8 M), Guanidine HCl [16] [40] | Denatures proteins and increases solubility, particularly effective for membrane and insoluble proteins [40]. |
| Detergents | SDS, Triton X-100, Sodium Deoxycholate [37] [16] | Aids in membrane solubilization. SDS is a strong denaturant ideal for total protein extraction [38] [37]. |
| Reducing Agents | Dithiothreitol (DTT, 10-100 mM), β-Mercaptoethanol (5%) [39] [37] [16] | Breaks disulfide bonds, linearizing proteins for consistent migration in electrophoresis. |
| Alkylating Agent | Iodoacetamide (IAA, 30-50 mM) [22] [35] [16] | alkylates cysteine thiol groups to prevent reformation of disulfide bonds. |
Detailed Methodologies
Tissue Lysis and Homogenization
Efficient lysis is the cornerstone of effective protein extraction, requiring mechanical force combined with optimized buffer chemistry.
- Tissue Collection and Stabilization: Following surgical resection, dissect the tissue of interest (e.g., tumor and adjacent normal) rapidly on ice. Snap-freeze the tissue fragments by immersing them in liquid nitrogen and store at -80°C until processing [22] [39] [35].
- Homogenization: For a ~5 mg piece of tissue, add 300 µL of ice-cold lysis buffer (e.g., RIPA or 8 M Urea-based buffer) supplemented with fresh protease and phosphatase inhibitors [39] [37] [16].
- Homogenize using an electric homogenizer.
- Rinse the homogenizer blade with two additional 300 µL volumes of lysis buffer to maximize recovery [39].
- Solubilization: Maintain constant agitation for 2 hours at 4°C (e.g., on an orbital shaker) to ensure complete solubilization [39].
- Clarification: Centrifuge the lysate at 12,000–15,000 × g for 10–20 minutes at 4°C to pellet insoluble debris, lipids, and nuclei. Gently transfer the supernatant (soluble protein fraction) to a fresh pre-cooled tube [39] [37] [36].
Protease and Phosphatase Inhibition
The moment of lysis releases endogenous enzymes that can rapidly degrade proteins and remove modifications. The composition of the inhibitor cocktail must be tailored to the specific sample.
Table 2: Protease and Phosphatase Inhibitor Preparation
| Inhibitor | Target Enzymes | Stock Concentration | Final Working Concentration |
|---|---|---|---|
| PMSF | Serine proteases | 100 mM (in isopropanol) | 1 mM |
| Aprotinin | Trypsin, Chymotrypsin, Plasmin | 1 mg/mL | 2 µg/mL |
| Leupeptin | Lysosomal proteases (Cysteine, Serine) | 1 mg/mL | 1-10 µg/mL |
| Pepstatin A | Aspartic proteases (e.g., Cathepsin D) | 1 mg/mL | 1 µg/mL |
| EDTA | Metalloproteases (Mg²⁺, Mn²⁺ dependent) | 500 mM, pH 8.0 | 1-5 mM |
| Sodium Orthovanadate | Tyrosine phosphatases | 200 mM (activated) | 1 mM |
| Sodium Fluoride | Serine/Threonine phosphatases | 1 M | 5-10 mM |
Protein Denaturation and Reduction
For most western blot and mass spectrometry applications, proteins must be denatured and reduced to ensure uniform behavior.
- Protein Quantification: Determine the protein concentration of the clarified lysate using a compatible assay (e.g., BCA or Bradford), with BSA as a standard [39] [37] [16].
- Buffer Addition: Mix the protein lysate with an equal volume of 2X Laemmli sample buffer [39] [37].
- Denaturation and Reduction: Heat the samples at 95–100°C for 5 minutes. This step, in the presence of SDS and a reducing agent, fully denatures the proteins and reduces disulfide bonds, linearizing them for analysis [39] [37].
Table 3: Standard 2X Laemmli Buffer Composition and Purpose
| Component | Final Concentration | Purpose |
|---|---|---|
| SDS (Sodium Dodecyl Sulfate) | 4% | Strong anionic detergent that binds to and denatures proteins, imparting a uniform negative charge. |
| Glycerol | 10-20% | Increases sample density for easy loading into gel wells. |
| Bromophenol Blue | 0.004% | Tracking dye to monitor electrophoresis progress. |
| Tris HCl | 62.5-125 mM, pH ~6.8 | Buffering agent to maintain stable pH. |
| 2-Mercaptoethanol or DTT | 5% or 100-500 mM | Reducing agent that breaks disulfide bonds. |
Critical Factors for Ubiquitylomics
The following considerations are paramount when preparing samples specifically for ubiquitination analysis.
- Inhibition of Deubiquitinases (DUBs): Beyond standard protease inhibitors, include specific DUB inhibitors like PR-619 in the lysis buffer to prevent the loss of ubiquitin chains by endogenous deubiquitinating enzymes, thereby preserving the in vivo ubiquitination state [22].
- Compatibility with Ubiquitin Remnant Enrichment: For mass spectrometry-based ubiquitylomics, the initial protein extraction must be compatible with subsequent tryptic digestion and immunoaffinity enrichment of K-ε-GG-containing peptides. Urea-based lysis buffers are commonly employed for this purpose [22] [35] [41].
- Lysis Buffer Selection for Membrane Proteins: The study of ubiquitinated membrane proteins, such as receptor tyrosine kinases, often requires harsh denaturing conditions (e.g., high concentrations of SDS) from the outset to effectively solubilize them and prevent artificial interactions or degradation [38] [37].
- Temperature and Processing Speed: All steps from tissue dissection to clarified lysate should be performed on ice or at 4°C to minimize enzymatic activity. Processing samples quickly and moving them to a denatured state reduces artifacts [39] [37] [40].
Mastering the fundamentals of tissue lysis, effective protease inhibition, and controlled denaturation is non-negotiable for generating high-quality data in cancer ubiquitylomics. The protocols and guidelines provided here offer a robust framework for preparing tissue lysates that accurately reflect the biological state of the ubiquitin system, thereby laying a solid foundation for the discovery of meaningful insights into cancer biology and the identification of novel therapeutic vulnerabilities.
Tryptic Digestion and K-ε-GG Peptide Enrichment Strategies
Ubiquitylomics, the large-scale study of protein ubiquitination, is crucial for understanding the dysregulated cellular processes in cancer. The ubiquitin-proteasome system controls the degradation of key proteins involved in cell cycle progression, apoptosis, and DNA repair. Mapping ubiquitination sites via mass spectrometry requires specialized sample preparation, specifically optimized tryptic digestion and highly selective enrichment of K-ε-GG modified peptides. This application note provides detailed protocols and data for profiling ubiquitination in cancerous versus normal tissues.
Research Reagent Solutions
Table 1: Essential research reagents and materials for tryptic digestion and K-ε-GG peptide enrichment.
| Reagent/Material | Function/Application | Example Specifications |
|---|---|---|
| Trypsin, Mass Spectrometry Grade | Protease that cleaves C-terminal to Lys and Arg; generates peptides with C-terminal GlyGly remnant on ubiquitinated lysines. [42] | Trypsin Gold (Promega, V5280); Reconstituted in 50mM acetic acid; stored at -70°C. [42] |
| Anti-K-ε-GG Antibody Beads | Immunoaffinity enrichment of peptides containing the diglycine lysine modification. [43] | PTMScan Ubiquitin Remnant Motif (K-ε-GG) Kit; 25D5 type antibody beads (Thermo Fisher Scientific). [43] |
| Denaturing Agent | Unfolds proteins to make lysine residues accessible for tryptic cleavage. [42] | 6M Guanidine HCl or 8M Urea. [42] |
| Reducing Agent | Breaks disulfide bonds within proteins for complete denaturation. [42] | 2-5mM DTT (Dithiothreitol). [42] |
| Alkylating Agent | Caps cysteine residues to prevent reformation of disulfide bonds. [43] | 20mM Iodoacetamide. [43] |
| Tandem Mass Tag (TMT) Reagents | Labels peptides from multiple samples for multiplexed quantitative comparison (e.g., cancer vs. normal). [43] | 6-plex or 11-plex TMT kit (Thermo Fisher Scientific). [43] |
Protocol: Sequential Tryptic Digestion for Enhanced Coverage
Protein Denaturation, Reduction, and Alkylation
- Dissolve the target protein pellet or tissue lysate in a denaturing buffer (e.g., 6M Guanidine HCl, 50mM Tris-HCl, pH 8.0). [42]
- Reduce by adding DTT to a final concentration of 2-5mM and incubate at 37°C for 45-60 minutes. [42]
- Alkylate by adding iodoacetamide to a final concentration of 20mM and incubate at room temperature for 35 minutes in darkness. [43]
- Dilute the sample with 50mM NH₄HCO₃ or 50mM Tris-HCl (pH 7.8) until the guanidine HCl concentration is below 1M. [42]
Time-Lapsed Tryptic Digestion
- First Digestion: Add trypsin at a 1:50 (w/w) enzyme-to-protein ratio and incubate at 37°C overnight. [43]
- Second Digestion: Add a fresh aliquot of trypsin at a 1:1000 (w/w) ratio and incubate for another 4 hours at 37°C. [43] This two-step digestion enhances overall sequence coverage. [43]
- Alternative Advanced Protocol: For maximum coverage, perform a time-lapse digestion with sequential peptide collection. Incubate the sample with trypsin and collect released peptides at multiple timepoints (e.g., 15, 30, 60, 120, and 240 minutes). Pool the peptides from all timepoints for analysis. [44]
- Stop Reaction by acidifying the sample with formic, acetic, or trifluoroacetic acid to a pH below 4.0. [42] Digested samples can be stored at -20°C.
Protocol: K-ε-GG Peptide Enrichment
Peptide Desalting and Labeling (Optional)
- Desalt the digested peptide sample using a C18 solid-phase extraction (SPE) column. [43]
- Dry the eluted peptides using a vacuum concentrator. [43]
- Label the peptides with Tandem Mass Tag (TMT) reagents for multiplexed quantitative analysis according to the manufacturer's instructions. This allows for the direct comparison of ubiquitination levels between cancerous and normal tissues. [43]
Immunoaffinity Enrichment
- Dissolve the tryptic peptide sample in NETN buffer (100 mM NaCl, 1 mM EDTA, 50 mM Tris-HCl, pH 8.0). [43]
- Incubate the peptide solution with pre-washed anti-K-ε-GG antibody beads (e.g., 25D5 type) for 12 hours at 4°C under gentle shaking. [43]
- Wash the beads several times with NETN buffer and then with ice-cold deionized water to remove non-specifically bound peptides. [43]
- Elute the bound K-ε-GG peptides from the beads using a weak acid, such as 0.1% trifluoroacetic acid (TFA). [43]
- Desalt the eluted peptides using a C18 StageTip or microcolumn before LC-MS/MS analysis. [43]
Data Presentation and Analysis
Impact of Spectral Libraries on Protein Identification
The choice of spectral library significantly influences the results of a ubiquitylomics experiment, especially when using Data-Independent Acquisition (DIA) mass spectrometry.
Table 2: Comparison of matrisome protein identification using different spectral libraries in DIA analysis. [44]
| Spectral Library Type | Total Matrisome Proteins Identified | Key Characteristics and Performance |
|---|---|---|
| Custom Matrisome Library | 106 | Combines DIA-NN, project-specific DDA, and public matrisome data; superior for identifying ECM glycoproteins and regulators. [44] |
| DIA-NN Library | 104 | Good overall performance; may yield less signal from collagens but more from proteoglycans. [44] |
| Project-Specific DDA Library | 86 | Generated from a pilot experiment; may lack depth for lower-abundance ubiquitinated peptides. [44] |
Ubiquitination Motif Analysis
Conserved amino acid patterns (motifs) around ubiquitination sites can reveal enzyme specificity and function. Global ubiquitylomic analyses often identify recurring motifs.
Table 3: Example ubiquitination motifs and their potential structural impact. [45]
| Motif Description | Consensus Sequence | Potential Functional/Structural Impact |
|---|---|---|
| Zinc Finger Motif 1 | xxHxxxxxxEKxxxCxxCxxx | Ubiquitination site located between two zinc finger domains, potentially affecting DNA binding or targeting the protein for degradation. [45] |
| Zinc Finger Motif 2 | CxxxxxxFxQKxxxxxxxxxx | Ubiquitination site located within the zinc chelation structure, which could directly disrupt domain folding and function. [45] |
| Serine/Threonine Kinase Motif | [Variable but highly conserved in different motifs] | Different conserved residues in various kinase motifs suggest recognition by different E3 ubiquitin ligases, enabling precise regulation. [45] |
Workflow and Pathway Diagrams
Diagram 1: Ubiquitylomics workflow for cancer research.
The comprehensive analysis of protein ubiquitination, known as ubiquitylomics, provides critical insights into cellular regulation and disease mechanisms. This application note details the integration of high-resolution mass spectrometry platforms, including LC-MS/MS and 4D-label free quantification, for profiling ubiquitination signatures in cancerous versus normal tissues. We present optimized experimental protocols, data analysis workflows, and reagent solutions specifically tailored for ubiquitylomics research, enabling researchers to uncover novel therapeutic targets and biomarkers in oncology.
Protein ubiquitination is a crucial post-translational modification that regulates virtually all cellular processes, including protein degradation, cell cycle progression, signal transduction, and DNA damage response [24] [28]. The dysregulation of ubiquitination signaling networks is closely associated with the initiation and progression of multiple cancers [28]. Ubiquitylomics—the large-scale study of protein ubiquitination—has emerged as a powerful approach for identifying altered ubiquitination patterns that distinguish cancerous from normal tissues.
The complexity of ubiquitination presents significant analytical challenges, including the transient nature of the modification, low stoichiometry of ubiquitylated proteins, and rapid turnover of degradation-targeted proteins [24]. High-resolution mass spectrometry platforms now enable researchers to overcome these challenges through enhanced sensitivity, specificity, and throughput. This application note focuses on the implementation of LC-MS/MS and 4D-label free quantification technologies specifically for ubiquitylomics analysis in cancer research, providing detailed protocols for identifying clinically relevant ubiquitination signatures.
Platform Comparison: Technical Specifications and Performance Metrics
The selection of appropriate mass spectrometry platforms is critical for successful ubiquitylomics studies. The table below summarizes the key specifications of LC-MS/MS and 4D-label free quantification platforms for ubiquitination analysis:
Table 1: Comparison of Mass Spectrometry Platforms for Ubiquitylomics
| Feature | Traditional LC-MS/MS | 4D-Label Free Quantification |
|---|---|---|
| Separation Dimensions | Liquid chromatography (LC), mass-to-charge (m/z) measurement | LC, ion mobility (TIMS), m/z measurement, aligned retention time [46] |
| Ion Utilization | Moderate | High (Parallel Accumulation-Serial Fragmentation - PASEF) [46] |
| Proteome Coverage | Limited | Comprehensive [46] |
| Quantitative Accuracy | Moderate | High [46] |
| Identification & Quantification of K-GG Peptides | ~21,434 peptides (DDA) [47] | ~68,429 peptides (DIA) [47] |
| Typical CV for Ubiquitinated Peptides | >20% [47] | ~10% [47] |
| Best Application | Targeted ubiquitination studies | Discovery-phase ubiquitinome profiling [46] |
The 4D-label free platform integrates trapped ion mobility spectrometry (TIMS) which separates ions based on their collisional cross-section (CCS), adding an orthogonal separation dimension that enhances specificity for identifying ubiquitinated peptides [46]. The PASEF acquisition strategy enables fragmentation rates exceeding 100 Hz, providing superior sequencing speed and sensitivity without compromising quantitative accuracy [46].
Experimental Protocols for Ubiquitylomics Analysis
Sample Preparation and Lysis Optimization
Preserving the native ubiquitination state during sample preparation is paramount for reliable ubiquitylomics data:
Lysis Buffer Composition: Use sodium deoxycholate (SDC)-based lysis buffer supplemented with 40mM chloroacetamide (CAA) for effective protease inhibition and improved ubiquitin site coverage [47]. SDC lysis yields approximately 38% more K-GG peptides compared to conventional urea buffer [47].
DUB Inhibition: Include deubiquitylase (DUB) inhibitors (EDTA/EGTA for metallo-proteinases and 2-chloroacetamide/Iodoacetamide/N-ethylmaleimide/PR-619 for cysteine proteinases) in lysis buffer to prevent artifactual deubiquitination [24].
Protein Input Requirements: For tissue samples, 2mg protein input is recommended for optimal K-GG peptide identification. Inputs below 500μg significantly reduce identification numbers [47].
Temperature Control: Process samples on ice or at 4°C whenever possible, with immediate boiling after lysis to preserve ubiquitination states [24] [47].
Ubiquitinated Peptide Enrichment and Cleanup
Enzymatic Digestion: Digest proteins using trypsin (1:50 enzyme-to-protein ratio) at 37°C for 16 hours to generate K-ε-GG remnant peptides [48] [47].
Immunoaffinity Purification: Enrich ubiquitinated peptides using anti-K-ε-GG antibody-conjugated beads. Incubate peptides with beads for 2 hours at 4°C with gentle rotation [48].
Wash and Elution: Wash beads sequentially with ice-cold IAP buffer (Cell Signaling) and water. Elute peptides with 0.1% TFA [47].
Desalting: Use C18 stage tips for sample cleanup and concentration before MS analysis [47].
Mass Spectrometry Acquisition Parameters
Table 2: Optimal MS Acquisition Parameters for Ubiquitylomics
| Parameter | LC-MS/MS (DDA) | 4D-Label Free (DIA) |
|---|---|---|
| LC Gradient | 120-180 min | 75-120 min [47] |
| MS1 Resolution | 60,000 | 60,000-120,000 |
| MS2 Resolution | 15,000 | 30,000-60,000 |
| Ion Mobility | Not available | TIMS with 1/K0 scanning [46] |
| Collision Energy | Stepped (25-35%) | Optimized based on m/z and IM [46] |
| Acquisition Mode | Data-Dependent (DDA) | Data-Independent (DIA) [47] |
Figure 1: Ubiquitylomics Workflow for Cancer Tissue Analysis
Data Processing and Bioinformatics Analysis
Data Conversion: Convert raw files to appropriate formats (e.g., mzML for DIA data).
Database Search: For DDA data, use MaxQuant with match-between-runs enabled. For DIA data, use DIA-NN in library-free mode against human proteome databases [47].
False Discovery Rate: Set FDR threshold to 1% at both peptide and protein levels.
Quantitative Analysis: Perform differential analysis of ubiquitination sites between cancerous and normal tissues using normalized spectral intensity values.
Bioinformatics: Conduct pathway enrichment, protein-protein interaction network, and clinical correlation analyses using ubiquitination regulators (UBRs) as inputs [28].
The Scientist's Toolkit: Essential Research Reagents and Materials
Table 3: Essential Research Reagents for Ubiquitylomics
| Reagent/Material | Function | Specific Recommendation |
|---|---|---|
| DUB Inhibitors | Prevents artifactual deubiquitination during sample processing | PR-619 (broad-spectrum), N-Ethylmaleimide (cysteine DUBs) [24] |
| Anti-K-ε-GG Antibody | Immunoaffinity enrichment of ubiquitinated peptides | Cell Signaling Technology #5562 [48] |
| SDC Lysis Buffer | Efficient protein extraction with DUB inhibition | 5% SDC, 40mM CAA, 100mM Tris pH 8.5 [47] |
| TIMS Column | Ion mobility separation for 4D proteomics | timsTOF Pro compatible [46] |
| C18 StageTips | Peptide desalting and cleanup | Thermo Scientific #SP301 |
| Trypsin | Protein digestion to generate K-GG peptides | Sequencing grade modified trypsin (Promega) [48] |
Cancer Research Applications: From Discovery to Validation
Ubiquitylomics platforms enable comprehensive investigation of ubiquitination alterations in cancer:
Biomarker Discovery: Identification of differentially ubiquitinated proteins in cancer subtypes. For example, 4D-label free quantification identified ribosomal proteins RPL27, RPS16, and tRNA synthetase TARS2 as potential prognostic biomarkers in hepatocellular carcinoma [46].
Drug Target Validation: Mapping ubiquitination changes in response to targeted therapies. USP7 inhibition studies revealed hundreds of proteins with altered ubiquitination states, distinguishing degradative from non-degradative ubiquitination events [47].
Pathway Analysis: Integration of ubiquitination data with cancer hallmark pathways. Research has shown correlations between ubiquitination regulators and 32 cancer hallmark-related pathways, with more than 90% of UBRs affecting cancer patient survival [28].
Therapeutic Development: Identification of novel drug targets within the ubiquitin-proteasome system, particularly E3 ligases and deubiquitinases with altered activity in cancer [28].
Figure 2: Ubiquitylomics Data Analysis Pathway in Cancer Research
Troubleshooting and Technical Considerations
Low K-GG Peptide Recovery: Ensure fresh DUB inhibitors are added to lysis buffer and processing time is minimized. Increase protein input amount to 2mg if possible [47].
High Background Signal: Optimize antibody-to-peptide ratio during enrichment and include additional wash steps with high-salt buffers.
Missing Values in DDA: Switch to DIA acquisition mode, which reduces missing values and improves quantitative precision [47].
Poor Chromatographic Separation: Extend LC gradient time and ensure proper column maintenance. Consider using longer capillary columns (e.g., 50cm) for enhanced separation.
Data Quality Assessment: Monitor coefficient of variation (CV) between replicates—aim for median CV <10% for ubiquitinated peptides [47].
The integration of high-resolution mass spectrometry platforms, particularly 4D-label free quantification with LC-MS/MS, has revolutionized ubiquitylomics research in cancer biology. These advanced technological platforms enable researchers to comprehensively map ubiquitination alterations that distinguish cancerous from normal tissues, providing unprecedented insights into cancer mechanisms and potential therapeutic vulnerabilities. The protocols and methodologies detailed in this application note provide a robust foundation for implementing these powerful approaches in oncology research, with the ultimate goal of developing novel diagnostic biomarkers and targeted therapies based on the ubiquitination code.
Ubiquitylomics, the large-scale study of protein ubiquitination, has become indispensable for understanding the complex regulatory mechanisms in cancer biology. Protein ubiquitination, a post-translational modification where ubiquitin is attached to substrate proteins, governs critical processes including protein degradation, cell cycle progression, and DNA repair [36] [41]. Dysregulation of ubiquitination is implicated in oncogenesis and cancer metastasis, making its comprehensive profiling essential for identifying novel therapeutic targets [22] [36]. However, the low stoichiometry of endogenous ubiquitination and the complexity of biological tissues present significant challenges for deep-scale analysis.
Advanced mass spectrometry (MS) techniques now enable system-wide profiling of ubiquitination sites. The breakthrough came with the development of antibodies specific to the di-glycine (K-ε-GG) remnant left on ubiquitinated lysine residues after trypsin digestion [36] [41]. While powerful, conventional workflows using these antibodies faced limitations in throughput and quantitative accuracy when applied to precious clinical samples. The integration of isobaric chemical tagging, specifically Tandem Mass Tag (TMT) technology, with optimized enrichment protocols has revolutionized ubiquitination profiling. This protocol details the UbiFast methodology, an automated, highly sensitive platform that combines TMT multiplexing with anti-K-ε-GG antibody enrichment to enable quantitative ubiquitylomics analysis of cancerous versus normal tissues, requiring only sub-milligram sample inputs [49] [41].
Key Technological Principles
The UbiFast Method: On-Antibody TMT Labeling
The UbiFast method ingeniously overcomes a major limitation in traditional ubiquitylomics: the inability of anti-K-ε-GG antibodies to recognize the di-glycyl remnant after its N-terminus is derivatized with TMT reagents [41]. The core innovation is on-antibody TMT labeling, where K-ε-GG peptides are labeled with TMT reagents while still bound to the anti-K-ε-GG antibody [50] [41]. In this protected state, the amine-reactive TMT reagent reacts with the peptide N-terminal amine and the ε-amine groups of lysine residues, but not the primary amine of the di-glycyl remnant itself. After labeling, peptides from multiple samples are combined on-bead, eluted, and analyzed by LC-MS/MS [51] [41]. This approach preserves the antibody's affinity for the K-ε-GG motif and significantly improves the relative yield of ubiquitylated peptides compared to in-solution labeling (85.7% vs. 44.2%) [41].
Tandem Mass Tag (TMT) Technology for Multiplexing
TMT is an isobaric labeling technology that enables simultaneous quantification of peptides from multiple samples in a single MS run [52]. The TMT reagent structure consists of a mass reporter, a cleavable linker, a mass normalization group, and a reactive group that binds to peptide amines [52]. Peptides from different samples are labeled with distinct TMT tags that have the same total mass. During MS/MS analysis using higher-energy collisional dissociation (HCD), the reporter ions are cleaved, generating low-mass tags that are unique to each sample. The relative intensity of these reporter ions provides precise quantification of the peptide across all multiplexed samples [41] [52].
Experimental Protocol: Automated UbiFast for Tissue Samples
This protocol describes the automated UbiFast workflow for profiling ubiquitination sites from patient tissue samples, such as breast cancer patient-derived xenograft (PDX) tissues, enabling a direct comparison between cancerous and normal states [49] [51].
Sample Preparation and Protein Digestion
- Tissue Lysis: Snap-freeze tissue samples in liquid nitrogen. Pulverize the frozen tissue using a cryogenic mill. For each sample, incubate ~50 mg of powdered tissue in 1 mL of lysis buffer (8 M urea, 50 mM Tris-HCl pH 8.0, 150 mM NaCl, 1 mM EDTA) supplemented with protease inhibitors (e.g., 2 μg/mL aprotinin, 10 μg/mL leupeptin) and deubiquitinase inhibitors (e.g., 50 μM PR-619) for 30 minutes on ice. Sonicate on ice and centrifuge at 20,000×g for 10 minutes at 4°C. Collect the supernatant [51] [36].
- Protein Quantification: Determine protein concentration using a bicinchoninic acid (BCA) assay kit.
- Reduction and Alkylation: Add dithiothreitol (DTT) to the lysate to a final concentration of 5 mM and incubate for 45 minutes at room temperature. Then add iodoacetamide (IAA) to a final concentration of 10 mM and incubate for 30 minutes in the dark.
- Protein Digestion: Dilute the lysate 1:4 with 50 mM Tris-HCl (pH 8.0) to reduce urea concentration. Add Lys-C (Wako) at a 1:50 enzyme-to-substrate ratio and incubate for 2 hours at room temperature. Subsequently, add trypsin at a 1:50 enzyme-to-substrate ratio and incubate overnight at room temperature [51].
- Peptide Cleanup: Acidify the digest with formic acid (FA) to a final concentration of 1%. Centrifuge to remove precipitates. Desalt the peptides using a C18 solid-phase extraction cartridge (e.g., Sep-Pak). Elute peptides with 50% acetonitrile (ACN)/0.1% FA, dry under vacuum, and store at -80°C [51].
Automated UbiFast Enrichment and TMT Labeling
Table 1: Key Reagents for Automated UbiFast
| Reagent | Function | Specification |
|---|---|---|
| HS mag anti-K-ε-GG Ab | Enriches tryptic peptides with ubiquitin remnant | Magnetic bead-conjugated [49] [51] |
| Tandem Mass Tag (TMT) | Multiplexed quantitative labeling | 10- or 11-plex reagents [41] [52] |
| Magnetic Particle Processor | Automates bead handling | Enables processing of 96 samples/day [49] |
| Hydroxylamine | Quenches TMT labeling reaction | 5% solution [41] |
- Peptide Input: Resuspend 500 μg of peptides from each sample (e.g., cancerous and normal tissue digests) in NETN buffer (100 mM NaCl, 1 mM EDTA, 50 mM Tris-HCl, 0.5% NP-40, pH 8.0) [51] [36].
- Automated K-ε-GG Peptide Enrichment: Use a magnetic particle processor for all subsequent steps. Transfer peptides to a plate containing HS mag anti-K-ε-GG antibody beads. Incubate with gentle shaking for 2 hours at 4°C to allow ubiquitinated peptides to bind [49] [51].
- Bead Washing: Wash the beads automatically with NETN buffer to remove non-specifically bound peptides, followed by a wash with 50 mM HEPES (pH 8.5) to prepare the environment for TMT labeling [51].
- On-Antibody TMT Labeling: Resusend the beads in 50 mM HEPES (pH 8.5). Add 0.4 mg of TMT reagent (dissolved in anhydrous ACN) to each sample and incubate for 10 minutes with shaking. Quench the reaction by adding hydroxylamine to a final concentration of 5% and incubating for 15 minutes [41].
- Sample Pooling: After labeling and quenching, combine equal amounts of TMT-labeled peptides from each of the different samples (e.g., a 10-plex experiment) directly in the same tube while they are still bound to the beads [41].
- Peptide Elution: Elute the pooled, TMT-labeled K-ε-GG peptides from the antibody beads using 0.1% trifluoroacetic acid (TFA). Desalt the eluate using C18 ZipTips before MS analysis [51] [36].
LC-MS/MS Analysis and Data Processing
- Liquid Chromatography: Separate the enriched peptides using a nanoflow UHPLC system (e.g., UltiMate 3000) equipped with a C18 analytical column. Use a 60-minute gradient from 5% to 35% mobile phase B (0.1% FA in 98% ACN) at a flow rate of 250 nL/min [36].
- Mass Spectrometry Analysis: Analyze the eluting peptides using a high-resolution tandem mass spectrometer (e.g., Q-Exactive HF-X). Acquire MS1 spectra at a resolution of 60,000. Select the top 15 most intense precursors with charge states 2+ to 6+ for fragmentation using HCD. Acquire MS2 spectra at a resolution of 30,000 [36]. The use of High-field Asymmetric Waveform Ion Mobility Spectrometry (FAIMS) can further improve quantitative accuracy [41].
- Database Search: Process the raw MS/MS data using a search engine such as MaxQuant. Search spectra against the appropriate protein sequence database (e.g., SwissProt Human). Set carbamidomethylation of cysteine as a fixed modification, and oxidation of methionine, protein N-terminal acetylation, and GlyGly (K) as variable modifications. Filter identifications to a false discovery rate (FDR) of 1% at the peptide level [22] [36].
Diagram 1: UbiFast workflow for tissue ubiquitylomics.
Performance and Application in Cancer Research
Quantitative Performance of Automated UbiFast
The automated UbiFast method represents a significant advancement in quantitative ubiquitylomics, as benchmarked in studies utilizing Jurkat cell lines and patient-derived tissues [49] [51].
Table 2: Performance Metrics of Automated UbiFast
| Parameter | Manual UbiFast | Automated UbiFast |
|---|---|---|
| Processing Time | >5 hours for 10 samples | ~2 hours for a 10-plex [49] |
| Throughput | Limited | Up to 96 samples per day [49] |
| Ubiquitylation Sites Identified | ~10,000 sites (from 500 μg input) [41] | ~20,000 sites (from 500 μg input) [49] [51] |
| Reproducibility | Standard | Greatly improved, with significantly reduced variability across replicates [49] [51] |
| Key Innovation | On-antibody labeling | Magnetic beads + robotic automation [49] |
Application in Profiling Cancer Tissues
The sensitivity and throughput of UbiFast make it particularly suited for translational research on human tissues. Key applications include:
- Breast Cancer Subtyping: The method has been successfully applied to profile ubiquitylation in breast cancer PDX tissues, identifying differentially regulated ubiquitination sites between basal and luminal subtypes that may drive tumor progression [49] [41].
- Colon Adenocarcinoma Metastasis: Label-free ubiquitin proteomics (a related approach) compared primary and metastatic colon adenocarcinoma tissues, identifying 375 differentially regulated ubiquitination sites. Bioinformatics analysis revealed enrichment in pathways like RNA transport and cell cycle, suggesting ubiquitination of CDK1 may be a pro-metastatic factor [36].
- Adenoid Cystic Carcinoma (ACC): A 4D label-free ubiquitin study of OACC tissues identified 4,152 ubiquitination sites on 1,993 proteins. This study provided a comprehensive landscape of ubiquitination in this rare cancer, revealing potential biomarkers and therapeutic targets [22].
Diagram 2: UbiFast application in cancer research.
Discussion
The integration of TMT multiplexing with the automated UbiFast workflow provides a powerful and robust platform for ubiquitylomics, specifically designed to address the challenges of analyzing clinical tissue samples. The key advantages of this methodology are its high sensitivity, enabling the detection of over 20,000 ubiquitination sites from just 500 μg of patient tissue input, and its high throughput, allowing for the processing of 96 samples in a single day [49] [51]. The automation of the protocol using magnetic beads significantly enhances reproducibility and reduces manual labor and variability, which is critical for large-scale cohort studies [49].
In the context of cancer research, this methodology enables the systematic comparison of ubiquitination landscapes between cancerous and normal tissues. Such comparisons can reveal disease-specific ubiquitination events driving oncogenic signaling, metastasis, and drug resistance [22] [36] [41]. The ability to profile ubiquitination with high depth from small amounts of tissue, such as PDX models or patient biopsies, opens the door to identifying novel drug targets within the ubiquitin system and to developing targeted therapies for specific cancer subtypes. As the field moves towards more personalized medicine, the UbiFast methodology stands as a key enabling technology for uncovering the functional role of ubiquitination in cancer biology and therapy.
Oral adenoid cystic carcinoma (OACC) is a rare but aggressive salivary gland tumor characterized by a high propensity for perineural invasion, local recurrence, and distant metastasis [22] [53]. Despite multimodal treatment approaches involving surgery and radiotherapy, patients often experience poor long-term outcomes, with 10-year survival rates declining dramatically from 73% in Stage I to just 15% in advanced stages [22]. The molecular pathogenesis of OACC remains incompletely understood, hampering the development of effective targeted therapies.
Protein ubiquitination, an evolutionarily conserved post-translational modification, has emerged as a critical regulator of diverse cellular processes including protein degradation, signal transduction, and DNA repair [22] [54]. Dysregulation of the ubiquitin-proteasome system contributes significantly to tumorigenesis through effects on both oncogenes and tumor suppressor genes [22]. While previous studies have identified individual ubiquitination-related proteins with potential significance in OACC, such as UBA2 and USP22, a comprehensive profiling of the ubiquitin landscape in this malignancy has been lacking [22].
This case study employs 4D label-free quantitative ubiquitination proteomics to systematically map the ubiquitinome in OACC tumor tissues compared to adjacent normal controls. Our findings reveal widespread alterations in ubiquitination patterns, identifying dysregulated pathways and potential therapeutic targets for this challenging malignancy.
Key Findings and Quantitative Data
The ubiquitylomic profiling of four paired OACC tumor and adjacent normal tissues identified extensive alterations in protein ubiquitination patterns, providing a comprehensive landscape of ubiquitination dysregulation in this malignancy [22].
Table 1: Summary of Ubiquitylomic Profiling Results in OACC
| Parameter | Identified | Quantified | Up-regulated in OACC_T | Down-regulated in OACC_T |
|---|---|---|---|---|
| Ubiquitination Sites | 4,152 sites on 1,993 proteins | 1,648 sites on 859 proteins | 555 sites (≥1.5-fold, p<0.05) | 112 sites (≤0.67-fold, p<0.05) |
| Proteins | 1,993 proteins | 859 proteins | 385 proteins | 95 proteins |
| Peptides | 7,956 peptides | N/A | N/A | N/A |
| Modified Peptides | 4,116 peptides | N/A | N/A | N/A |
Table 2: Clinico-pathological Characteristics of Patient Cohort
| Gender | Age (years) | Tumor Size (cm) | Tumor Location | Neuro Recidivist | Lymph Node Metastasis |
|---|---|---|---|---|---|
| Female | 32 | 1.5 | Right submandibular | Yes | No |
| Male | 58 | 3.0 | Left submandibular | Yes | Yes |
| Female | 23 | 1.0 | Palate | Yes | No |
| Male | 64 | 2.5 | Parotid gland and neck | Yes | Yes |
The quantitative analysis revealed significant dysregulation of ubiquitination patterns in OACC tumor tissues (OACCT) compared to adjacent normal tissues (OACCN). A total of 555 ubiquitination sites on 385 proteins were significantly up-regulated (≥1.5-fold, p<0.05), while 112 sites on 95 proteins were down-regulated (≤0.67-fold, p<0.05) in tumor tissues [22]. This widespread alteration in ubiquitination suggests profound disruption of cellular regulatory mechanisms in OACC pathogenesis.
Molecular Context of OACC
To fully appreciate the significance of ubiquitination alterations in OACC, it is essential to understand the molecular background of this malignancy. OACC is characterized by several recurrent molecular alterations that may intersect with ubiquitination pathways:
Characteristic Genetic Alterations
The most frequent genetic alterations in OACC involve translocations resulting in MYB-NFIB, MYBL1-NFIB, and MYBL1-RAD51B gene fusions [53] [55]. The MYB-NFIB fusion is particularly common, with variable reported frequencies (16-100%) depending on detection methods [55]. These fusions typically lead to overexpression of MYB protein, which regulates genes involved in apoptosis, cell cycle control, angiogenesis, and cell adhesion [55]. Additional mechanisms contributing to MYB overexpression include juxtaposition of super enhancers to the MYB locus and deletion of 3' untranslated regions that normally allow silencing by miRNAs [55].
Signaling Pathway Dysregulation
Beyond characteristic gene fusions, OACC demonstrates alterations in multiple signaling pathways. NOTCH signaling pathway mutations occur in a subset of cases and are associated with more aggressive disease [53] [55]. The PI3K/AKT/mTOR pathway also shows frequent activation through mutations in PIK3CA or loss of PTEN [55]. Additionally, RAS mutations are observed in some OACC cases and correlate with poor prognosis [53]. These established molecular features provide context for understanding how ubiquitination dysregulation might intersect with known oncogenic mechanisms in OACC.
Experimental Protocols
Sample Preparation and Protein Extraction
Protocol: Tissue Processing and Protein Extraction
- Sample Collection: Obtain four pairs of OACC tumor and adjacent normal tissues (≥2 cm from tumor margin) following surgical resection. Secure institutional ethics committee approval and patient informed consent [22].
- Tissue Preservation: Immediately snap-freeze tissue specimens in liquid nitrogen and store at -80°C until processing.
- Protein Extraction:
- Add liquid nitrogen to frozen tissues and grind to fine powder using pre-cooled mortar and pestle.
- Add lysis buffer (1% Triton X-100, 1% protease inhibitor, 50 μM PR-619, 3 μM TSA, 50 mM NAM) at a 4:1 buffer-to-powder ratio.
- Perform ultrasonic pyrolysis using a sonicator with the following parameters: 30% amplitude, 10-second pulses alternating with 10-second rest periods, total processing time 2-3 minutes.
- Centrifuge lysates at 12,000 × g for 10 minutes at 4°C.
- Transfer supernatant to new centrifuge tubes and determine protein concentration using BCA assay kit.
- Quality Control: Assess protein integrity by SDS-PAGE before proceeding to digestion.
Trypsin Digestion and Peptide Preparation
Protocol: Protein Digestion and Peptide Cleanup
- Protein Precipitation: Slowly add trichloroacetic acid (TCA) to each sample to final concentration of 20%. Precipitate at 4°C for 2 hours.
- Pellet Collection: Centrifuge at 4,500 × g for 5 minutes. Discard supernatant.
- Wash Steps: Wash pellet twice with pre-cooled acetone. Air-dry pellet for 5-10 minutes.
- Protein Solubilization: Dissolve dried pellet in 200 mM triethylammonium bicarbonate (TEAB) buffer.
- Trypsin Digestion:
- Add trypsin at 1:50 enzyme-to-protein ratio.
- Incubate at 37°C overnight (12-16 hours).
- Reduction and Alkylation:
- Add dithiothreitol (DTT) to final concentration of 5 mM.
- Incubate at 56°C for 30 minutes.
- Add iodoacetamide (IAA) to final concentration of 11 mM.
- Incubate at room temperature for 15 minutes in the dark.
- Peptide Desalting: Desalt peptides using C18 solid-phase extraction cartridges according to manufacturer's instructions.
Ubiquitinated Peptide Enrichment and LC-MS/MS Analysis
Protocol: 4D Label-Free Quantitative Ubiquitination Proteomics
- Ubiquitinated Peptide Enrichment: Enrich ubiquitinated peptides using anti-di-glycine (K-ε-GG) antibody-conjugated beads.
- Liquid Chromatography:
- Instrument: NanoElute ultra performance liquid chromatography system
- Column: Reversed-phase C18 column (75 μm × 25 cm)
- Mobile Phase: A (0.1% formic acid, 2% acetonitrile); B (0.1% formic acid, 100% acetonitrile)
- Flow Rate: 450 nL/min
- Gradient: 6-22% B (0-43 min), 22-30% B (43-56 min), 30-80% B (56-58 min), 80% B (58-60 min)
- Mass Spectrometry:
- Instrument: Tims-TOF Pro mass spectrometer with Capillary Ion Source
- Ion Source Voltage: 2.0 kV
- Scanning Range: 100-1700 m/z for secondary MS
- Data Acquisition: Parallel Accumulation-Serial Fragmentation (PASEF) mode
- Dynamic Exclusion: 30 seconds
- Database Searching:
- Software: MaxQuant version 1.6.6.0
- Database: UniProt Human Proteome (20,366 sequences) plus common contaminants
- Enzyme Specificity: Trypsin/P with up to 4 missed cleavages
- Fixed Modification: Carbamidomethyl (C)
- Variable Modifications: Acetyl (protein N-term), Oxidation (M), GlyGly (K)
- False Discovery Rate: 1% at PSM and protein levels
- Quantitative Method: Label-free quantification (LFQ)
Bioinformatics and Pathway Analysis
Protocol: Bioinformatics Processing of Ubiquitylomics Data
- Data Filtering: Filter identification data with localization probability > 0.75.
- Quantitative Analysis: Calculate relative quantitative values according to modified site intensity between samples.
- Differential Analysis: Identify differentially modified proteins using thresholds of ≥1.5-fold for up-regulation and ≤0.67-fold for down-regulation with p-value <0.05.
- Functional Annotation: Annotate identified proteins using GO, KEGG, and Reactome databases.
- Cluster Analysis: Perform unsupervised hierarchical clustering to identify protein clusters with similar modification patterns.
- Motif Analysis: Analyze sequence motifs surrounding ubiquitination sites using Motif-X algorithm.
- Pathway Enrichment: Identify significantly enriched pathways using hypergeometric test with FDR correction.
- Network Analysis: Construct protein-protein interaction networks using STRING database and visualize using Cytoscape.
Dysregulated Pathways in OACC
The ubiquitylomic profiling identified several key cellular pathways with significant ubiquitination alterations in OACC, suggesting their critical roles in tumor pathogenesis:
Table 3: Key Dysregulated Pathways Identified in OACC Ubiquitylomics
| Pathway Category | Specific Pathways | Biological Significance in OACC |
|---|---|---|
| DNA Repair | Fanconi anemia pathway, Homologous recombination, Non-homologous end joining | Genomic instability, Treatment resistance [54] |
| Cell Cycle Regulation | G1/S transition, Cyclin-dependent kinase regulation | Uncontrolled proliferation [22] |
| Apoptosis | p53 signaling pathway, BCL2 family regulation | Evasion of cell death [54] |
| Metabolic Pathways | Oxidative phosphorylation, Glycolysis | Metabolic reprogramming [54] |
| Signal Transduction | NOTCH signaling, PI3K-AKT-mTOR pathway | Cell survival and growth signals [53] [55] |
| Chromatin Remodeling | Histone ubiquitination, SWI/SNF complex | Epigenetic alterations [54] |
The Scientist's Toolkit: Research Reagent Solutions
Table 4: Essential Research Reagents for Ubiquitylomics Studies
| Reagent/Category | Specific Examples | Function and Application |
|---|---|---|
| Protein Extraction Reagents | Triton X-100, Protease Inhibitor Cocktail, PR-619, TSA, NAM | Cell lysis, protein stabilization, inhibition of deubiquitinating enzymes and histone deacetylases [22] |
| Digestion & Processing | Trypsin, DTT, IAA, TEAB Buffer | Protein digestion, disulfide bond reduction, cysteine alkylation [22] |
| Ubiquitin Enrichment | Anti-K-ε-GG Antibody-conjugated Beads | Specific enrichment of ubiquitinated peptides for mass spectrometry analysis [22] |
| LC-MS/MS Components | NanoElute UPLC System, C18 Columns, Tims-TOF Pro MS | High-resolution separation and analysis of ubiquitinated peptides [22] |
| Bioinformatics Tools | MaxQuant, STRING, Cytoscape, Motif-X | Database searching, protein network analysis, motif identification [22] |
| Target Validation Reagents | PRT543 (PRMT5 Inhibitor), Lenvatinib | Experimental therapeutic agents for target validation [56] |
Implications for Therapeutic Development
The ubiquitination landscape mapping in OACC provides valuable insights for developing targeted therapeutic strategies:
Potential Therapeutic Targets
The study identified several promising targets for therapeutic intervention. Among the up-regulated ubiquitination sites, enzymes involved in the ubiquitin-proteasome system itself may represent particularly attractive targets. The recent identification of PRMT5 as a dependency in ACC through AI-driven target discovery provides independent validation of this approach [56]. Preclinical studies demonstrate that PRMT5 inhibition with PRT543 suppresses tumor growth in ACC models, downregulating key oncogenes such as MYB and MYC [56].
Combination Therapy Strategies
The complexity of ubiquitination networks in OACC suggests that combination therapies will likely be necessary for effective treatment. Research indicates that combining PRMT5 inhibitors with multi-kinase inhibitors like Lenvatinib produces stronger inhibitory effects on tumor growth than either agent alone [56]. This approach aligns with the concept of targeting multiple nodes in dysregulated pathways simultaneously to overcome compensatory mechanisms and treatment resistance.
Biomarker-Driven Patient Stratification
The heterogeneity of ubiquitination patterns in OACC supports the development of biomarker-guided treatment approaches. Patients exhibiting high expression of PRMT5 together with elevated MYB/MYC levels may derive particular benefit from PRMT5-directed therapies [56]. Additionally, the identification of a poor-prognosis subgroup representing approximately 20% of ACC patients with a unique embryonic stem cell-like gene expression signature enables more precise patient stratification for clinical trials [57].
This case study demonstrates the power of 4D label-free quantitative ubiquitination proteomics for comprehensively mapping the ubiquitinome in oral adenoid cystic carcinoma. The identification of 4152 ubiquitination sites on 1993 proteins, with significant dysregulation of 667 sites in tumor tissues, provides an unprecedented view of pathway alterations in this malignancy. The integration of these findings with established molecular features of OACC creates opportunities for developing targeted therapies that address the specific vulnerabilities of this aggressive cancer. The experimental protocols and analytical frameworks presented here offer a roadmap for extending ubiquitylomic profiling to other cancer types, advancing our broader understanding of ubiquitination networks in tumor biology and therapeutic resistance.
Optimizing Ubiquitylomics Data Quality: Addressing Technical Challenges in Cancer Tissue Analysis
The ubiquitin-proteasome system (UPS) is a crucial post-translational regulatory mechanism that controls protein stability, activity, and localization through reversible ubiquitination. In cancer research, ubiquitylomics analysis—the comprehensive study of ubiquitinated proteins—reveals significant alterations between cancerous and normal tissues. Studies across various cancers, including lung squamous cell carcinoma (LSCC) and oral adenoid cystic carcinoma (ACC), have identified thousands of differentially regulated ubiquitination sites and proteins, highlighting the UPS as a rich source of potential biomarkers and therapeutic targets [58] [4].
A major technical challenge in ubiquitylomics is preserving the native ubiquitination state of proteins during sample preparation. The inherent activity of deubiquitinating enzymes (DUBs) can rapidly remove ubiquitin modifications after cell lysis, leading to inaccurate representation of in vivo ubiquitination. This application note provides detailed protocols for inhibiting DUBs and optimizing lysis conditions to maintain authentic ubiquitination profiles for reliable cancer research.
Key Concepts and Molecular Targets
The Ubiquitination Machinery and Cancer Relevance
Ubiquitination involves a cascade of E1 (activating), E2 (conjugating), and E3 (ligating) enzymes that attach ubiquitin to substrate proteins. The process is reversible through the action of DUBs, which remove ubiquitin modifications. Ubiquitin chain topology, determined by linkage types through different lysine residues (K6, K11, K27, K29, K33, K48, K63), dictates functional outcomes, with K48-linked chains primarily targeting proteins for proteasomal degradation and K63-linked chains regulating signal transduction [58] [59].
Cancer tissues exhibit significant dysregulation of ubiquitination pathways. Quantitative ubiquitinomics of LSCC tissue identified 627 ubiquitin-modified proteins and 1,209 ubiquitination sites, with these proteins primarily involved in critical pathways including cell adhesion, signal transduction, and regulation of ribosome and proteasome complexes [58]. Similarly, ubiquitylomics analysis of oral ACC revealed 4,152 ubiquitination sites across 1,993 proteins, demonstrating the extensive remodeling of the ubiquitin landscape in cancer [4].
Deubiquitinating Enzymes as Therapeutic Targets in Cancer
DUBs have emerged as promising therapeutic targets due to their regulatory roles in cancer-relevant pathways. The human genome encodes approximately 100 DUBs, categorized into cysteine proteases (including USP, UCH, OTU, MJD, and MINDY families) and zinc-dependent metalloproteinases (JAMM/MPN+ family) [59]. Recent research highlights specific DUBs with significance in cancer biology:
- USP25 and USP46: Identified as key regulators in host-pathogen interactions in infected macrophages, with potential implications for cancer-related inflammation [60].
- BRCC36: A JAMM/MPN DUB that regulates inflammatory signaling by cleaving K63-linked polyubiquitin chains; exists in both cytoplasmic (BRISC) and nuclear (ARISC) complexes [61].
- USP16 and OTUD1: Implicated in cerebral ischemia-reperfusion injury with potential parallels to stress response pathways in cancer [59].
Table 1: Major DUB Families and Their Characteristics
| DUB Family | Catalytic Mechanism | Representative Members | Cancer-Relevant Functions |
|---|---|---|---|
| USP (Ubiquitin-Specific Protease) | Cysteine protease | USP25, USP46, USP16 | Regulation of inflammatory responses, cell cycle control, DNA damage repair |
| UCH (Ubiquitin C-Terminal Hydrolase) | Cysteine protease | UCHL1, UCHL3 | Neuronal development, oncogene stabilization |
| OTU (Ovarian Tumor Protease) | Cysteine protease | OTUD1, OTUD7b | Immune signaling regulation, TNF pathway modulation |
| MJD (Machado-Josephin Disease Protease) | Cysteine protease | ATXN3, JOSD1 | Protein quality control, endoplasmic reticulum-associated degradation |
| MINDY (Motif Interacting with Ub-containing Novel DUB Family) | Cysteine protease | MINDY1, MINDY2 | Preference for cleaving K48-linked ubiquitin chains |
| JAMM/MPN (JAB1/MPN/MOV34 Metalloenzyme) | Zinc-dependent metalloprotease | BRCC36, AMSH, PSMD14 | K63-linked ubiquitin chain editing, proteasomal function |
Experimental Protocols
Optimized Lysis Buffer Formulation for Ubiquitination Preservation
The following protocol has been optimized to preserve ubiquitination states during tissue and cell lysis, based on established methodologies for ubiquitin signalling analysis [62].
Reagents and Equipment:
- N-ethylmaleimide (NEM) or Iodoacetamide (IAA)
- Phenylmethylsulfonyl fluoride (PMSF)
- Protease Inhibitor Cocktail (without EDTA)
- Phosphatase Inhibitor Cocktail
- Dithiothreitol (DTT) - use with caution
- RIPA Buffer or NP-40 Alternative Lysis Buffer
- Pre-cooled Dounce homogenizer or sonicator
- Refrigerated centrifuge capable of 15,000 × g
Lysis Buffer Formulation:
- Base Buffer: 50 mM Tris-HCl (pH 7.5), 150 mM NaCl, 1% NP-40 Alternative
- DUB Inhibitors: 10-25 mM N-ethylmaleimide (NEM) or 20 mM Iodoacetamide (IAA)
- Protease Inhibitors: 1 mM PMSF, and commercial protease inhibitor cocktail according to manufacturer's instructions
- Phosphatase Inhibitors: Add phosphatase inhibitor cocktail according to manufacturer's instructions
- Additional Stabilizers: 5-10 mM EDTA or EGTA, 10% glycerol, 1 mM Sodium Orthovanadate
- Optional Additives: 0.1-0.5% SDS for difficult-to-lyse samples, 1% Sodium Deoxycholate
Preparation Notes:
- Prepare NEM fresh as a 500 mM stock in ethanol or DMSO immediately before use
- Avoid using DTT or β-mercaptoethanol in the initial lysis buffer as they will inactivate cysteine-targeting inhibitors like NEM
- Adjust pH to 7.5 after adding all components
Procedure:
- Pre-chill all equipment and buffers on ice
- For tissue samples: Flash-freeze in liquid nitrogen and pulverize using a mortar and pestle while frozen
- Add 5-10 volumes of ice-cold lysis buffer to cell pellet or pulverized tissue
- For tissues: Homogenize with 10-15 strokes in a Dounce homogenizer on ice
- For cells: Vortex vigorously and incubate on ice for 10-15 minutes
- Sonicate with 3-5 short bursts (5-10 seconds each) at low intensity with intervals for cooling
- Centrifuge at 15,000 × g for 15 minutes at 4°C to remove insoluble material
- Transfer supernatant to a fresh pre-chilled tube for immediate use or storage at -80°C
Critical Considerations:
- Sample Amount: Use sufficient starting material (recommended minimum: 10-20 mg tissue or 5-10 × 10^6 cells)
- Processing Time: Process samples quickly and maintain cold conditions throughout (4°C or below)
- Inhibitor Timing: Add protease and phosphatase inhibitors immediately before use
- DTT Addition: If needed for protein solubility, add DTT (1-5 mM) only after the initial lysis and deubiquitination prevention steps
Validation of Ubiquitination Preservation
After implementing the optimized lysis protocol, verification of ubiquitination preservation is essential before proceeding with ubiquitylomics analysis.
Immunoblotting Validation:
- Separate proteins by SDS-PAGE (8-12% gels) with appropriate molecular weight markers
- Transfer to nitrocellulose (NC) or polyvinylidene difluoride (PVDF) membranes [62]
- Block with 5% non-fat milk in TBST for 1 hour at room temperature
- Probe with anti-ubiquitin primary antibody (recommended: linkage-specific antibodies for key ubiquitin chain types)
- Incubate with HRP-conjugated secondary antibody
- Develop with enhanced chemiluminescence substrate
Expected Results:
- Successful preservation should show high-molecular-weight smearing characteristic of polyubiquitinated proteins
- Minimal signal in samples lysed without DUB inhibitors indicates insufficient preservation
Advanced Validation:
- Use of ubiquitin-binding entities (TUBEs) to enrich ubiquitinated proteins [62]
- Employ linkage-specific DUBs to verify chain topology preservation [62]
Small-Molecule DUB Inhibition for Functional Studies
Beyond preservation for analysis, pharmacological DUB inhibition represents a promising therapeutic strategy. Recent studies have identified several promising DUB inhibitors with potential applications in cancer research:
AZ-1: A small-molecule DUB inhibitor that significantly reduces intracellular bacterial loads in vitro and mitigates early disease severity in murine models. AZ-1 demonstrates broad-spectrum activity against multidrug-resistant pathogens and has shown potential for host-directed antimicrobial strategies [60].
BLUEs (BRISC Molecular Glues): First-in-class inhibitors that stabilize a 16-subunit human BRISC dimer in an autoinhibited conformation, selectively inhibiting BRISC over related complexes with the same catalytic subunit. BLUE treatment reduces interferon-stimulated gene expression and increases IFNAR1 ubiquitylation, offering a potential strategy to mitigate type I interferon-mediated diseases [61].
Application Protocol for DUB Inhibitors in Cell-Based Assays:
- Culture cells in appropriate medium with serum
- Prepare inhibitor stocks in DMSO or according to manufacturer's instructions
- Treat cells with optimized concentrations (e.g., AZ-1 at 10-50 μM, JMS-175-2 at 3.8 μM [60] [61])
- Incubate for predetermined time points (typically 4-24 hours)
- Harvest cells using optimized lysis buffer with DUB inhibitors
- Process samples for downstream ubiquitylomics analysis
Table 2: Selected DUB Inhibitors and Their Applications
| Inhibitor | Target | IC50/Effective Concentration | Mechanism of Action | Research Applications |
|---|---|---|---|---|
| AZ-1 | USP25 (and other DUBs) | Not specified in study | Small-molecule DUB inhibitor | Reduction of intracellular bacterial loads, potential host-directed therapy [60] |
| JMS-175-2 | BRISC complex | 3.8 μM | Molecular glue stabilizing autoinhibited conformation | Selective inhibition of BRISC over related complexes, reduction of interferon signaling [61] |
| FX-171-C | BRISC complex | 1.4 μM | Molecular glue (improved analog of JMS-175-2) | More potent inhibition of BRISC, maintained selectivity [61] |
| IU1 | USP14 | Varies by study | Proteasome-associated DUB inhibition | Neuroprotection studies, potential cancer applications [59] |
| Vialinin A | USP14 and UCHL5 | Varies by study | Dual inhibitor of proteasome-associated DUBs | Reduction of tau aggregation, oncoprotein stabilization [59] |
The Scientist's Toolkit: Essential Research Reagents
Table 3: Key Reagents for Ubiquitination State Preservation and Analysis
| Reagent Category | Specific Examples | Function | Application Notes |
|---|---|---|---|
| DUB Inhibitors | N-ethylmaleimide (NEM), Iodoacetamide (IAA) | Irreversible cysteine protease inhibition | Add fresh to lysis buffer; NEM preferred for broad-spectrum inhibition [62] |
| Protease Inhibitors | PMSF, Complete Protease Inhibitor Cocktail | General protease prevention | Use EDTA-free versions to avoid interfering with metallo-DUB inhibition [62] |
| Ubiquitin Linkage-Specific Antibodies | K48-linkage specific, K63-linkage specific | Detection of specific ubiquitin chain types | Essential for validating chain topology preservation [62] |
| Tandem Ubiquitin-Binding Entities (TUBEs) | Recombinant TUBE proteins | High-affinity ubiquitin chain binding | Enhance ubiquitinated protein recovery and prevent deubiquitination during processing [62] |
| Linkage-Specific DUBs | Recombinant OTUB1 (K48-specific), AMSH (K63-specific) | Validation of ubiquitin chain types | Used as tools to verify specific chain linkages in preserved samples [62] |
| Small-Molecule DUB Inhibitors | AZ-1, JMS-175-2, FX-171-C | Targeted DUB inhibition for functional studies | Applied to cells before lysis to study functional consequences of DUB inhibition [60] [61] |
Workflow and Pathway Diagrams
Experimental Workflow for Ubiquitination State Preservation
Ubiquitination Pathway and DUB Inhibition Mechanisms
Preserving native ubiquitination states through optimized lysis conditions and DUB inhibition is essential for accurate ubiquitylomics analysis in cancer research. The protocols detailed in this application note provide a robust framework for maintaining authentic ubiquitin profiles, enabling researchers to better characterize the ubiquitination landscape in cancerous versus normal tissues. As research continues to identify novel DUB inhibitors and refine methodological approaches, these techniques will become increasingly vital for identifying therapeutic targets and developing targeted interventions for cancer treatment.
The integration of small-molecule DUB inhibitors with advanced proteomic techniques represents a promising frontier in cancer research, potentially enabling not only improved analytical accuracy but also novel therapeutic strategies targeting the ubiquitin-proteasome system in cancer.
In ubiquitylomics, the low stoichiometry of ubiquitination poses a significant analytical challenge, particularly in cancerous tissues where ubiquitination dynamics influence protein stability, immune response, and drug resistance [63]. Efficient enrichment and sensitivity enhancement are critical to accurately profile ubiquitination events in malignant versus normal tissues. This document outlines standardized protocols and quantitative frameworks to address these challenges, enabling robust ubiquitylomics analysis for cancer research and therapeutic development.
Quantitative Comparison of Enrichment Methods
The following table summarizes the efficiency, sensitivity, and applicability of common enrichment strategies for ubiquitinated peptides. These metrics are derived from published workflows and optimized for cancerous tissue analysis [63] [64].
Table 1: Enrichment Methods for Low-Stoichiometry Ubiquitylomics
| Method | Efficiency (%) | Sensitivity (fmol) | Compatibility with Cancer Tissues | Key Limitations |
|---|---|---|---|---|
| Immunoaffinity (Anti-K-ε-GG) | 70–85 | 1–10 | High (e.g., LUAD, breast cancer) | Cross-reactivity with other PTMs |
| TiO₂/MOAC Chromatography | 60–75 | 10–50 | Moderate (requires high sample input) | Co-enrichment of phosphorylated peptides |
| UBiquitin-Binding Domains (UBDs) | 50–70 | 5–20 | Low (specific to ubiquitin topology) | Limited to intact ubiquitin conjugates |
| Chemical Derivatization | 65–80 | 2–15 | High (compatible with multiplexing) | Additional sample processing steps |
Key Insights:
- Immunoaffinity outperforms other methods in sensitivity and efficiency, making it ideal for precious cancer biopsies [64].
- Chromatographic methods (e.g., TiO₂) are cost-effective but suffer from reduced specificity in complex tissue lysates [65].
Experimental Protocols
Immunoaffinity-Based Enrichment for Cancer Tissues
Application: Isolation of ubiquitinated peptides from lung adenocarcinoma (LUAD) vs. normal lung tissues. Workflow:
- Tissue Lysis: Homogenize 20 mg of frozen tissue in RIPA buffer supplemented with 10 mM N-ethylmaleimide (NEM) and protease inhibitors.
- Digestion: Reduce with 5 mM DTT (30 min, 56°C), alkylate with 15 mM iodoacetamide (20 min, dark), and digest with trypsin (1:50 w/w, 37°C, 16 h).
- Desalting: Use C18 solid-phase extraction cartridges.
- Enrichment: Incubate peptides with anti-K-ε-GG antibody-conjugated beads (2 h, 4°C). Wash with PBS and elute with 0.1% TFA.
- LC-MS/MS Analysis:
- Column: C18 (75 µm × 25 cm, 2 µm particles).
- Gradient: 5–30% acetonitrile in 0.1% formic acid (90 min).
- Mass Spectrometer: Orbitrap-based DIA (Data-Independent Acquisition) with PASEF [64].
Sensitivity Enhancement via Pre-Fractionation
Protocol:
- Fractionate digested peptides using high-pH reverse-phase chromatography (10 fractions).
- Pool every second fraction to reduce complexity before immunoaffinity enrichment.
- Expected Outcome: 30% increase in ubiquitinated peptide identifications in low-input samples (e.g., 1 mg tissue) [64].
Visualization of Workflows and Signaling Pathways
Ubiquitylomics Analysis Workflow
Title: Workflow for Ubiquitylomics Analysis of Cancer Tissues
Ubiquitin-Mediated Signaling in LUAD
Title: Ubiquitin Signaling in Lung Adenocarcinoma
Research Reagent Solutions
Table 2: Essential Reagents for Ubiquitylomics in Cancer Research
| Reagent | Function | Example Product |
|---|---|---|
| Anti-K-ε-GG Antibody | Enrichment of ubiquitinated peptides via immunoaffinity | Cell Signaling Technology #5562 |
| N-Ethylmaleimide (NEM) | Inhibition of deubiquitinases (DUBs) to preserve ubiquitination signals | Sigma-Aldrich 04259 |
| Trypsin (Sequencing Grade) | Protein digestion for bottom-up proteomics | Promega V5280 |
| C18 Desalting Cartridges | Peptide cleanup and salt removal | Thermo Scientific 84850 |
| TMT/Isobaric Tags | Multiplexed quantification of ubiquitination in cancerous vs. normal tissues | Thermo Scientific A44520 |
Concluding Remarks
The protocols and workflows described here provide a standardized approach to overcome low-stoichiometry challenges in ubiquitylomics. By integrating optimized enrichment strategies with sensitivity-enhanced MS methods, researchers can achieve comprehensive ubiquitination profiling in cancerous tissues, facilitating the discovery of biomarkers and therapeutic targets [63] [64].
Ubiquitylomics, the large-scale study of protein ubiquitination, is crucial for cancer research, as it reveals the dynamics of post-translational modifications that regulate oncoprotein stability and tumor suppressor degradation [66] [67]. However, traditional ubiquitylomics approaches require substantial protein input, creating a significant barrier for clinically relevant research where tumor tissue samples are often microscale. This application note provides detailed protocols for reliable ubiquitylomics analysis from low-input samples, enabling robust comparison of cancerous and normal tissues.
Key Challenges in Low-Input Ubiquitylomics
Cancer research faces significant limitations with traditional preclinical models and sample availability [68]. For ubiquitylomics, these challenges are exacerbated by:
- Inherent sample scarcity: Primary tumor biopsies, patient-derived organoids, and laser-capture microdissected tissues yield limited protein amounts.
- Tumor heterogeneity: Requires analysis of multiple small samples to capture biological variability [68].
- Low stoichiometry of ubiquitination: Ubiquitinated proteins represent a small fraction of the total proteome, necessitating efficient enrichment [66] [67].
Quantitative Landscape of Ubiquitylomics Methods
Table 1: Comparison of Ubiquitin Enrichment Methods for Low-Input Samples
| Method | Principle | Sample Input | Sites Identified | Advantages | Limitations |
|---|---|---|---|---|---|
| K-ε-GG Antibody [66] [67] | Immunoaffinity enrichment of diGly remnant after trypsin digestion | 0.5-20 mg cell culture [66] | ~4,000-10,000/sample [66] | High specificity; Compatible with multiplexing | Cannot distinguish ubiquitin from other UBLs; Antibody bias |
| UbiSite [66] | Antibody against 13-mer LysC ubiquitin fragment | Up to 50 mg cell culture [66] | ~30,000/sample (deep ubiquitome) [66] | Reduced sequence bias; Deep coverage | Complex workflow; Higher input requirement |
| Pan-Ubiquitin Nanobody [69] | Protein-level IP using nanobody recognizing all ubiquitin chains | Not specified (typically 1-10 mg) | 52 potential substrates in RNF111 study [69] | Recognizes all chain types and monoubiquitination; No trypsin requirement prior to enrichment | Newer method with less validation |
Table 2: Mass Spectrometry Quantification Approaches for Ubiquitylomics
| Quantification Method | Principle | Sample Requirement | Multiplexing Capacity | Applications in Cancer Research |
|---|---|---|---|---|
| Label-Free [67] | Comparison of precursor ion intensities across runs | Higher (runs individually) | None | Identification of 158 ubiquitinated sites in pituitary adenomas [67] |
| SILAC [66] | Metabolic labeling with stable isotopes | Moderate | 2-3 conditions | Comparison of active/inactive ubiquitin machinery [66] |
| TMT [66] | Isobaric chemical tagging post-enrichment | Low (sub-milligram) | Up to 11 conditions | Detailed time courses; Multiple treatment conditions |
Detailed Microscale Protocol for Tissue Ubiquitylomics
Reagents and Equipment
Table 3: Essential Research Reagents for Microscale Ubiquitylomics
| Reagent/Category | Specific Examples | Function | Application Notes |
|---|---|---|---|
| Lysis Buffer | 8M Urea, 50mM Tris-HCl (pH 8.0), 75mM NaCl, Protease inhibitors | Efficient tissue disruption and protein solubilization | Add 20mM N-ethylmaleimide and 1× phosphatase inhibitors for PTM preservation |
| Enrichment Antibody | Anti-K-ε-GG (Cell Signaling Technology) [66] | Immunoaffinity capture of ubiquitinated peptides | Significant antibody bias noted; pre-clearing recommended [66] |
| Trypsin | Sequencing grade modified trypsin | Protein digestion to generate diGly-containing peptides | Optimized 1:20 enzyme-to-protein ratio for 16h at 37°C |
| Chromatography | C18 StageTips or commercial columns | Peptide desalting and separation | Use 2μg peptide load for nanoscale LC-MS/MS |
| Mass Spectrometry | Q-Exactive, Orbitrap Fusion series | High-sensitivity detection of ubiquitinated peptides | Data-Independent Acquisition (DIA) improves quantitation of low-abundance peptides [66] |
Step-by-Step Protocol for Low-Input Samples (1-5 mg)
Step 1: Tissue Processing and Protein Extraction
- Homogenize 1-5 mg frozen tissue in 100-200μL ice-cold lysis buffer using a handheld homogenizer.
- Sonicate 3×10 seconds at 20% amplitude, keeping samples on ice.
- Centrifuge at 16,000×g for 15 minutes at 4°C.
- Transfer supernatant to fresh tube and quantify protein using BCA assay.
- Aliquot 100μg protein for ubiquitome analysis, retaining 20μg for proteome comparison.
Step 2: Protein Digestion and Peptide Cleanup
- Reduce proteins with 5mM DTT (30 minutes, 25°C).
- Alkylate with 15mM iodoacetamide (30 minutes, 25°C in dark).
- Dilute urea concentration to 2M with 50mM Tris-HCl (pH 8.0).
- Digest with trypsin (1:20 enzyme-to-protein ratio) for 16h at 37°C.
- Acidify with 1% trifluoroacetic acid (TFA) to pH <3.
- Desalt peptides using C18 StageTips according to manufacturer's protocol.
Step 3: K-ε-GG Peptide Enrichment
- Resuspend peptides in 1mL immunoaffinity purification (IAP) buffer.
- Incubate with 10μL anti-K-ε-GG antibody-conjugated beads for 2h at 4°C with end-over-end mixing.
- Wash beads 3× with 1mL IAP buffer, then 2× with HPLC-grade water.
- Elute peptides with 0.2% TFA (2×50μL).
- Dry peptides in vacuum concentrator and store at -80°C until MS analysis.
Step 4: LC-MS/MS Analysis and Data Processing
- Resuspend peptides in 2% acetonitrile/0.1% formic acid.
- Load onto 25cm C18 column (75μm inner diameter) with 300nL/min flow rate.
- Use 120-minute gradient from 5% to 30% acetonitrile in 0.1% formic acid.
- Acquire data in data-dependent acquisition (DDA) or data-independent acquisition (DIA) mode.
- For DIA, use 4m/z isolation windows covering 400-900m/z range.
- Search data against human UniProt database using MaxQuant (for DDA) or DIA-NN (for DIA) with ubiquitination (K-ε-GG) as variable modification.
Signaling Pathways in Cancer Ubiquitylomics
The following diagrams illustrate key ubiquitination-regulated pathways in cancer, created using Graphviz DOT language with the specified color palette.
Technical Considerations for Low-Input Applications
Optimization Strategies
- Carrier protein approach: Add 50μg of digested non-human protein (e.g., yeast) to minimize sample loss during processing while not interfering with human database searching.
- Multiplexing: Implement TMT labelling post-enrichment (UbiFast protocol) to reduce MS instrument time and quantitative variability [66].
- Data acquisition: Utilize DIA-MS for improved quantification of low-abundance ubiquitinated peptides, enabling identification of >90,000 sites from limited material [66].
Quality Control Metrics
- Monitor tryptic digestion efficiency using internal standard peptides.
- Assess enrichment efficiency by comparing K-ε-GG peptide abundance pre- and post-enrichment.
- Include reference standards from well-characterized cell lines to normalize across batches.
- Match ubiquitome data with proteome quantification to distinguish regulatory versus degradative ubiquitination events [66].
The protocols detailed herein enable robust ubiquitylomics analysis from microscale cancer tissue samples, overcoming critical limitations in translational cancer research. By implementing these low-input strategies, researchers can comprehensively map ubiquitination landscapes in clinically relevant samples, accelerating the discovery of therapeutic targets in oncogenic signaling pathways.
In ubiquitomics analyses comparing cancerous and normal tissues, the high-throughput nature of mass spectrometry data presents a significant multiple testing problem. Without proper statistical correction, this can lead to a proliferation of false positive identifications of differentially ubiquitinated sites. Controlling the False Discovery Rate (FDR) is therefore a critical step in ensuring the biological validity and reproducibility of findings, allowing researchers to accurately localize dysregulated ubiquitination events with confidence. This application note details the integration of FDR methodologies and experimental protocols for robust site-specific ubiquitination analysis in cancer research.
The following tables summarize key quantitative benchmarks for FDR control and core components of the ubiquitination machinery relevant to cancer ubiquitomics.
Table 1: FDR Control Thresholds and Interpretations
| FDR Threshold (q) | Common Application Context | Interpretation |
|---|---|---|
| 0.01 | Confirmatory analysis; high-confidence biomarker discovery [70] | Up to 1% of significant findings are expected to be false positives |
| 0.05 | Standard for most discovery-phase ubiquitomics studies [71] [72] | Up to 5% of significant findings are expected to be false positives |
| 0.10 - 0.25 | Exploratory studies or initial QTL mapping with many traits [70] | Higher power for discovery while tolerating more false positives |
Table 2: Core Enzymatic Components of the Ubiquitination System
| Component | Approximate Number in Humans | Function in Ubiquitination |
|---|---|---|
| E1 Activating Enzymes | 2 [73] | Initiates ubiquitination by activating Ub in an ATP-dependent process |
| E2 Conjugating Enzymes | >30 [73] | Accepts Ub from E1 and collaborates with E3 for substrate transfer |
| E3 Ligases | ~600 [73] | Confers substrate specificity, catalyzing Ub transfer to target proteins |
| Deubiquitinases (DUBs) | ~100 [73] | Reverses ubiquitination by cleaving Ub from substrates |
Experimental Protocols
Protocol for In Vitro Ubiquitination Assay for E3 Ligase Substrate Validation
This protocol is used to validate whether a protein of interest is a substrate for a specific E3 ubiquitin ligase, a key step in functional follow-up of ubiquitomics hits [74].
Materials and Reagents:
- E1 Enzyme: 5 µM stock concentration
- E2 Enzyme: 25 µM stock concentration (Select based on E3 compatibility [74])
- E3 Ligase: 10 µM stock concentration (e.g., Candidate from ubiquitomics data)
- 10X E3 Ligase Reaction Buffer: 500 mM HEPES (pH 8.0), 500 mM NaCl, 10 mM TCEP
- Ubiquitin: 1.17 mM (10 mg/mL) stock
- MgATP Solution: 100 mM stock
- Substrate Protein: Protein of interest, purified (5-10 µM working concentration)
Procedure for a 25 µL Reaction:
- Reaction Setup: In a microcentrifuge tube, combine the components in the order listed to the indicated final working concentrations [74]:
- dH₂O to a final volume of 25 µL
- 2.5 µL of 10X E3 Ligase Reaction Buffer (1X final)
- 1 µL Ubiquitin (~100 µM final)
- 2.5 µL MgATP Solution (10 mM final)
- X µL Substrate Protein (5-10 µM final)
- 0.5 µL E1 Enzyme (100 nM final)
- 1 µL E2 Enzyme (1 µM final)
- X µL E3 Ligase (1 µM final)
- Negative Control: For a negative control, set up a parallel reaction where the MgATP Solution is replaced with an equivalent volume of dH₂O.
- Incubation: Incubate the reaction mixture in a 37°C water bath for 30-60 minutes.
- Reaction Termination:
- For SDS-PAGE analysis: Add 25 µL of 2X SDS-PAGE sample buffer.
- For downstream applications: Add 0.5 µL of 500 mM EDTA (20 mM final) or 1 µL of 1 M DTT (100 mM final).
- Analysis:
- Separate proteins by SDS-PAGE.
- Visualize total protein with Coomassie blue staining. A successful reaction shows a characteristic smear or ladder of higher molecular weight bands corresponding to ubiquitinated species.
- Verify ubiquitination via Western blot using anti-ubiquitin and/or anti-substrate antibodies.
Protocol for Proximal-Ubiquitomics for DUB Substrate Identification
This methodology enriches for direct substrates of Deubiquitinases (DUBs) by combining proximity labeling with ubiquitin remnant profiling, ideal for identifying cancer-relevant DUB pathways [75].
Workflow Overview:
- Cell Engineering: Express the DUB of interest (e.g., USP30) as a fusion protein with the APEX2 biotin ligase in a relevant cancer cell line.
- Proximity Labeling:
- Treat cells with a DUB-specific inhibitor or a vehicle control.
- Incubate with biotin-phenol substrate.
- Induce rapid, localized protein biotinylation (within 1 minute) by adding H₂O₂.
- Cell Lysis and Streptavidin Enrichment: Lyse cells and capture biotinylated proteins using streptavidin beads.
- On-Bead Digestion: Digest the captured proteins on the beads with trypsin.
- Ubiquitin Remnant Peptide Enrichment: Enrich for ubiquitinated peptides from the resulting peptide mixture using K-ε-GG remnant motif antibodies.
- Mass Spectrometric Analysis: Analyze the enriched peptides by LC-MS/MS to identify and quantify site-specific ubiquitination events within the DUB's microenvironment.
Data Analysis and FDR Application Workflow
The pathway below outlines the core steps for processing ubiquitomics MS data, from raw spectrum to localized, high-confidence ubiquitination sites, incorporating FDR control at critical stages.
Implementing FDR Control for Ubiquitomics
The Benjamini-Hochberg (BH) procedure is a standard method for FDR control. The following steps should be applied to the p-values obtained for each potential ubiquitination site (e.g., from a statistical test comparing cancer vs. normal) [70] [72]:
- Rank P-values: Sort all tested p-values from smallest to largest, so that ( p{(1)} \leq p{(2)} \leq \ldots \leq p_{(V)} ), where ( V ) is the total number of tests (ubiquitination sites).
- Find Critical Value: For a desired FDR level ( q ) (e.g., 0.05), find the largest rank ( i ) for which: ( p_{(i)} \leq \frac{i \times q}{V} )
- Threshold Application: Reject the null hypothesis (i.e., declare a site as significantly differentially ubiquitinated) for all tests with ( p{(i)} \leq p{\text{critical}} ).
Important Consideration for Directional Inference: Standard FDR control applied to two-tailed p-values ensures control globally across all discoveries but not within subsets (e.g., only upregulated sites). If directional claims are required, FDR should be applied separately to the p-values from each tail of the distribution [72].
The Scientist's Toolkit: Research Reagent Solutions
Table 3: Essential Reagents for Ubiquitination Functional Studies
| Reagent / Solution | Function / Application | Example Details / Notes |
|---|---|---|
| 10X E3 Ligase Reaction Buffer | Provides optimal pH and ionic strength for in vitro ubiquitination conjugation reactions [74]. | 500 mM HEPES (pH 8.0), 500 mM NaCl, 10 mM TCEP (reducing agent). |
| MgATP Solution | Essential energy source for the E1-mediated activation of ubiquitin [74]. | Typically used at 10 mM final concentration in reaction buffer. |
| K-ε-GG Ubiquitin Remnant Antibody | Immunoenrichment of tryptic peptides containing the di-glycine remnant left after ubiquitination; critical for MS-based ubiquitome profiling [75]. | Used in proteomic workflows to isolate ubiquitinated peptides from complex lysates. |
| PROTAC Molecules | Proteolysis-Targeting Chimeras; bifunctional molecules that recruit E3 ligases to target proteins of interest, inducing their degradation [73]. | Emerging therapeutic strategy; can be used as chemical probes to validate targets. |
| Ubiquitin Variants (UbVs) | Engineered ubiquitin molecules designed to act as potent and selective inhibitors of specific DUBs or E3 ligases [73]. | Useful for probing the function of individual enzymes in the ubiquitin system. |
Signaling Pathway and Experimental Logic Diagram
The following diagram integrates the core concepts of ubiquitin signaling in cancer with the associated experimental and data processing workflows.
Protein ubiquitylation is a pivotal and reversible post-translational modification that regulates virtually all cellular processes, including protein stability, cell differentiation, and immunity [63]. This widespread impact is achieved through a diverse set of enzymes capable of generating structurally and functionally distinct ubiquitin modifications on proteins, creating a complex "ubiquitin code" that governs cellular homeostasis [24]. The complexity of protein ubiquitylation has presented significant challenges in identifying ubiquitylated proteins and characterizing their functional significance. Ubiquitylomics, defined as the mass spectrometry-enabled global analysis of ubiquitin modifications, offers a powerful tool for deciphering this code by enabling in-depth analysis of proteins and their ubiquitination status [24].
In cancer biology, ubiquitination regulators (UBRs) including E1 ubiquitin-activating enzymes, E2 ubiquitin-conjugating enzymes, E3 ubiquitin-ligases, and deubiquitinases (DUBs) have emerged as critical players in tumorigenesis [63]. Dysregulation of UBRs can lead to destabilization of biological processes and promote serious human diseases, including cancer [63]. Many UBRs, particularly E3 ubiquitin ligases and DUBs, have been identified as potential drug targets for cancer therapy [63]. The integration of ubiquitylomics with genomic and proteomic datasets provides unprecedented opportunities to understand the molecular mechanisms driving cancer progression and to identify novel therapeutic targets. This application note outlines detailed protocols for cross-platform validation of ubiquitylomic data within the context of cancerous versus normal tissue research, specifically focusing on experimental design, sample preparation, data integration, and analytical frameworks.
Key Ubiquitylomics Methodologies and Workflows
Sample Preparation Considerations for Ubiquitylomics
Preserving protein ubiquitylation at the point of sample collection is an essential step in obtaining a robust readout, as ubiquitylated proteins have low stoichiometry compared to non-ubiquitylated proteins and can be highly transient [24]. DUBs display promiscuous activity when released in tissue or cell homogenates, making proper inhibition critical. The following steps are essential for sample integrity:
Inhibition of Deubiquitylating Enzymes: Include DUB inhibitors such as EDTA/EGTA (to inhibit metallo-proteinases) and 2-chloroacetamide/Iodoacetamide/N-ethylmaleimide/PR-619 (to inhibit cysteine proteinases) in the lysis buffer [24]. Unlike the addition of standard protease inhibitors, it is not standard practice to include DUB inhibitors at recommended concentrations, making this a crucial consideration.
Proteasome Inhibition: To capture degradation-prone proteins, proteasome inhibitors such as bortezomib and MG-132 are often added to cells for short periods prior to lysis. However, due to the damaging consequences of preventing protein degradation, proteasome inhibitors are less suitable for in vivo studies and may display off-target effects including increased compensatory degradation pathways like autophagy [24].
Sample Solubilization: The chosen method of sample preparation should be tailored toward the type of proteins being studied. For example, transmembrane proteins are more hydrophobic than globular proteins and may require specialized protocols for optimal extraction and recovery [24].
Advanced Ubiquitylomics Profiling Techniques
Recent methodological advances have significantly improved the sensitivity, depth, and throughput of ubiquitylomics analyses. The UbiFast method represents a breakthrough in highly multiplexed measurement of ubiquitylation in tissues and primary cells using sub-milligram amounts of sample [41]. This protocol enables quantification of approximately 10,000 ubiquitylation sites from as little as 500 μg peptide per sample in a TMT10plex experiment in approximately 5 hours [41].
Key innovations in the UbiFast method include:
On-Antibody TMT Labeling: K-ε-GG peptides are labeled with TMT reagents while still bound to the anti-K-ε-GG antibody, protecting the di-glycyl remnant from derivatization [41]. This approach increases sensitivity, reduces TMT-based contaminant side-products, and eliminates the need for offline fractionation prior to MS measurement.
Optimized Labeling Conditions: 10-minute labeling with 0.4 mg of TMT reagent provides the best balance of identified TMT-labeled K-ε-GG peptides and completeness of labeling (>92%) for K-ε-GG peptides bound to anti-K-ε-GG antibody [41].
High-Field Asymmetric Waveform Ion Mobility Spectrometry (FAIMS): This technology is used to improve quantitative accuracy for post-translational modification analysis [41].
Table 1: Comparison of Ubiquitylomics Profiling Methods
| Method Parameter | Traditional Approach | UbiFast Method | Advantages |
|---|---|---|---|
| Sample Input | 1-7 mg per sample | 500 μg per sample | Enables analysis of limited samples |
| Multiplexing Capacity | SILAC (3-plex) | TMT10-plex | Higher throughput |
| Processing Time | ~24 hours | ~5 hours | Rapid profiling |
| Sensitivity | 5,000-9,000 sites | ~10,000 sites | Deeper coverage |
| Applications | Cell lines | Tissues and primary cells | Broader applicability |
Ubiquitin Enrichment Strategies
Enrichment of ubiquitylated peptides is typically achieved using antibodies that recognize the di-glycyl remnant (K-ε-GG) created when trypsin cleaves ubiquitylated proteins [41]. This antibody-based enrichment has been the breakthrough that made comprehensive profiling of ubiquitylation sites by LC-MS/MS possible [41]. Alternative enrichment approaches include:
Tandem Ubiquitin Binding Entities (TUBEs): Recombinant reagents with enhanced and selective affinity towards monoubiquitin or polyubiquitin chains, which can protect ubiquitin signals from deubiquitylases and interfere with proteasomal degradation [24].
Ubiquitin Binding Domains: Utilizing domains from various proteins that evolved to recognize ubiquitin signals, such as the proteasome shuttle-factors Dsk2 from yeast S. cerevisiae or UBQLN1 from humans [24].
Integration with Multi-Omics Datasets: A Case Study in Lung Adenocarcinoma
Integrative multi-omics analysis demonstrates the power of combining ubiquitylomics with genomic and proteomic datasets to uncover novel insights into cancer biology. A comprehensive study of lung adenocarcinoma (LUAD) revealed how ubiquitination regulators influence tumor classification, tumor microenvironment, and immunotherapy response [63].
Identification of Hub Ubiquitination Regulators
Through analysis of protein-protein interaction networks of UBRs correlated with cancer hallmark-related pathways, researchers identified 17 hub UBRs using four topological algorithms (EPC, Degree, MNC, and Closeness) [63]. These hub UBRs showed widespread genetic alterations and expression perturbations in LUAD, with their high expression generally detrimental to patient survival [63].
Genetic and transcriptional analysis revealed:
Somatic Mutations: Occurred in 68 of 616 LUAD patients (11.04%), with BRCA1 (3%) having the highest mutation frequency, followed by BARD1 (2%) [63].
Copy Number Variations (CNV): Hub UBRs including DTL and UBE2T exhibited higher frequencies of CNV amplification, while CDC34 and UBA7 showed higher frequencies of CNV loss [63].
Transcriptional Dysregulation: Most hub UBRs were overexpressed in cancer patients, with their expressions highly correlated and mostly positively correlated, suggesting extensive interactions between them [63].
Ubiquitination Subtyping and Clinical Implications
Based on the expression profiles of hub UBRs, LUAD patients can be classified into two ubiquitination subtypes with significantly different characteristics [63]. These subtypes exhibit dramatic differences across multiple dimensions:
- Survival outcomes
- Expression levels of hub UBRs
- Mutation burden
- Female predominance
- Immune infiltration profiles
- Drug response patterns
A scoring system for evaluating ubiquitination status in individual LUAD patients, called the ubiquitination-related risk (UBrisk) score, was established [63]. Patients with low UBrisk scores were more likely to benefit from immunotherapy, highlighting the clinical translational potential of ubiquitylomics profiling in guiding treatment decisions [63].
Table 2: Key Ubiquitination Regulators in Lung Adenocarcinoma
| UBR Category | Example Genes | Functional Role | Therapeutic Potential |
|---|---|---|---|
| Writers (E3 Ligases) | UBE2T, AURKA, CDC20 | Add ubiquitin molecules to substrate proteins | Targets for small-molecule inhibitors |
| Erasers (DUBs) | BIRC3 | Remove ubiquitin from substrate proteins | Potential drug targets |
| Readers | Proteins with UBD/ULD domains | Recognize ubiquitination modifications | Modulators of downstream events |
Experimental Protocols for Cross-Platform Validation
Integrated Ubiquitylomics Workflow for Cancer vs. Normal Tissue Analysis
The following detailed protocol outlines a comprehensive approach for cross-platform validation of ubiquitylomics data in the context of cancerous versus normal tissues:
Detailed Protocol Steps
Sample Preparation and Lysis
Tissue Collection and Homogenization:
- Collect matched cancerous and normal tissue samples (minimum 50-100 mg each).
- Immediately flash-freeze in liquid nitrogen and store at -80°C until processing.
- Homogenize tissues in pre-cooled lysis buffer (8 M urea, 50 mM Tris-HCl, pH 8.0) supplemented with DUB inhibitors (50 μM PR-619, 5 mM N-ethylmaleimide) and protease inhibitors [24] [41].
Protein Extraction and Digestion:
- Sonicate samples on ice using a high-intensity ultrasonic processor.
- Remove debris by centrifugation at 12,000 × g for 10 minutes at 4°C.
- Quantify protein concentration using BCA assay.
- Reduce proteins with 5 mM DTT for 30 minutes at 56°C, then alkylate with 11 mM IAA for 15 minutes at room temperature in the dark.
- Digest proteins with trypsin (1:50 ratio) overnight at 37°C.
- Desalt peptides using C18 SPE columns and quantify peptide concentration.
Ubiquitinated Peptide Enrichment and Labeling
K-ε-GG Peptide Enrichment:
On-Antibody TMT Labeling:
- While peptides are bound to beads, resuspend in 100 mM TEAB buffer.
- Add TMT reagent (0.4 mg per sample) and incubate for 10 minutes at room temperature [41].
- Quench the reaction with 5% hydroxylamine for 15 minutes.
- Combine labeled samples from multiple conditions (cancer vs. normal replicates).
Peptide Elution and Cleanup:
- Elute peptides from beads with 0.1% trifluoroacetic acid.
- Desalt using C18 ZipTips and dry by vacuum centrifugation.
LC-MS/MS Analysis
Chromatographic Separation:
- Use a NanoElute UHPLC system with a C18 reversed-phase column.
- Separate peptides with a linear gradient from 7% to 24% acetonitrile in 42 minutes, followed by increase to 32% in 12 minutes and to 80% in 3 minutes.
Mass Spectrometry Analysis:
- Use a timsTOF Pro mass spectrometer with a nanoelectrospray ion source.
- Operate in data-dependent acquisition with PASEF mode enabled.
- Apply FAIMS compensation voltages for improved PTM quantification [41].
Multi-Omics Data Integration Protocol
Genomic Data Analysis:
- Process whole exome or genome sequencing data to identify somatic mutations and copy number variations in ubiquitination pathway genes.
- Use GATK best practices for variant calling and ASCAT for CNV analysis.
Transcriptomic Profiling:
- Analyze RNA-seq data to quantify expression of ubiquitination regulators.
- Perform differential expression analysis using DESeq2 or similar tools.
Proteomic Data Processing:
- Process raw MS data using MaxQuant or Spectronaut with appropriate databases.
- Normalize protein intensities and perform statistical analysis.
Cross-Platform Integration:
- Use unsupervised clustering to identify ubiquitination subtypes based on hub UBR expression [63].
- Calculate UB_risk scores using Cox regression models incorporating clinical outcomes.
- Perform pathway enrichment analysis using Gene Ontology, KEGG, and Hallmark gene sets.
The Scientist's Toolkit: Essential Research Reagents and Materials
Table 3: Essential Research Reagents for Ubiquitylomics Studies
| Reagent Category | Specific Examples | Function & Application | Key Considerations |
|---|---|---|---|
| DUB Inhibitors | PR-619, N-ethylmaleimide, 2-chloroacetamide | Prevent deubiquitylation during sample processing | Critical for preserving ubiquitin signals; use in lysis buffer [24] |
| Proteasome Inhibitors | MG-132, Bortezomib | Stabilize degradation-prone ubiquitylated proteins | Limited in vivo use due to toxicity and compensatory pathways [24] |
| Enrichment Reagents | Anti-K-ε-GG antibody beads, TUBEs | Isolate ubiquitylated peptides/proteins | Choice affects specificity and depth of coverage [24] [41] |
| Isobaric Labels | TMT10/11-plex, TMTpro | Enable multiplexed quantification | On-antibody labeling prevents epitope masking [41] |
| Chromatography | C18 columns, UHPLC systems | Peptide separation before MS | High-resolution separation improves identification |
| Mass Spectrometry | timsTOF Pro, Orbitrap platforms | Ubiquitylation site identification | FAIMS enhances PTM quantification [41] |
Data Analysis and Interpretation Framework
Ubiquitylomics Data Processing
The analysis of ubiquitylomics data requires specialized computational approaches:
Ubiquitylation Site Identification:
- Search MS/MS spectra against appropriate protein databases using search engines such as MaxQuant, Andromeda, or MSFragger.
- Set variable modifications to include GlyGly remnant on lysine (+114.0428 Da).
- Apply false discovery rate (FDR) thresholds (typically <1%) at the peptide and protein levels.
Quantitative Analysis:
- Extract TMT reporter ion intensities for ubiquitylation sites.
- Normalize intensities across channels using median normalization or similar approaches.
- Perform statistical testing (e.g., t-tests, ANOVA) to identify significantly altered ubiquitylation sites between cancerous and normal tissues.
Bioinformatic Functional Analysis:
- Identify enriched pathways and processes among proteins with altered ubiquitylation using overrepresentation analysis or gene set enrichment analysis.
- Analyze ubiquitin chain topology preferences using spectral counts or quantitative data.
- Integrate with known ubiquitin-binding domains to predict downstream effects.
Visualization and Pathway Mapping
Concluding Remarks
The integration of ubiquitylomics with proteomic and genomic datasets represents a powerful approach for advancing our understanding of cancer biology and developing novel therapeutic strategies. The protocols outlined in this application note provide a framework for cross-platform validation that enables researchers to move beyond correlation to establish causal relationships between ubiquitin signaling and cancer phenotypes. As the field continues to evolve, methodological improvements in sensitivity, throughput, and computational analysis will further enhance our ability to decipher the complex ubiquitin code in cancer and normal tissues. The application of these integrated approaches holds significant promise for identifying novel biomarkers, therapeutic targets, and treatment strategies in precision oncology.
Translating Ubiquitylomics Findings: Biomarker Discovery and Therapeutic Targeting
Ubiquitination, a pivotal post-translational modification, involves the covalent attachment of ubiquitin to target proteins, thereby regulating their stability, activity, and localization [27] [77]. This process is catalyzed by a sequential enzymatic cascade involving ubiquitin-activating (E1), conjugating (E2), and ligase (E3) enzymes [27] [78]. The ubiquitin-proteasome system (UPS) is responsible for 80–90% of cellular proteolysis and governs approximately 80% of cellular protein degradation in eukaryotic cells, playing crucial roles in cell cycle regulation, DNA repair, signal transduction, and immune responses [27] [79]. Dysregulation of ubiquitinating and deubiquitinating enzymes is a common feature in various cancers, contributing to oncogenic processes through multiple mechanisms, including altered protein degradation, disrupted DNA repair, and rewired cellular signaling pathways [27] [77]. The reversible nature of ubiquitination, mediated by deubiquitinases (DUBs), adds another layer of complexity to its regulatory functions in cellular homeostasis and tumorigenesis [27].
Ubiquitination Signatures Across Cancers
Pan-Cancer Ubiquitination Patterns
Comprehensive proteomic characterization of human cancers has revealed distinct ubiquitination signatures that differentiate malignant from normal tissues. A mass spectrometry-based study analyzing 16 major cancer types identified 8,527 proteins, including 2,458 tissue-enriched proteins, with ubiquitination-related pathways frequently dysregulated across malignancies [15]. The expression of ubiquitin D (UBD), a key member of the ubiquitin-like modifier family, is significantly elevated in 29 cancer types and correlates with poor prognosis and higher histological grades [78]. Genetic alterations in ubiquitination pathway components, particularly gene amplifications, are associated with reduced overall survival rates in pan-cancer analyses [78]. Epigenetic dysregulation, including reduced promoter methylation of UBD in 16 cancer types, further contributes to aberrant ubiquitination in tumor tissues [78].
Table 1: Ubiquitination-Related Protein Alterations in Selected Cancer Types
| Cancer Type | Key Ubiquitination Alterations | Functional Consequences | Prognostic Significance |
|---|---|---|---|
| Hepatocellular Carcinoma | UBE2C upregulation [80] | Promotes proliferation, invasion, metastasis [80] | Correlates with poor survival [80] |
| Colorectal Cancer | USP48 overexpression stabilizes SQSTM1 [81] | Inhibits autophagy, enhances proliferation [81] | Independent risk factor [81] |
| Thyroid Carcinoma | UPS prognostic signature (6 genes) [79] | Modifies immune microenvironment [79] | Predicts patient outcomes [79] |
| Breast Cancer | Reduced H2B monoubiquitination [77] | Alters estrogen receptor α transcriptional activity [77] | Associated with tumor progression [77] |
| Ovarian Cancer | BARD1, BRCA2, FANCA, BRCA1 ubiquitination markers [82] | Impacts DNA repair pathways [82] | Stratifies patient survival risk [82] |
Cancer-Type Specific Ubiquitination Profiles
Different cancer types exhibit distinct ubiquitination patterns that reflect their tissue of origin and driver mutations. In hepatocellular carcinoma (HCC), ubiquitination-related genes are significantly upregulated and correlate with key processes including cell cycle regulation, DNA repair, metabolic reprogramming, and p53 signaling [80]. The E2 conjugating enzyme UBE2C emerges as a critical regulator promoting HCC cell proliferation, invasion, and metastasis through in vitro validation experiments [80]. Colorectal cancer progression is driven by USP48-mediated deubiquitination of sequestosome 1 (SQSTM1) at K420, which inhibits autophagy and enhances malignant phenotypes [81]. Thyroid carcinoma exhibits a unique ubiquitin-proteasome system prognostic signature comprising six genes that effectively stratify patients into distinct risk categories with different clinical outcomes and immune microenvironment characteristics [79].
Analytical Methods for Ubiquitination Analysis
Proteomic Profiling of Ubiquitination
Mass spectrometry-based approaches represent the cornerstone for comprehensive ubiquitination analysis in cancer tissues. Data-independent acquisition (DIA) mass spectrometry, also called Sequential Window Acquisition of all THeoretical fragment ion spectra (SWATH), has emerged as a powerful alternative to data-dependent acquisition methods, minimizing stochastic precursor ion selection and improving sampling efficiency [15]. The DIA workflow involves several critical steps: (1) protein extraction from tissue samples (typically 20-30 mg), (2) tryptic digestion to generate peptides, (3) peptide desalting, (4) liquid chromatography tandem mass spectrometry analysis using 120-minute gradients, and (5) spectral library generation for protein identification and quantification [15]. This approach enables reproducible quantification of thousands of proteins across multiple samples, with studies demonstrating excellent correlation coefficients (>0.95) between technical replicates [15]. For ubiquitination-specific analyses, enrichment of ubiquitinated peptides prior to MS analysis using ubiquitin remnant motifs or ubiquitin-binding domains significantly enhances detection sensitivity for this subproteome.
Bioinformatics and Multi-Omics Integration
Computational approaches are essential for interpreting ubiquitination signatures in the context of cancer biology. Weighted gene co-expression network analysis (WGCNA) effectively aggregates highly correlated genes into modules and evaluates their associations with cancer phenotypes [79]. Differential expression analysis of ubiquitination-related genes between tumor and normal tissues identifies candidate drivers of oncogenesis, with proteins showing >2-fold change and adjusted p-value <0.05 considered biologically significant [15]. Multi-omics integration strategies combine ubiquitination proteomics with genomic, transcriptomic, and epigenomic data to construct comprehensive regulatory networks [83]. Single-sample Gene Set Enrichment Analysis (ssGSEA) estimates immune cell abundance in individual samples based on ubiquitination marker genes, enabling correlation of ubiquitination patterns with tumor microenvironment composition [79] [78]. These bioinformatics pipelines facilitate the construction of prognostic models, identification of therapeutic targets, and discovery of biomarkers for cancer diagnosis and treatment response prediction.
Experimental Protocols
Tissue Processing and Protein Extraction Protocol
Purpose: To isolate high-quality proteins from cancer and normal matched tissues for ubiquitination analysis.
Reagents and Materials:
- Fresh or flash-frozen tissue samples (cancer and normal adjacent)
- Liquid nitrogen for tissue preservation
- RIPA lysis buffer (Sigma-Aldrich) with protease and phosphatase inhibitors
- Bicinchoninic acid (BCA) protein assay kit
- Pre-chilled PBS
- Dithiothreitol (DTT) and iodoacetamide
Procedure:
- Tissue Collection and Preservation: Collect tumor and matched normal adjacent tissues (at least 30 mg each) during surgical resection. Immediately flash-freeze in liquid nitrogen, ensuring cold ischemia time is less than 30 minutes [15].
- Tissue Homogenization: Grind frozen tissues to fine powder under liquid nitrogen using pre-chilled mortar and pestle.
- Protein Extraction: Add RIPA buffer (500 μL per 30 mg tissue) supplemented with complete protease and phosphatase inhibitors. Incubate on ice for 30 minutes with occasional vortexing [79].
- Clarification: Centrifuge lysates at 14,000 × g for 15 minutes at 4°C. Transfer supernatant to new pre-chilled tubes.
- Protein Quantification: Determine protein concentration using BCA assay according to manufacturer's protocol. Adjust all samples to uniform concentration (1-2 μg/μL) with RIPA buffer.
- Reduction and Alkylation: Add DTT to 5 mM final concentration, incubate at 56°C for 30 minutes. Then add iodoacetamide to 15 mM final concentration, incubate in dark at room temperature for 30 minutes.
- Quality Assessment: Confirm protein integrity by SDS-PAGE with Coomassie staining. Store aliquots at -80°C until analysis.
Technical Notes: Maintain samples on ice throughout processing unless specified. Include quality control pools by combining equal protein amounts from all samples for normalization.
Ubiquitination Site Enrichment and DIA-MS Analysis
Purpose: To specifically enrich and quantify ubiquitinated peptides from complex tissue digests.
Reagents and Materials:
- Trypsin (sequencing grade)
- C18 desalting columns
- Ubiquitin remnant motif enrichment kits (e.g., PTMScan)
- Data-Independent Acquisition mass spectrometer (Q-Exactive HF-X)
- EASY-nLC 1200 system
- Indexed retention time (iRT) peptides
Procedure:
- Trypsin Digestion: Add trypsin at 1:50 enzyme-to-protein ratio. Incubate at 37°C for 16 hours [15].
- Peptide Desalting: Desalt peptides using C18 columns according to manufacturer's instructions. Lyophilize and reconstitute in 3% acetonitrile/0.1% formic acid.
- Ubiquitin Remnant Motif Enrichment: Utilize ubiquitin branch point motif antibodies (e.g., diGly remnant motif) to enrich ubiquitinated peptides following manufacturer's protocol.
- LC-MS/MS Analysis:
- Load approximately 1 μg peptides onto 28-cm self-packed C18 column
- Implement 120-minute gradient: 2-30% buffer B (0.1% FA, 80% ACN) over 94 minutes
- Perform DIA-MS with full MS1 scan (400-1000 m/z, resolution 120,000)
- Acquire MS2 spectra with 50 overlapping windows (isolation width 12 m/z, NCE 30%)
- Spectral Library Generation: Create multi-cancer spectral library by searching DIA data against human protein sequences from UniProt/Swiss-Prot using Pulsar algorithm (Spectronaut Pulsar X) with false discovery rate set at 1% [15].
Technical Notes: Include iRT peptides in all samples for retention time alignment. Perform quality control injections to assess reproducibility (target CV <15%).
Table 2: Research Reagent Solutions for Ubiquitination Analysis
| Reagent/Category | Specific Examples | Function/Application | Technical Notes |
|---|---|---|---|
| Mass Spectrometry Systems | Q-Exactive HF-X with EASY-nLC 1200 [15] | High-resolution DIA proteomic profiling | Enables comprehensive fragmentation mapping |
| Sample Preparation Kits | RIPA buffer with protease/phosphatase inhibitors [79] | Protein extraction while preserving modifications | Critical for maintaining ubiquitination states |
| Ubiquitin Enrichment Reagents | Ubiquitin remnant motif antibodies (diGly) [15] | Selective enrichment of ubiquitinated peptides | Essential for detecting low-abundance ubiquitination |
| Chromatography Columns | Self-packed C18 columns (1.9 μm/120 Å) [15] | Peptide separation prior to MS analysis | 28-cm length provides superior resolution |
| Bioinformatics Tools | Spectronaut Pulsar X, IOBR R package [79] [15] | DIA data analysis, immune infiltration estimation | Enables ubiquitination signature deconvolution |
Functional Validation of Ubiquitination Targets
Purpose: To validate the biological significance of differentially ubiquitinated proteins identified through proteomic screening.
Reagents and Materials:
- HCC cell lines (Huh7, Hep3B)
- DMEM with 10% FBS
- Lipofectamine 3000
- UBE2C-specific shRNA constructs
- Transwell chambers with Matrigel
- CCK-8 assay kit
- Wound healing assay tools
Procedure:
- Gene Knockdown:
- Culture Huh7 and Hep3B cells in DMEM with 10% FBS at 37°C in 5% CO₂
- Transfect cells with UBE2C-specific shRNA or negative control using Lipofectamine 3000 [80]
- After 24 hours, transfer to fresh medium containing 2.0 μg/mL puromycin for selection
- Confirm knockdown efficiency by qRT-PCR after 48 hours
- Proliferation Assay:
- Seed transfected cells into 96-well plates (2,500 cells/well)
- Add 10 μL CCK-8 reagent to each well and incubate for 4 hours at 37°C
- Measure absorbance at 450 nm using microplate reader [80]
- Migration and Invasion Assays:
- For migration: Seed 5 × 10⁴ cells into Transwell chambers without Matrigel
- For invasion: Seed 5 × 10⁴ cells into Transwell chambers coated with Matrigel
- Incubate for 24 hours, fix with 4% paraformaldehyde, stain with 0.1% crystal violet
- Count cells in five random fields using light microscope [80]
- Wound Healing Assay:
- Grow transfected cells in 6-well plates to 80% confluence
- Create uniform scratch with sterile 200 μL pipette tip
- Wash with PBS, add serum-free medium
- Document wound closure at 0 and 24 hours using inverted microscope [80]
Technical Notes: Perform all functional assays in triplicate with appropriate controls. Include rescue experiments to confirm specificity.
Ubiquitination-Mediated Cancer Pathways
Key Regulatory Circuits in Oncogenesis
Ubiquitination regulates multiple hallmarks of cancer through diverse mechanisms. The RAS proteins, frequently mutated oncoproteins in human cancers, are dynamically regulated by ubiquitination which controls their stability, membrane localization, and signaling transduction [84]. Different RAS isoforms (KRAS4A, KRAS4B, NRAS, and HRAS) exhibit distinct ubiquitination patterns that contribute to their functional disparities in cancer progression [84]. The ubiquitin-specific protease USP48 drives colorectal cancer malignancy by interacting with and deubiquitinating sequestosome 1 (SQSTM1) at K420, thereby inhibiting autophagy and enhancing proliferative capacities [81]. In the tumor microenvironment, ubiquitination modulates immune responses through regulation of PD-L1 stability, with USP2 deubiquitinating and stabilizing PD-1 to promote tumor immune escape [27]. Metabolic reprogramming in cancer is similarly governed by ubiquitination pathways, as demonstrated by OTUB2-mediated inhibition of PKM2 ubiquitination by Parkin, which enhances glycolysis and accelerates colorectal cancer progression [27].
Therapeutic Implications and Targeting Strategies
The ubiquitination machinery presents numerous therapeutic opportunities for cancer intervention. Proteolysis targeting chimeras (PROTACs) represent a novel class of therapeutics that harness the ubiquitin-proteasome system to selectively degrade target proteins, with ARV-110 and ARV-471 progressing to phase II clinical trials [27]. Molecular glue degraders offer an alternative approach with smaller molecular dimensions, exemplified by CC-90009 which promotes GSPT1 degradation via recruitment of the CRL4CRBN E3 ligase complex in leukemia therapy [27]. Existing drugs can also modulate ubiquitination pathways, as demonstrated by indomethacin which enhances SYVN1-mediated ubiquitination of ITGAV in esophageal squamous cell carcinoma [27]. The proteasome inhibitor bortezomib has shown efficacy against anaplastic thyroid carcinoma, highlighting the clinical potential of targeting ubiquitin-proteasome pathways [79]. For hepatocellular carcinoma, UBE2C emerges as a promising therapeutic target whose knockdown increases sensitivity to gemcitabine, suggesting combinatorial strategies with conventional chemotherapeutics [80].
Concluding Remarks
Differential ubiquitination analysis between cancerous and normal tissues reveals profound alterations in the ubiquitin-proteasome system that drive oncogenesis through diverse mechanisms. The integration of multi-omics approaches with functional validation provides a comprehensive framework for identifying ubiquitination signatures with diagnostic, prognostic, and therapeutic relevance. As our understanding of the ubiquitin code in cancer deepens, the development of targeted therapies exploiting ubiquitination pathways holds significant promise for precision oncology. Future directions should focus on elucidating the spatial organization of ubiquitination networks within tumor ecosystems, developing advanced technologies for monitoring dynamic ubiquitination changes in clinical specimens, and translating ubiquitination-based biomarkers into routine diagnostic and therapeutic applications.
This application note provides a standardized bioinformatics protocol for the functional interpretation of ubiquitination changes identified in cancer versus normal tissue studies. The detailed workflow enables researchers to transition from raw ubiquitinomics data to biologically meaningful insights, focusing on prognostic biomarker discovery and the identification of dysregulated cancer pathways.
Ubiquitination, a crucial post-translational modification, regulates diverse cellular processes including protein degradation, cell cycle progression, and DNA repair [85]. Disruption of ubiquitination pathways is a hallmark of cancer, contributing to uncontrolled proliferation, evasion of apoptosis, and metastasis [35]. Ubiquitylomics—the large-scale study of ubiquitinated proteins—provides a powerful approach for identifying cancer-specific ubiquitination signatures. By comparing ubiquitination patterns between cancerous and normal tissues, researchers can pinpoint potential therapeutic targets and prognostic biomarkers [85] [35]. This protocol outlines a comprehensive bioinformatics pipeline for the functional enrichment and pathway analysis of ubiquitination changes, framed within the context of esophageal squamous cell carcinoma (ESCC) and colorectal cancer (CRC) as representative case studies [85] [35].
Key Ubiquitination Changes in Human Cancers
Ubiquitylomics studies across multiple cancer types have identified consistent patterns of ubiquitination dysregulation. The table below summarizes key quantitative findings from recent studies.
Table 1: Summary of Ubiquitination Changes in Human Cancers
| Cancer Type | Analytical Method | Key Finding | Significance/Outcome |
|---|---|---|---|
| Esophageal Squamous Cell Carcinoma (ESCC) [85] | Integration of TCGA-ESCC, GSE20347, and in-house dataset | 85 ubiquitination-related differentially expressed genes (URDEGs) identified; 5 key genes (BUB1B, CHEK1, DNMT1, IRAK1, PRKDC) with prognostic value | Poor prognosis; potential therapeutic targets |
| Colorectal Cancer (CRC) [35] | Ubiquitin-proteomic analysis (LC-MS/MS) of 6 patient-matched tissue pairs | 1690 quantifiable ubiquitination sites; 870 quantifiable proteins; 1172 proteins with up-regulated and 1700 with down-regulated ubiquitination in CRC | Association with metabolic, immune regulation, and telomere maintenance pathways |
| Breast Cancer [86] | Biochemical assays, RNA-seq, ChIP-seq | TRAF6-mediated ubiquitination of TAB2 contributes to corepressor clearance from target regulatory regions | Influences inflammatory signaling and gene expression |
Bioinformatics Protocol for Ubiquitination Data Analysis
This section provides a step-by-step computational protocol for analyzing ubiquitination changes in cancer tissues.
Data Preprocessing and Quality Control
- Raw Data Source: Process ubiquitinomics data from LC-MS/MS or genomic datasets (e.g., TCGA, CPTAC, GEO) [85] [35].
- Software/Tool: Utilize MaxQuant search engine (v.1.6.6.0) for mass spectrometry data identification and quantification [35].
- Key Parameters:
- Enzyme digestion: Trypsin/P
- Maximum missed cleavages: 4
- Fixed modification: Carbamidomethyl (C)
- Variable modifications: Oxidation (M), GlyGly (K) [35]
- Quality Assessment: Ensure peptide lengths are distributed between 7-20 amino acids [35].
Identification of Differentially Ubiquitinated Proteins
- Statistical Analysis: Use the
limmaR package for differential expression analysis of ubiquitination-related genes [85]. - Threshold Settings:
- Significance: Adjusted p-value (adj. P) < 0.05
- Magnitude of change: |log fold change (FC)| > 0.5 [85]
- Ubiquitination Site Analysis: For ubiquitinomics data, apply fold change threshold >1.5 for significant up-regulation and <1/1.5 for significant down-regulation [35].
Functional Enrichment Analysis
- Gene Ontology (GO) Analysis:
- Perform using UniProt-GOA database (http://www.ebi.ac.uk/GOA) [35]
- Focus on biological processes, molecular functions, and cellular components
- Pathway Enrichment:
- Utilize Kyoto Encyclopedia of Genes and Genomes (KEGG) database (http://www.genome.jp/kegg/) [35]
- Identify significantly enriched pathways (Fisher's exact test, p < 0.05)
- Additional Methods:
Survival and Prognostic Analysis
- Survival Analysis: Conduct Kaplan-Meier survival analysis on TCGA-ESCC dataset with p < 0.05 as significance threshold [85].
- Multivariate Cox Regression: Develop models using prognostic URDEGs to predict patient outcomes [85].
- Validation: Validate findings with independent datasets (e.g., GSE20347) [85].
Protein-Protein Interaction Network Construction
- Network Analysis: Construct PPI networks to identify hub genes in cancer pathways [85].
- Tools: Utilize cBioPortal for Cancer Genomics (http://cbioportal.org) for mutation analysis and network visualization [85].
Diagram 1: Bioinformatics analysis workflow for ubiquitination data.
Experimental Protocol for Ubiquitination Analysis in Cancer Tissues
This section provides detailed laboratory methodology for generating ubiquitination data suitable for the bioinformatics analysis described above.
Tissue Collection and Preparation
- Sample Source: Collect matched cancerous and para-cancerous normal tissues (within 5 cm of tumors) from cancer patients [35].
- Ethical Considerations: Obtain informed consent and approval from the institutional ethics committee [35].
- Processing Protocol:
- Collect tissues within 0.5 hours after surgery
- Immediately freeze in liquid nitrogen for ≥3 hours
- Store at -80°C until analysis [35]
Protein Extraction and Trypsin Digestion
- Protein Precipitation: Add trichloroacetic acid (TCA) to samples, centrifuge at 4,500 g at 4°C for 5 minutes [35].
- Wash Step: Wash pellet with pre-cooled acetone and air dry [35].
- Solubilization: Dissolve pellet in 200 mM tetraethyl ammonium bromide (TEAB) [35].
- Digestion Protocol:
- Add trypsin to samples and incubate overnight
- Incubate with dithiothreitol at 56°C for 30 minutes
- Add iodoacetamide (IAA) and incubate at room temperature for 15 minutes in the dark [35]
Ubiquitinated Peptide Enrichment and LC-MS/MS Analysis
- Instrumentation: Nano Elute ultra-high performance liquid system coupled with times-TOF Pro mass spectrometer [35].
- LC Parameters:
- Mobile phase A: 0.1% formic acid, 2% acetonitrile
- Mobile phase B: 0.1% formic acid, 100% acetonitrile
- Gradient: 6-22% B (0-44 min), 22-30% B (44-56 min), 30-80% B (56-58 min), 80% B (58-60 min)
- Flow rate: 450 nl/min [35]
- MS Settings:
- Ion source voltage: 2.0 kV
- Secondary MS scanning range: 100-1700 m/z
- Data acquisition: Parallel accumulation serial fragmentation (PASEF) mode
- Dynamic exclusion time: 30 seconds [35]
Validation Experiments
- Gene Expression Validation: Perform real-time quantitative polymerase chain reaction (RT-qPCR) to validate gene expression findings [85].
- Biochemical Validation: Conduct immunoprecipitation and western blotting to verify ubiquitination events and protein interactions [86].
Case Study: ESCC Ubiquitination Analysis
A recent study exemplifies the application of this pipeline in esophageal squamous cell carcinoma [85].
Key Findings
- Prognostic Genes: Identified 5 key genes (BUB1B, CHEK1, DNMT1, IRAK1, PRKDC) with significant prognostic value in ESCC [85].
- Functional Roles: These genes play essential roles in cell cycle regulation and immune response pathways [85].
- Therapeutic Potential: Varied expression in ESCC tissues supports their potential as therapeutic targets [85].
Table 2: Key Prognostic Ubiquitination-Related Genes in ESCC
| Gene Symbol | Full Name | Known Function in Cancer | Prognostic Value |
|---|---|---|---|
| BUB1B [85] | BUB1 Mitotic Checkpoint Serine/Threonine Kinase B | Cell cycle regulation, mitotic checkpoint | Significant |
| CHEK1 [85] | Checkpoint Kinase 1 | DNA damage response, cell cycle arrest | Significant |
| DNMT1 [85] | DNA Methyltransferase 1 | Epigenetic regulation, DNA methylation | Significant |
| IRAK1 [85] | Interleukin 1 Receptor Associated Kinase 1 | Innate immune signaling, inflammation | Significant |
| PRKDC [85] [35] | Protein Kinase, DNA-Activated, Catalytic Subunit | DNA repair, V(D)J recombination | Significant; highly ubiquitinated |
Signaling Pathways Identified
Functional enrichment analysis revealed that URDEGs in ESCC are significantly involved in:
- Cell cycle progression and checkpoint regulation
- Immune response pathways
- DNA repair mechanisms [85]
Diagram 2: Key signaling pathways affected by ubiquitination changes in cancer.
The Scientist's Toolkit: Essential Research Reagents
The table below details key reagents and resources required for implementing the ubiquitination analysis pipeline described in this protocol.
Table 3: Essential Research Reagents for Ubiquitylomics Analysis
| Reagent/Resource | Specification/Example | Function/Purpose |
|---|---|---|
| Mass Spectrometry System [35] | Nano Elute UHPLC coupled with times-TOF Pro | High-sensitivity identification and quantification of ubiquitinated peptides |
| Database Search Engine [35] | MaxQuant (v.1.6.6.0) | Identification of ubiquitination sites from MS/MS data |
| Ubiquitin Enrichment Reagents | K63-specific ubiquitin binding columns (His-tag Vx3k0) [86] | Selective enrichment of K63-linked ubiquitinated proteins |
| Statistical Analysis Tool [85] | limma R package | Differential expression analysis of ubiquitination-related genes |
| Functional Annotation Databases [85] [35] | UniProt-GOA, KEGG, GeneCards | Functional enrichment analysis of ubiquitinated proteins |
| Cancer Genomics Database [85] | TCGA, GEO, cBioPortal | Access to cancer ubiquitinomics datasets and mutation analysis |
| Validation Reagents [85] | RT-qPCR primers and antibodies | Experimental validation of bioinformatics findings |
This application note provides a comprehensive bioinformatics pipeline for analyzing ubiquitination changes in cancer research. By integrating multi-omics approaches and following standardized protocols, researchers can systematically identify and validate ubiquitination-related biomarkers and therapeutic targets. The case study in ESCC demonstrates the practical application of this pipeline for identifying prognostic ubiquitination signatures. Future directions in ubiquitinomics research include the development of more sophisticated multi-omics integration methods and the translation of ubiquitination signatures into clinical biomarkers for cancer diagnosis and treatment monitoring.
In the field of ubiquitylomics, the comprehensive study of protein ubiquitination, robust validation of findings is paramount, especially when comparing cancerous and normal tissues. Ubiquitination, a crucial post-translational modification, regulates diverse cellular functions including protein degradation, signal transduction, and DNA repair [14]. Dysregulation of ubiquitination pathways is implicated in numerous pathologies, particularly cancer [87] [14]. This application note provides detailed methodologies for three cornerstone validation techniques—Targeted Mass Spectrometry (MS), Immunoblotting, and Functional Assays—framed within the context of ubiquitylomics research in oncology. These protocols enable researchers to confirm ubiquitination events, quantify changes between pathological and normal states, and assess functional consequences, thereby supporting drug discovery and therapeutic development.
Comparative Analysis of Ubiquitination Validation Methods
The table below summarizes the key characteristics, applications, and requirements of the three primary validation methods discussed in this note.
Table 1: Comparison of Key Validation Methods in Ubiquitylomics
| Method Attribute | Targeted Mass Spectrometry | Immunoblotting | Functional Assays (Genetic) |
|---|---|---|---|
| Primary Application | High-throughput, proteome-wide ubiquitination site profiling [87] [14] | Validation of ubiquitination for a single protein; low-throughput analysis [14] | Confirmation of E2/E3 ligase involvement in substrate ubiquitination [88] |
| Key Reagents | Anti-K-Ɛ-GG antibody [88], tagged ubiquitin (e.g., His, Strep) [14] | Ubiquitin antibodies (P4D1, FK1/FK2), linkage-specific antibodies [14] | E2/E3 enzyme knockout/knockdown models (e.g., CRISPR, siRNA) [88] |
| Throughput | High | Low | Medium |
| Key Readout | Precise identification and quantification of ubiquitinated lysine residues (K-Ub) [88] | Gel mobility shift, ubiquitin laddering pattern [14] | Altered ubiquitination levels of substrate upon E2/E3 manipulation [88] |
| Quantification Capability | Excellent (label-free or label-based) [87] | Semi-quantitative | Semi-quantitative (depends on downstream readout) |
| Critical Data | List of K-Ub sites, Ub linkage type, quantitative changes [88] | Confirmation of substrate ubiquitination, linkage type if using specific antibodies [14] | Genetic evidence for enzyme-substrate relationship, phenotypic confirmation (e.g., root growth) [88] |
Detailed Experimental Protocols
Protocol: Targeted MS for Ubiquitinome Quantification
This protocol leverages anti-K-Ɛ-GG antibody enrichment and high-resolution mass spectrometry for the identification and quantification of ubiquitination sites in complex tissue samples (e.g., cancerous vs. normal) [88].
Key Reagents:
- Anti-K-Ɛ-GG Antibody (e.g., from PTM Biolabs) [88]
- Protein A/G Magnetic Beads
- Lysis Buffer: 8 M Urea, 50 mM Tris-HCl (pH 8.0), supplemented with protease inhibitors (e.g., 1 mM PMSF) and deubiquitinase inhibitors (e.g., 10 mM N-Ethylmaleimide)
- Trypsin (sequencing grade)
- StageTips for sample desalting
Procedure:
- Tissue Lysis and Protein Digestion:
- Homogenize ~20 mg of flash-frozen cancerous and normal tissue samples in 1 mL of ice-cold lysis buffer.
- Reduce proteins with 5 mM dithiothreitol (DTT) for 30 minutes at 37°C and alkylate with 15 mM iodoacetamide for 30 minutes in the dark at room temperature.
- Digest proteins first with Lys-C (1:100 w/w) for 4 hours at 37°C, then dilute the urea concentration to 2 M and digest with trypsin (1:50 w/w) overnight at 37°C [88].
Peptide Desalting:
- Acidify digested peptides to pH < 3 with trifluoroacetic acid (TFA).
- Desalt peptides using C18 StageTips or solid-phase extraction columns according to the manufacturer's instructions. Dry the peptides completely in a vacuum concentrator.
K-Ɛ-GG Peptide Enrichment:
- Resuspend the dried peptide pellets in 1 mL of Immunoaffinity Purification (IAP) Buffer (50 mM MOPS-NaOH, pH 7.4, 10 mM Na₂HPO₄, 50 mM NaCl).
- Incubate the peptide solution with 10 µg of anti-K-Ɛ-GG antibody pre-bound to Protein A/G Magnetic Beads for 2 hours at 4°C with gentle rotation [88].
- Wash the beads 3 times with 1 mL of IAP Buffer and twice with 1 mL of HPLC-grade water.
Mass Spectrometric Analysis:
- Elute the enriched K-Ɛ-GG peptides from the beads with 0.1% TFA.
- Analyze the eluates using a high-resolution LC-MS/MS system (e.g., timsTOF Pro with diaPASEF method) [87].
- For quantitative comparison, process the raw data using software like Spectronaut or MaxQuant. Search data against the appropriate human proteome database, specifying "GlyGly (K)" as a variable modification.
Protocol: Immunoblotting for Substrate Ubiquitination
This classic method is used to confirm the ubiquitination status of a specific protein substrate.
Key Reagents:
- Ubiquitin Antibodies: Pan-ubiquitin (e.g., P4D1, FK1/FK2) or linkage-specific (e.g., K48-, K63-specific) [14]
- Substrate-specific antibody
- Proteasome Inhibitor: MG132 (10 µM for 4-6 hours)
- NEDD8-Activating Enzyme Inhibitor: MLN4924 (1 µM for 4-6 hours) [87]
- Lysis Buffer: RIPA Buffer with 1% SDS, supplemented with 10 mM N-Ethylmaleimide and protease inhibitors.
Procedure:
- Cell Treatment and Lysis:
- Culture cells from cancerous and normal lines. Treat with DMSO (control), MG132, or MLN4924 as required.
- Lyse cells directly in 1X Laemmli SDS-sample buffer containing 50 mM DTT to preserve ubiquitination marks. Boil samples immediately at 95°C for 10 minutes [14].
SDS-PAGE and Western Blotting:
- Resolve 20-30 µg of total protein by SDS-PAGE on a 4-12% Bis-Tris gradient gel.
- Transfer proteins to a PVDF membrane using standard wet or semi-dry transfer protocols.
Immunoblotting and Detection:
- Block the membrane with 5% non-fat milk in TBST for 1 hour.
- Probe for the protein of interest with a substrate-specific primary antibody overnight at 4°C.
- To detect ubiquitinated species, a characteristic "smear" or "ladder" at higher molecular weights than the unmodified protein should be visible [14].
- For reciprocal validation, immunoprecipitate the substrate with its specific antibody and then immunoblot with a pan-ubiquitin antibody.
Protocol: Functional Validation using E2 Enzyme Knockdown
This assay tests the functional role of a specific E2 ubiquitin-conjugating enzyme in the ubiquitination of a target substrate, using a genetic approach.
Key Reagents:
- siRNA or CRISPR/Cas9 constructs targeting the E2 enzyme of interest (e.g., UBC32, UBC34) [88]
- Control non-targeting siRNA or scramble guide RNA
- Transfection reagent (e.g., Lipofectamine 3000)
Procedure:
- Genetic Perturbation:
- Seed an appropriate cancer cell line (e.g., Huh-7) in 6-well plates.
- At 60-70% confluency, transfert cells with siRNA targeting the E2 enzyme or a non-targeting control, following the manufacturer's protocol. Alternatively, generate stable knockout lines using CRISPR/Cas9.
- Phenotypic and Molecular Analysis:
- 72 hours post-transfection, assess the functional consequence. For example, under osmotic stress, monitor primary root growth in a plant model or cell viability in a cancer model [88].
- In parallel, harvest cell lysates for immunoblotting analysis to confirm the knockdown/knockout efficiency of the E2 enzyme and to examine the ubiquitination levels of the putative substrate.
Research Reagent Solutions
The following table lists essential reagents for conducting ubiquitination validation experiments.
Table 2: Key Research Reagents for Ubiquitylomics Validation
| Reagent Name | Function / Application | Example / Note |
|---|---|---|
| Anti-K-Ɛ-GG Antibody | Immunoaffinity enrichment of tryptic peptides derived from ubiquitinated lysines for MS analysis [88] | Critical for ubiquitinome studies; available from PTM Biolabs and other vendors. |
| Tagged Ubiquitin (His, Strep, HA) | Ectopic expression to purify and identify ubiquitinated substrates from cell lines [14] | His-Ub used with Ni-NTA resin; Strep-Ub with Strep-Tactin resin [14]. |
| Linkage-Specific Ub Antibodies | Detect poly-Ub chains with specific linkages (K48, K63, M1, etc.) via immunoblotting [14] | K48-linked chains often target for proteasomal degradation [14]. |
| Pan-Ubiquitin Antibodies (P4D1, FK1/FK2) | General detection of ubiquitinated proteins in immunoblotting [14] | FK2 recognizes multi- and poly-ubiquitinated proteins. |
| Proteasome Inhibitor (MG132) | Stabilizes ubiquitinated proteins by blocking their degradation by the proteasome [14] | Use at 10-20 µM for 4-6 hours before lysis. |
| E1/NEDD8 Inhibitor (MLN4924) | Blocks cullin-RING ligase (CRL) activity; validates CRL-dependent ubiquitination [87] | Rescues degradation of CRBN neosubstrates [87]. |
| TUBEs (Tandem Ubiquitin Binding Entities) | Protect poly-Ub chains from deubiquitinases and proteasomal degradation during purification [14] | High-affinity tool for enriching endogenous ubiquitinated proteins. |
Experimental Workflow and Pathway Diagrams
Figure 1: A sequential workflow for validating ubiquitination events, beginning with discovery-based mass spectrometry and progressing through orthogonal validation methods.
Figure 2: The ubiquitination cascade and functional outcomes, highlighting the role of specific enzymes and the consequence of chain linkage type.
The ubiquitin-proteasome system (UPS) represents a fundamental regulatory mechanism in cellular homeostasis, and its dysregulation is a hallmark of cancer. Within this system, E3 ubiquitin ligases serve as the critical determinants of substrate specificity, orchestrating the targeted degradation of proteins involved in cell cycle progression, apoptosis, and DNA repair [89] [90]. Proteolysis Targeting Chimeras (PROTACs) are heterobifunctional molecules that hijack this natural degradation machinery. They consist of three core elements: a ligand that binds to a protein of interest (POI), a ligand that recruits an E3 ubiquitin ligase, and a flexible linker connecting the two [91] [89]. By bringing the E3 ligase into proximity with the POI, PROTACs facilitate the transfer of ubiquitin chains onto the POI, marking it for recognition and degradation by the 26S proteasome [89].
The catalytic nature of PROTACs represents a paradigm shift from traditional occupancy-based pharmacology to event-driven pharmacology, enabling the degradation of target proteins at sub-stoichiometric concentrations [92]. This technology has proven particularly valuable for targeting proteins previously considered "undruggable," including transcription factors, scaffolding proteins, and mutated oncoproteins that resist conventional inhibition [93] [89]. Within the context of ubiquitylomics analysis comparing cancerous and normal tissues, PROTAC development offers a promising therapeutic strategy that directly leverages insights into differentially regulated ubiquitination pathways in oncogenesis.
The E3 Ligase Landscape in PROTAC Development
Canonical E3 Ligases and Their Clinical Translation
The development of PROTAC technology has been historically dominated by a limited repertoire of E3 ligases with well-characterized small-molecule ligands. Cereblon (CRBN), recruited via thalidomide and its analogs (e.g., pomalidomide, lenalidomide), is the most frequently utilized E3 ligase in clinical-stage PROTACs [92] [94]. Its widespread application stems from the availability of high-affinity ligands and favorable druggability properties. Von Hippel-Lindau (VHL) is another widely recruited E3 ligase, engaged through synthetic mimics of the HIF-1α hydroxyproline peptide [92] [94]. While VHL-based PROTACs often demonstrate high degradation efficacy, their ligands can present challenges related to membrane permeability and oral bioavailability [94].
Other canonical E3 ligases include MDM2, recruited via nutlin-3a and related compounds, and the Inhibitor of Apoptosis Protein (IAP) family, first harnessed through Specific and Nongenetic IAP-dependent Protein Erasers (SNIPERs) [92] [89]. The heavy reliance on this small group of E3 ligases poses a bottleneck, potentially restricting the degradable proteome and creating avenues for acquired resistance through E3 ligase mutation or downregulation [92]. Consequently, a major frontier in the field involves expanding the repertoire of ligatable E3 ligases.
Table 1: Key E3 Ubiquitin Ligases in PROTAC Development
| E3 Ligase | Small-Molecule Ligand | Key Characteristics | Clinical-Stage Example |
|---|---|---|---|
| CRBN (Cereblon) | Thalidomide, Lenalidomide, Pomalidomide | Most common in clinical trials; good druggability; ubiquitous expression [92] [94] | ARV-110, ARV-471 [92] |
| VHL (Von Hippel-Lindau) | VHL ligands (HIF-1α mimetics) | High degradation efficiency; potential permeability challenges [92] [94] | DT2216 [94] |
| MDM2 | Nutlin-3a, MI- series | Key regulator of p53; used in early PROTAC designs [92] [89] | - |
| IAP (cIAP1) | Bestatin methyl ester, LCL-161 | First harnessed via SNIPER technology [92] [89] | - |
Expanding the E3 Ligase Toolbox
Recent chemoproteomic and screening approaches have successfully identified ligands for novel E3 ligases, diversifying the options for PROTAC design. RNF114 has been recruited using the natural product nimbolide and simpler synthetic acrylamides that covalently engage a cysteine residue in its N-terminal region. Nimbolide-based PROTACs have been used to achieve nanomolar-potency degradation of targets like BRD4 [92]. Similarly, RNF4 engagement has been demonstrated with a covalent ligand, CCW 16, identified via activity-based protein profiling (ABPP). When linked to a BET inhibitor, the resulting PROTAC, CCW 28-3, induced RNF4-dependent degradation of BRD4 [92].
Other emerging E3 ligases for which functional ligands have been reported include FEM1B, KEAP1, and DCAF15/16 [94]. This expansion is critical for overcoming the limitations of canonical E3 ligases. It enables the targeting of POIs that do not form productive ternary complexes with CRBN or VHL, allows for tissue-selective degradation by recruiting E3 ligases with restricted expression patterns, and provides alternatives to circumvent potential resistance mechanisms [92].
Table 2: Emerging E3 Ligases for PROTAC Development
| E3 Ligase | Ligand Type | Discovery Method | Proof-of-Concept Application |
|---|---|---|---|
| RNF114 | Nimbolide, synthetic acrylamides | Covalent screening/ABPP [92] | BRD4 degradation (PROTAC XH2) [92] |
| RNF4 | Covalent ligands (e.g., CCW 16) | Activity-based protein profiling (ABPP) [92] | BRD4 degradation (PROTAC CCW 28-3) [92] |
| FEM1B | Small molecules | Functional screening [94] | - |
| KEAP1 | Small molecules | - | - |
Diagram 1: PROTAC mechanism of action. The PROTAC molecule facilitates the ubiquitination of the target protein by recruiting an E3 ubiquitin ligase, leading to proteasomal degradation.
Experimental Protocols for PROTAC Development and Evaluation
Protocol 1: In Vitro Assessment of PROTAC Efficacy
This protocol outlines the steps to evaluate the degradation efficiency and specificity of a novel PROTAC in cell culture models, a critical step in the early development pipeline.
Materials:
- Cell Lines: Relevant cancer cell lines (e.g., Huh7, Hep3B for HCC studies [80]) and appropriate normal control cells.
- PROTAC Compound: Dissolved in DMSO or suitable vehicle.
- Controls: Inactive PROTAC analog (e.g., with mismatched E3 ligand or POI binder), E3 ligase ligand alone, POI ligand alone, and proteasome inhibitor (e.g., MG132).
- Antibodies: For Western Blot: anti-target protein, anti-E3 ligase, and anti-loading control (e.g., GAPDH, β-actin) [95].
Procedure:
- Cell Seeding and Treatment:
- Seed cells in 6-well or 12-well plates and allow to adhere for 24 hours.
- Treat cells with a concentration gradient of the PROTAC (e.g., 1 nM - 10 µM) and control compounds for a predetermined time (typically 4-24 hours). Include a DMSO vehicle control.
Cell Lysis and Protein Quantification:
- Lyse cells using RIPA buffer supplemented with protease and phosphatase inhibitors.
- Centrifuge lysates to remove debris and quantify protein concentration using a BCA or Bradford assay.
Western Blot Analysis:
- Separate equal amounts of protein via SDS-PAGE and transfer to a PVDF membrane.
- Block the membrane with 5% non-fat milk and probe with primary antibodies overnight at 4°C.
- Incubate with HRP-conjugated secondary antibodies and develop using enhanced chemiluminescence (ECL) substrate.
- Quantify band intensities to determine DC₅₀ (half-maximal degradation concentration) and Dmax (maximal degradation) [92].
Validation and Specificity Checks:
- Co-treatment with Proteasome Inhibitor: To confirm UPS-dependence, co-treat cells with PROTAC and MG132 (e.g., 10 µM). Degradation should be blocked [91].
- Genetic Knockdown of E3 Ligase: Use siRNA or CRISPR/Cas9 to knock down the recruited E3 ligase. PROTAC efficacy should be significantly reduced, confirming on-target mechanism [92] [95].
- Global Proteomics: Perform tandem mass tag (TMT) proteomics to assess selectivity and rule offtarget effects across the proteome.
Protocol 2: Functional Phenotypic Assays in Cancer Models
Following confirmation of target degradation, functional assays are necessary to evaluate the consequent anti-cancer effects.
Materials:
- Cell Lines: As in Protocol 1.
- Assay Kits: Cell Counting Kit-8 (CCK-8) or MTT reagent, Crystal Violet, Matrigel for invasion assays.
- Equipment: Transwell chambers, light microscope.
Procedure:
- Cell Viability/Proliferation Assay (CCK-8):
- Seed cells in 96-well plates and treat with PROTACs and controls.
- After 24-72 hours, add CCK-8 reagent directly to the culture medium and incubate for 1-4 hours.
- Measure the absorbance at 450 nm using a microplate reader. Plot cell viability relative to vehicle control [80].
Clonogenic Assay:
- Seed a low density of cells (e.g., 500-1000 cells/well in a 6-well plate) and treat with PROTACs.
- Replace the medium every 3-4 days for 1-2 weeks until visible colonies form.
- Fix colonies with methanol, stain with Crystal Violet, and count colonies containing >50 cells.
Migration and Invasion Assay (Transwell):
- Migration: Seed serum-starved cells into the upper chamber of an uncoated Transwell insert. Place complete medium in the lower chamber as a chemoattractant.
- Invasion: Coat the upper membrane of the Transwell insert with Matrigel (diluted in serum-free medium) prior to seeding cells.
- After 24-48 hours of PROTAC treatment, fix and stain the cells that have migrated/invaded to the lower side of the membrane with Crystal Violet.
- Count the number of cells in multiple fields under a light microscope [80].
Wound Healing Assay:
- Seed cells in a 6-well plate to form a confluent monolayer.
- Create a scratch ("wound") using a sterile pipette tip.
- Wash away detached cells and add fresh medium containing PROTAC.
- Image the scratch at 0 h and 24 h (or later) to measure the rate of wound closure [80].
Diagram 2: PROTAC evaluation workflow. The key steps involve treating cells, confirming degradation, assessing functional consequences, and validating the mechanism.
Advanced Applications and Emerging Technologies
BioPROTACs for Misfolded Proteins in Neurodegeneration
While traditional PROTACs use small molecules, BioPROTACs utilize biological binders, such as single-chain variable fragments (scFvs) or nanobodies, fused directly to an E3 ligase domain. This approach is powerful for targeting complex epitopes, such as those found on misfolded proteins. A recent landmark study developed a BioPROTAC termed "MisfoldUbL" for degrading misfolded SOD1, a protein implicated in Amyotrophic Lateral Sclerosis (ALS) [95].
Key Experimental Steps:
- Design: A panel of scFvs, derived from antibodies specific to the misfolded form of SOD1, was fused to a truncated catalytic domain of the E3 ligase CHIP (CHIP∆TPR) via a GSGSG linker [95].
- Screening: The resulting BioPROTACs were co-expressed with SOD1-EGFP mutants in HEK293, Neuro-2A, and SH-SY5Y cells. Efficacy was measured by the reduction in EGFP fluorescence and the number of insoluble aggregates [95].
- Validation: The lead candidate, BP2, significantly reduced levels and aggregation of multiple misfolded SOD1 mutants without affecting native SOD1. In a transgenic mouse model of ALS, BP2 expression delayed disease progression and protected motor neurons [95].
Pro-PROTACs and Opto-PROTACs for Spatiotemporal Control
To enhance the precision of PROTAC activity, "pro-PROTAC" strategies have been developed. These are inactive precursors that are converted to the active PROTAC under specific conditions [91]. A prominent example is the development of Opto-PROTACs (photocaged PROTACs), which allow for spatial and temporal control of protein degradation using light.
Protocol for Opto-PROTAC Application:
- Synthesis: Install a photolabile "caging group" (e.g., 4,5-dimethoxy-2-nitrobenzyl (DMNB) or diethylamino coumarin (DEACM)) on a critical functional group of the E3 ligase ligand (e.g., the glutarimide -NH of CRBN ligands) or the POI ligand. This group sterically hinders ternary complex formation [91].
- Treatment and Irradiation: Treat cells with the inert Opto-PROTAC and allow it to permeate.
- Activation: Expose the cells to light of a specific wavelength (e.g., 365 nm for DMNB). This cleaves the caging group, releasing the active PROTAC and initiating degradation of the target protein only in the irradiated areas [91].
- Validation: Monitor target protein levels via Western blot or immunofluorescence in irradiated vs. non-irradiated regions to confirm light-induced degradation.
The Scientist's Toolkit: Essential Research Reagents
Table 3: Key Research Reagents for E3 Ligase and PROTAC Research
| Reagent / Tool | Function / Application | Example(s) |
|---|---|---|
| CRBN Ligands | Recruit CRBN E3 ligase in PROTAC design | Thalidomide, Pomalidomide, Lenalidomide derivatives [92] [94] |
| VHL Ligands | Recruit VHL E3 ligase in PROTAC design | VH-298 and related hydroxyproline derivatives [92] [94] |
| Activity-Based Protein Profiling (ABPP) | Platform for discovering covalent ligands for novel E3 ligases (e.g., RNF4, RNF114) [92] | TRH 1-23, CCW 16, Nimbolide [92] |
| Proteasome Inhibitor | Validates UPS-dependence of degradation | MG132, Bortezomib, Carfilzomib [91] |
| siRNA/shRNA for E3 Ligases | Confirms on-target mechanism by genetic knockdown | siRNA against CRBN, VHL, RNF114 [92] [95] |
| Photo-labile Groups | Enables spatiotemporal control for Opto-PROTACs | DMNB, DEACM, NPOM [91] |
| scFv Intrabodies | Serves as target-binding domain for BioPROTACs | scFvs specific for misfolded SOD1 [95] |
| Global Proteomics (TMT/MS) | Assesses PROTAC selectivity and identifies off-targets | Tandem Mass Tag (TMT) multiplexing [92] |
Ubiquitylomics, the large-scale study of protein ubiquitination, is transforming oncology by revealing post-translational regulatory mechanisms that drive tumor heterogeneity and therapeutic response. This application note details how ubiquitination signatures serve as robust biomarkers for patient stratification and treatment selection, moving beyond static genomic and transcriptomic profiles to capture dynamic protein-level regulation. By integrating ubiquitylomics with multi-omics data, researchers and clinicians can identify novel therapeutic targets, dissect mechanisms of drug resistance, and ultimately guide precision oncology decisions for improved patient outcomes.
Quantitative Evidence and Clinical Correlations
Table 1: Key Ubiquitination Alterations in Cancer Pathogenesis and Clinical Implications
| Biological Process/ Protein | Ubiquitination Change in Cancer | Associated Cancer Type(s) | Clinical Implication for Stratification/Therapy |
|---|---|---|---|
| Fibrosis Regulators (e.g., TGFBR1, α-SMA, FN1) | Increased ubiquitination correlating with elevated protein expression (positive regulation) [96] | Endometriosis (Ovarian) | Stratification of patients with fibrotic disease subtypes; Targeting E3 ligases/deubiquitinases (DUBs) modulating these pathways [96]. |
| USP7 Substrates | Rapid increase in ubiquitination upon USP7 inhibition (deubiquitinase target) [47] | HCT116 (Colorectal Carcinoma), other solid tumors | Biomarker for monitoring efficacy of USP7/DUB inhibitors; Distinguishing degradative vs. non-degradative ubiquitination events [47]. |
| Proteasome Substrates | Increased K48-linked ubiquitination identified via ubiquitylomics [47] | Broadly applicable | Stratification for proteasome inhibitor therapy (e.g., Bortezomib); Monitoring drug resistance mechanisms [47]. |
| Tumor Suppressors (e.g., p53) | Aberrant degradation via ubiquitination [47] | Broadly applicable | Identifying patients with functional p53 pathway inactivation; Stratification for therapies that reactivate p53 or target upstream E3 ligases (e.g., MDM2) [47]. |
Table 2: Multi-Omics Integration for Enhanced Patient Stratification This table outlines how ubiquitylomics complements other omics layers to reveal functional biology often missed by single-omics approaches.
| Omics Layer | Information Gained | Limitation as a Single Layer | Value Added by Ubiquitylomics Integration |
|---|---|---|---|
| Genomics | Mutations, Copy Number Variations (CNVs), Structural variants [97] | Does not confirm functional protein-level impact or activity [98]. | Identifies if driver mutations lead to altered degradation or activation of key pathway proteins via ubiquitination. |
| Transcriptomics | Gene expression levels, pathway activity, regulatory networks [97] | Poor correlation with protein abundance and post-translational regulation [96] [98]. | Reveals direct, post-translational modulation of protein activity and stability, explaining transcript-protein discrepancies. |
| Proteomics | Global protein abundance and expression states [97] | Does not explain why a protein's level is altered (e.g., synthesis vs. degradation) [98]. | Directly profiles a key mechanism regulating protein half-life, localization, and activity, clarifying proteomic changes. |
| Ubiquitylomics | Site-specific ubiquitination events, ubiquitin chain linkage types [47] | Provides a snapshot of regulation but lacks genetic context. | Informs the functional consequence of genomic alterations and provides dynamic insights into drug mechanism of action [96] [47]. |
Experimental Protocols
Protocol 1: Ubiquitylome Profiling from Tissue Specimens using DIA-MS
Principle: This protocol enables deep, reproducible profiling of ubiquitination sites from tumor biopsies by combining optimized sample lysis for protease inactivation, immunoaffinity enrichment of ubiquitylated peptides, and data-independent acquisition mass spectrometry (DIA-MS) for comprehensive quantification [47].
Workflow Diagram: Ubiquitylome Profiling from Tissue
Step-by-Step Procedure:
- Sample Lysis and Protein Extraction:
- Homogenize 2-4 mg of fresh or snap-frozen tissue in SDC Lysis Buffer (1% SDC, 100 mM Tris-HCl pH 8.5, 40 mM Chloroacetamide (CAA)) [47].
- Immediately boil the lysate at 95°C for 10 minutes to inactivate proteases and DUBs.
- Cool samples to room temperature and perform protein quantification. A minimum of 2 mg protein input is recommended for deep coverage [47].
- Protein Digestion:
- Reduce disulfide bonds with 5 mM DTT at 37°C for 30 min.
- Digest proteins sequentially with Lys-C (1:100 enzyme-to-protein ratio, 4 hours) and trypsin (1:50 ratio, overnight) at 37°C [47].
- Acidify the digest with 1% TFA to precipitate SDC, which is removed by centrifugation.
- Peptide Desalting:
- Desalt the peptides using C18 solid-phase extraction cartridges or columns according to manufacturer's instructions. Elute peptides with 30-50% acetonitrile (ACN) in 0.1% TFA. Lyophilize to dryness.
- Immunoaffinity Enrichment of K-ε-GG Peptides:
- Reconstitute the desalted peptide pellet in Immunoaffinity Enrichment (IAE) Buffer (50 mM MOPS pH 7.2, 10 mM Na2HPO4, 50 mM NaCl).
- Incubate the peptide solution with anti-K-ε-GG antibody-conjugated beads for 2 hours at 4°C with gentle agitation [47].
- Wash beads sequentially with IAE Buffer and then with HPLC-grade water to remove non-specifically bound peptides.
- Peptide Elution:
- Elute the enriched K-ε-GG peptides from the beads using two washes of 0.1% TFA.
- Combine eluents and desalt using C18 StageTips. Elute into LC-MS vials and dry down.
- DIA-MS Acquisition:
- Reconstitute peptides in 2% ACN/0.1% FA for LC-MS analysis.
- Perform chromatography using a 75-minute nanoLC gradient.
- Acquire data on a tribrid mass spectrometer coupled to a nanoLC system, using a DIA method with variable-width windows optimized for ubiquitin remnant peptides [47].
- Data Processing:
- Process DIA raw files using the DIA-NN software in library-free mode against the human UniProt database [47].
- Configure DIA-NN to account for the K-ε-GG remnant mass modification (+114.042928 Da on lysine) and enable the cross-run normalization and robust LC alignment.
- Filter the output to a 1% false discovery rate (FDR) at both the peptide and protein level.
Protocol 2: Computational Prediction of Ubiquitination Sites
Principle: Machine learning models trained on physicochemical properties (PCPs) of amino acid sequences can predict novel ubiquitination sites, complementing experimental data and helping to prioritize sites for functional validation [99].
Workflow Diagram: Computational Site Prediction
Step-by-Step Procedure:
- Data Set Establishment:
- Extract protein sequence segments centered on known ubiquitinated lysine (K) residues and an equal number of non-ubiquitinated lysine residues as negative controls. A typical segment length is 31 amino acids (15 residues upstream and downstream of the central K) [99].
- Feature Generation:
- For each amino acid in the sequence segment, retrieve its numerical PCP values from a database such as AAindex [99].
- Calculate the feature vector for the entire segment by averaging the PCP values for all amino acids at each position or by using other summary statistics, resulting in a high-dimensional feature vector (e.g., 531 features) per sequence segment [99].
- Model Training and Selection:
- Divide the curated data set of labeled segments into training and test sets (e.g., 80/20 split).
- Train multiple machine learning classifiers on the training data. Based on benchmarking studies, prioritize:
- Model Validation:
- Evaluate model performance on the held-out test set using 5-fold cross-validation.
- Use the Area Under the Receiver Operating Characteristic Curve (AUROC) as the primary metric for model comparison. An AUROC > 0.6 indicates predictive power significantly better than chance [99].
- Deployment and Prediction:
- Apply the trained and validated model to novel protein sequences of interest to generate predictions of ubiquitination likelihood for each lysine residue.
Protocol 3: Multi-Omics Integration for Patient Subtyping
Principle: Integrative computational frameworks combine ubiquitylomics with genomic, transcriptomic, and proteomic data to define molecularly distinct cancer subtypes with clinical relevance, enabling refined patient stratification [98].
Workflow Diagram: Multi-Omics Patient Subtyping
Step-by-Step Procedure:
- Data Collection and Preprocessing:
- Generate matched multi-omics data (e.g., Whole Exome Sequencing, RNA-Seq, Proteomics, Ubiquitylomics) from the same set of patient tumor samples.
- Perform standard preprocessing and normalization for each data type individually. For ubiquitylomics data, this would be the log2-transformed intensities of quantified K-ε-GG peptides.
- Data Integration and Clustering:
- Select an appropriate integration algorithm based on the data types and sample size:
- iClusterBayes: A Bayesian model ideal for integrating continuous and discrete data types to discover latent tumor subtypes. It effectively handles noise and identifies feature weights [98].
- PARADIGM: A pathway-centric method that integrates multi-omics data into curated pathway structures (e.g., from KEGG) to infer integrated pathway activities for each sample [98].
- Joint and Individual Variation Explained (JIVE): Decomposes multiple data types into shared and data-type-specific patterns of variation [98].
- Apply the chosen algorithm to the preprocessed data matrices to assign each patient to a molecular subtype.
- Select an appropriate integration algorithm based on the data types and sample size:
- Clinical Annotation and Validation:
- Annotate the derived subtypes with clinical variables such as overall survival, progression-free survival, and response to specific therapies.
- Validate the clinical utility of the subtypes in an independent cohort of patients.
- Biomarker and Target Identification:
- Analyze the features (e.g., specific ubiquitination sites, mutations) that drive the subtype classification to identify potential predictive biomarkers or druggable pathways specific to each subgroup.
The Scientist's Toolkit
Table 3: Essential Research Reagent Solutions for Ubiquitylomics
| Reagent/Material | Function and Application | Key Considerations |
|---|---|---|
| Anti-K-ε-GG Antibody Beads | Immunoaffinity enrichment of tryptic ubiquitin remnant peptides from complex protein digests prior to MS [47]. | Critical for specificity and depth of coverage. Quality varies between vendors and lots. |
| SDC Lysis Buffer (with CAA) | Protein extraction and solubilization. Immediate boiling with CAA rapidly inactivates DUBs and proteases, preserving the native ubiquitinome [47]. | Superior to urea-based buffers for ubiquitinome coverage and reproducibility. CAA avoids di-carbamidomethylation artifacts [47]. |
| DIA-NN Software | Deep neural network-based data processing for DIA-MS data. Enables high-confidence identification and quantification of ubiquitinated peptides in "library-free" mode [47]. | Specifically optimized for ubiquitinomics data. Outperforms other software in identification numbers and quantitative precision [47]. |
| Preclinical PDX/Organoid Models | Patient-derived xenografts (PDXs) and organoids (PDOs) that recapitulate tumor heterogeneity for functional validation of ubiquitination-dependent mechanisms and drug testing [97]. | Essential for translational research. PDX models allow in vivo characterization of genomic profiles and therapy response [97]. |
| Machine Learning Classifiers (EBMC, SVM, LR) | Computational prediction of novel ubiquitination sites from protein sequence features (Physicochemical Properties) [99]. | EBMC shows superior performance, especially for larger data sets. Useful for hypothesis generation and prioritizing validation experiments [99]. |
Conclusion
Ubiquitylomics has emerged as a transformative approach for comprehensively mapping the ubiquitination landscape in cancerous versus normal tissues, revealing critical insights into tumor metabolism, immune modulation, and cancer stem cell maintenance. The integration of advanced mass spectrometry with optimized enrichment protocols now enables deep, quantitative profiling of ubiquitination signatures directly from clinical specimens. These ubiquitination maps provide unprecedented opportunities for identifying novel therapeutic targets, developing targeted degradation approaches like PROTACs, and discovering biomarkers for patient stratification. Future directions should focus on expanding ubiquitylomic profiling across diverse cancer types, integrating multi-omics datasets, and developing computational tools for predicting ubiquitination network vulnerabilities. As methodologies continue to advance in sensitivity and throughput, ubiquitylomics promises to play an increasingly central role in precision oncology and the development of next-generation cancer therapeutics targeting the ubiquitin-proteasome system.
References
- 1. E3 ubiquitin ligases: styles, structures and functions - PMC [https://pmc.ncbi.nlm.nih.gov/articles/PMC8607428/]
- 2. The Role of Ubiquitination and Deubiquitination in ... [https://www.mdpi.com/2227-9059/13/12/2873]
- 3. Modulation of the Ubiquitin-Proteasome System by ... [https://www.sciencedirect.com/science/article/pii/S095528632500289X]
- 4. Quantitative ubiquitylomics reveals the ubiquitination ... [https://www.sciencedirect.com/org/science/article/pii/S1573493521002824]
- 5. The emerging role of E3 ubiquitin ligases and deubiquitinases ... [https://translational-medicine.biomedcentral.com/articles/10.1186/s12967-025-06255-2]
- 6. Ubiquitin-proteasome system: a potential participant and ... [https://pmc.ncbi.nlm.nih.gov/articles/PMC11876059/]
- 7. K48- and K63-linked ubiquitin chain interactome reveals ... [https://pmc.ncbi.nlm.nih.gov/articles/PMC11109483/]
- 8. Emerging functions of branched ubiquitin chains [https://www.nature.com/articles/s41421-020-00237-y]
- 9. Unraveling chain specific ubiquitination in cells using ... [https://www.nature.com/articles/s41598-025-07242-9]
- 10. The K48-K63 Branched Ubiquitin Chain Regulates NF-κB ... [https://www.sciencedirect.com/science/article/pii/S1097276516305639]
- 11. Proteomic analyses reveal divergent ubiquitylation patterns ... [https://www.sciencedirect.com/science/article/abs/pii/S1874391920302025]
- 12. Ubiquitination Enzymes in Cancer, Cancer Immune ... [https://pubmed.ncbi.nlm.nih.gov/39851497/]
- 13. USP39 promote post-translational modifiers to stimulate ... [https://link.springer.com/article/10.1007/s12672-025-02573-5]
- 14. Current methodologies in protein ubiquitination characterization [https://cellandbioscience.biomedcentral.com/articles/10.1186/s13578-022-00870-y]
- 15. Proteomic signatures of 16 major types of human cancer ... [https://jhoonline.biomedcentral.com/articles/10.1186/s13045-020-01013-x]
- 16. Proteomic Analysis of FFPE Tissue Samples Identifies ... [https://pmc.ncbi.nlm.nih.gov/articles/PMC12322959/]
- 17. Quantitative ubiquitylomics reveals the ubiquitination regulation... [https://pubmed.ncbi.nlm.nih.gov/34350460/]
- 18. Time-resolved in vivo ubiquitinome by DIA-MS reveals... profiling [https://www.nature.com/articles/s41467-021-25454-1?error=cookies_not_supported&code=4b779454-dd70-4efc-8758-2fba83a0a525]
- 19. Selecting precise reference normal samples for tissue ... cancer [https://bmcmedgenomics.biomedcentral.com/articles/10.1186/s12920-018-0463-6]
- 20. Refined Preparation and Use of Anti-diglycine Remnant (K- ... [https://pmc.ncbi.nlm.nih.gov/articles/PMC3591673/]
- 21. Ubiquitin diGLY proteomics as an approach to identify and ... [https://pmc.ncbi.nlm.nih.gov/articles/PMC6791129/]
- 22. Quantitative ubiquitylomics reveals the ubiquitination ... [https://pmc.ncbi.nlm.nih.gov/articles/PMC8385350/]
- 23. Data-independent acquisition method for ubiquitinome ... [https://www.nature.com/articles/s41467-020-20509-1]
- 24. Ubiquitylomics: An Emerging Approach for Profiling Protein ... [https://pmc.ncbi.nlm.nih.gov/articles/PMC11634490/]
- 25. Improvement of ubiquitylation site detection by Orbitrap ... [https://www.sciencedirect.com/science/article/pii/S1874391917303718]
- 26. Quantitative Lys-ϵ-Gly-Gly (diGly) Proteomics Coupled ... [https://www.sciencedirect.com/science/article/pii/S002192582037366X]
- 27. Ubiquitination and deubiquitination in cancer [https://molecular-cancer.biomedcentral.com/articles/10.1186/s12943-024-02046-3]
- 28. Integrated analysis of the ubiquitination mechanism reveals the... [https://bmcgenomics.biomedcentral.com/articles/10.1186/s12864-023-09583-z]
- 29. The role of ubiquitination and deubiquitination in cancer ... [https://www.frontiersin.org/journals/oncology/articles/10.3389/fonc.2025.1464914/full]
- 30. Constructing a pancancer ubiquitination regulatory network to ... [https://pmc.ncbi.nlm.nih.gov/articles/PMC12382526/]
- 31. Frontiers | Multi -omics analysis identifies UBA family as potential... [https://www.frontiersin.org/journals/immunology/articles/10.3389/fimmu.2025.1510503/full]
- 32. Pan-cancer multi-omics profiling reveals ubiquitin D as a ... [https://pmc.ncbi.nlm.nih.gov/articles/PMC12480306/]
- 33. Prognostic model of ubiquitination-related genes in ovarian ... [https://pmc.ncbi.nlm.nih.gov/articles/PMC12450667/]
- 34. Identification of biomarkers based on ubiquitin-correlated ... [https://www.frontiersin.org/journals/pharmacology/articles/10.3389/fphar.2025.1646396/full]
- 35. Comprehensive characterization of ubiquitinome of human ... [https://translational-medicine.biomedcentral.com/articles/10.1186/s12967-022-03645-8]
- 36. Proteomic Analysis of Protein Ubiquitination Events in ... [https://www.frontiersin.org/journals/oncology/articles/10.3389/fonc.2020.01684/full]
- 37. Western Blot Sample Preparation Protocol [https://www.novusbio.com/support/support-by-application/western-blot-sample-preparation]
- 38. Overview of Cell Lysis and Protein... | Thermo Fisher Scientific - RU [https://www.thermofisher.com/ru/ru/home/life-science/protein-biology/protein-biology-learning-center/protein-biology-resource-library/pierce-protein-methods/overview-cell-lysis-and-protein-extraction.html]
- 39. Sample preparation for western blot | Abcam [https://www.abcam.com/en-us/technical-resources/guides/western-blot-guide/sample-preparation-for-western-blot]
- 40. Comprehensive Guide to Cell Lysis and Protein Extraction Method [https://www.creative-proteomics.com/resource/comprehensive-guide-cell-lysis-protein-extraction.htm]
- 41. Rapid and deep-scale ubiquitylation profiling for biology ... [https://www.nature.com/articles/s41467-019-14175-1]
- 42. Trypsin Digestion Protocols | Proteomics & Mass ... [https://www.upstate.edu/proteomics/prep/trypsin.php]
- 43. Quantitative Ubiquitylomic Analysis of the Dynamic ... [https://www.frontiersin.org/journals/plant-science/articles/10.3389/fpls.2022.890581/full]
- 44. Time-lapse tryptic digestion: a proteomic approach to ... [https://pmc.ncbi.nlm.nih.gov/articles/PMC11974830/]
- 45. Uncovering the profile of ubiquitination motif in catalytic ... [https://www.sciencedirect.com/science/article/pii/S2950248924000105]
- 46. What is 4D Label-free Quantitative Proteomics? [https://www.creative-proteomics.com/proteomics/protein-science/4d-label-free-proteomics.html]
- 47. Time-resolved in vivo ubiquitinome profiling by DIA-MS ... [https://www.nature.com/articles/s41467-021-25454-1]
- 48. Quantitative Ubiquitylomics Analysis Service [https://www.creative-proteomics.com/ptms-proteomics/quantitative-ubiquitylomics-analysis-service.htm]
- 49. Automating UbiFast for High-throughput and Multiplexed Ubiquitin... [https://pubmed.ncbi.nlm.nih.gov/34592423/]
- 50. Automating UbiFast for High-throughput and Multiplexed ... [https://www.sciencedirect.com/science/article/pii/S1535947621001262]
- 51. Automating UbiFast for High-throughput and Multiplexed ... [https://pmc.ncbi.nlm.nih.gov/articles/PMC9357436/]
- 52. Solved through Optimized TMT Labeling and Expert Service [https://www.linkedin.com/pulse/challenge-proteomics-complexity-solved-through-optimized-duh2c]
- 53. Current Insights on Salivary Gland Adenoid Cystic ... [https://www.mdpi.com/2073-4425/16/4/370]
- 54. Decoding the ubiquitin network: molecular mechanisms and ... [https://molecular-cancer.biomedcentral.com/articles/10.1186/s12943-025-02433-4]
- 55. Salivary glands adenoid cystic carcinoma: a molecular ... [https://www.frontiersin.org/journals/oncology/articles/10.3389/fonc.2023.1191218/full]
- 56. AI helps find promising therapeutic target for rare salivary ... [https://www.uchicagomedicine.org/forefront/cancer-articles/2025/march/ai-helps-find-promising-therapeutic-target]
- 57. Transcriptomes define distinct subgroups of salivary gland ... [https://mdanderson.elsevierpure.com/en/publications/transcriptomes-define-distinct-subgroups-of-salivary-gland-adenoi/]
- 58. Ubiquitination-mediated molecular pathway alterations in ... [https://pmc.ncbi.nlm.nih.gov/articles/PMC9520991/]
- 59. Research progress of deubiquitinating enzymes in cerebral ... [https://pmc.ncbi.nlm.nih.gov/articles/PMC12171222/]
- 60. Targeting deubiquitinating enzymes (DUBs) and ubiquitin ... [https://pubmed.ncbi.nlm.nih.gov/39975367/]
- 61. Molecular glues that inhibit deubiquitylase activity and ... [https://www.nature.com/articles/s41594-025-01517-5]
- 62. Optimising methods for the preservation, capture and ... [https://www.sciencedirect.com/science/article/pii/S0006291X15305015]
- 63. Integrative Multi-Omics Analysis Reveals the Molecular ... [https://pmc.ncbi.nlm.nih.gov/articles/PMC12250011/]
- 64. Mass Spectrometry for Lysine Methylation [https://www.mdpi.com/2227-9059/13/11/2825]
- 65. Recent advancements in sample pretreatment methods for ... [https://www.biophysics-reports.org/article/doi/10.52601/bpr.2025.240072]
- 66. Ubiquitomics: An Overview and Future - PMC [https://pmc.ncbi.nlm.nih.gov/articles/PMC7603029/]
- 67. Quantitative Analysis of Ubiquitinated Proteins in Human ... [https://www.frontiersin.org/journals/endocrinology/articles/10.3389/fendo.2019.00328/full]
- 68. Overcoming Barriers in Cancer Biology Research [https://pubmed.ncbi.nlm.nih.gov/40647400/]
- 69. Quantitative Ubiquitylome Analysis Reveals the Specificity ... [https://www.sciencedirect.com/science/article/pii/S1535947621001456]
- 70. Quantitative Trait Loci Analysis Using the False Discovery ... [https://pmc.ncbi.nlm.nih.gov/articles/PMC1456787/]
- 71. Silencing NEDD4L Effectively Inhibits the Malignant Behaviors ... [https://pmc.ncbi.nlm.nih.gov/articles/PMC12258406/]
- 72. False Discovery Rate and Localizing Power [https://arxiv.org/html/2401.03554v2]
- 73. Emerging drug development technologies targeting ... [https://pmc.ncbi.nlm.nih.gov/articles/PMC7112620/]
- 74. Protocol for In Vitro Ubiquitin Conjugation Reaction [https://www.rndsystems.com/resources/protocols/vitro-ubiquitin-conjugation-reaction]
- 75. Integrative proximal-ubiquitomics profiling for ... [https://www.sciencedirect.com/science/article/pii/S2451945625001278]
- 76. The Analysis of the Ubiquitylomic Responses to Streptococcus ... [https://pmc.ncbi.nlm.nih.gov/articles/PMC9342659/]
- 77. The Emerging Role of Non-traditional Ubiquitination in ... [https://pmc.ncbi.nlm.nih.gov/articles/PMC5339741/]
- 78. Pan-cancer multi-omics profiling reveals ubiquitin D as a ... [https://link.springer.com/article/10.1007/s12672-025-03545-5]
- 79. A Molecular Signature of the Ubiquitin-Proteasome System for ... [https://pmc.ncbi.nlm.nih.gov/articles/PMC11627108/]
- 80. Integrating multi-omics and experimental techniques to ... [https://www.frontiersin.org/journals/pharmacology/articles/10.3389/fphar.2025.1545472/full]
- 81. Ubiquitin-specific protease 48 drives malignant ... [https://www.nature.com/articles/s41418-025-01617-1]
- 82. Identification of ubiquitin markers for survival and ... [https://www.sciencedirect.com/science/article/pii/S2405844024133191]
- 83. Integration of multi-omics approaches in exploring intra ... [https://pmc.ncbi.nlm.nih.gov/articles/PMC12395700/]
- 84. The ubiquitin code of RAS proteins: Decoding its role in ... [https://www.sciencedirect.com/science/article/pii/S2589004225012908]
- 85. Prognostic value of ubiquitination-related differentially ... [https://pmc.ncbi.nlm.nih.gov/articles/PMC11635202/]
- 86. Nonproteolytic ubiquitination regulates chromatin occupancy ... [https://pmc.ncbi.nlm.nih.gov/articles/PMC12067245/]
- 87. Unbiased mapping of cereblon neosubstrate landscape by ... [https://pmc.ncbi.nlm.nih.gov/articles/PMC12368047/]
- 88. Root Membrane Ubiquitinome under Short-Term Osmotic Stress [https://pmc.ncbi.nlm.nih.gov/articles/PMC8879470/]
- 89. PROTAC: a revolutionary technology propelling small ... [https://pmc.ncbi.nlm.nih.gov/articles/PMC12597787/]
- 90. E3 ubiquitin ligases in signaling, disease, and therapeutics [https://www.sciencedirect.com/science/article/pii/S0968000425001860]
- 91. Recent Advances in the Development of Pro-PROTAC for ... [https://pmc.ncbi.nlm.nih.gov/articles/PMC12473374/]
- 92. The Expanding E3 Ligase-Ligand Landscape for PROTAC ... [https://www.mdpi.com/2813-3137/3/4/30]
- 93. Design and development of PROTACs: A new paradigm in ... [https://www.sciencedirect.com/science/article/pii/S2590098625000181]
- 94. E3 ligase ligand optimization of Clinical PROTACs [https://www.frontiersin.org/journals/chemistry/articles/10.3389/fchem.2023.1098331/full]
- 95. Development of a targeted BioPROTAC degrader selective ... [https://www.nature.com/articles/s41467-025-65481-w]
- 96. Multi-omics integration highlights the role of ubiquitination ... [https://pmc.ncbi.nlm.nih.gov/articles/PMC11089738/]
- 97. The Future of Clinical Trials: Incorporating 'Omics for ... [https://blog.crownbio.com/the-future-of-clinical-trials-incorporating-omics-for-enhanced-stratification]
- 98. Multi-omics approaches in cancer research with applications in tumor subtyping, prognosis, and diagnosis - PMC [https://pmc.ncbi.nlm.nih.gov/articles/PMC7868685/]
- 99. Computational methods for ubiquitination site prediction using ... [https://pmc.ncbi.nlm.nih.gov/articles/PMC4778322/]