Unlocking the Ubiquitinome: A Comprehensive Guide to DIA Mass Spectrometry for Researchers
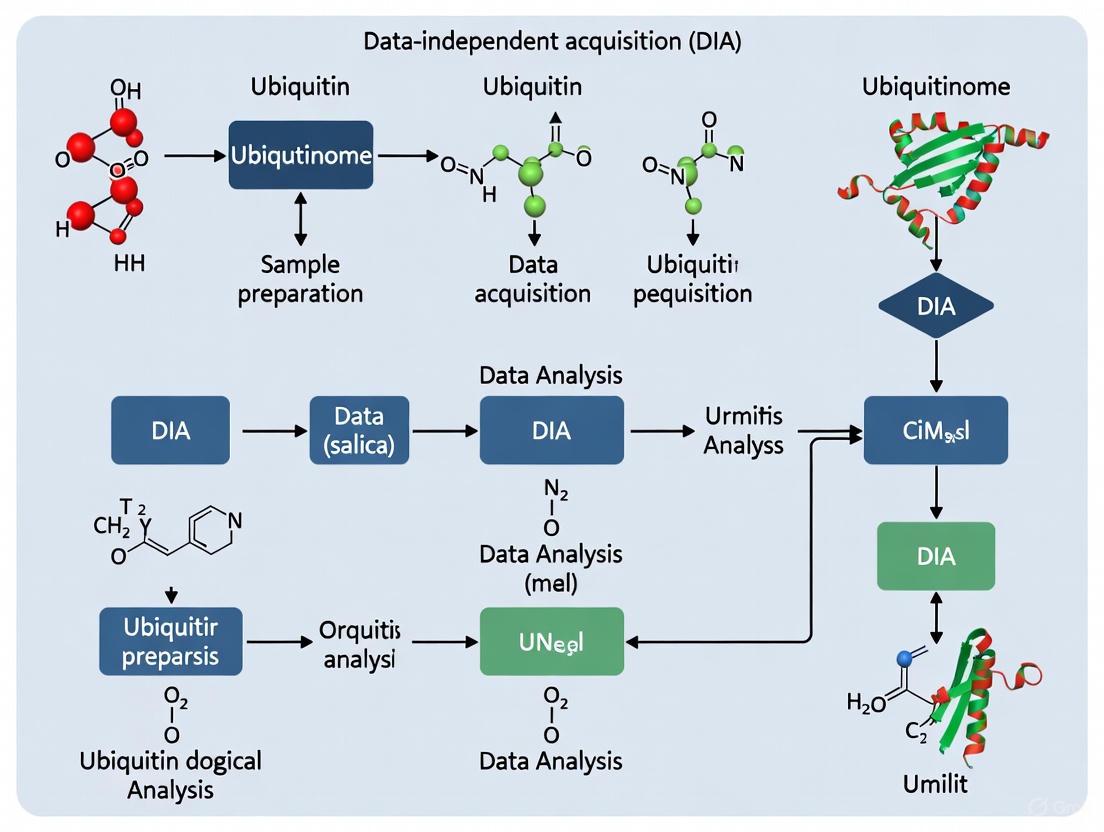
Data-independent acquisition (DIA) mass spectrometry is revolutionizing ubiquitinome analysis by providing unprecedented depth, reproducibility, and quantitative accuracy.
Unlocking the Ubiquitinome: A Comprehensive Guide to DIA Mass Spectrometry for Researchers
Abstract
Data-independent acquisition (DIA) mass spectrometry is revolutionizing ubiquitinome analysis by providing unprecedented depth, reproducibility, and quantitative accuracy. This article explores the foundational principles of DIA-based ubiquitinomics, detailing optimized workflows from sample preparation to data analysis. It provides a methodological guide for applying DIA to study ubiquitin signaling in contexts like targeted protein degradation and circadian biology, alongside practical troubleshooting advice to overcome common pitfalls. Finally, it validates DIA's superior performance through direct comparison with traditional DDA methods, establishing it as an indispensable tool for drug discovery and systems biology.
Ubiquitin Signaling and the DIA Revolution: Core Concepts and System-Wide Profiling
The ubiquitin-proteasome system (UPS) represents a crucial regulatory pathway in eukaryotic cells, governing not only protein degradation but also an extensive array of non-proteolytic signaling functions. Historically characterized as a primary mechanism for targeted protein destruction, the UPS's role has expanded to include regulation of inflammatory signaling, DNA repair, endocytosis, and mitochondrial quality control through non-degradative ubiquitination. The development of data-independent acquisition (DIA) mass spectrometry has revolutionized ubiquitinome analysis, enabling unprecedented depth and quantitative accuracy in mapping ubiquitination events. This technological advancement reveals the exquisite complexity of ubiquitin signaling, with particular implications for drug discovery and therapeutic intervention in cancer, neurodegenerative disorders, and inflammatory diseases. This document provides detailed application notes and experimental protocols for investigating both degradative and non-degradative functions of the UPS, with specific emphasis on DIA-based ubiquitinome analysis methodologies that form the core of modern ubiquitin research.
The ubiquitin-proteasome system comprises a sophisticated enzymatic cascade that conjugates the small protein ubiquitin to substrate proteins, determining their fate through a diverse signaling code. The system operates through a sequential enzymatic cascade: ubiquitin-activating enzymes (E1) initiate the process through ATP-dependent ubiquitin activation, followed by transfer to ubiquitin-conjugating enzymes (E2), and finally substrate-specific modification by ubiquitin ligases (E3) [1] [2]. This coordinated enzymatic machinery enables the specific recognition of thousands of cellular proteins for modification.
Ubiquitin itself contains seven lysine residues (K6, K11, K27, K29, K33, K48, K63) that serve as potential linkage points for polyubiquitin chain formation. The chain topology determines the functional outcome: K48-linked chains typically target substrates for proteasomal degradation, while K63-linked chains and monoubiquitination mediate non-degradative signaling in processes such as inflammatory pathway activation and DNA damage repair [3] [1] [4]. The UPS also incorporates deubiquitinating enzymes (DUBs) that reverse ubiquitination, creating a dynamic, reversible signaling system comparable to phosphorylation [3].
Table 1: Core Components of the Ubiquitin-Proteasome System
| Component | Number in Humans | Primary Function | Key Features |
|---|---|---|---|
| E1 Enzymes | 2 | Ubiquitin activation | ATP-dependent, forms thioester bond with ubiquitin |
| E2 Enzymes | ~50 | Ubiquitin conjugation | Transient E2-ubiquitin thioester intermediate |
| E3 Ligases | >600 | Substrate recognition | Determine specificity; RING, HECT, RBR classes |
| DUBs | ~100 | Deubiquitination | Reverse modification; USP, UCH, OTU, MJD, JAMM families |
| Proteasome | 1 complex | Protein degradation | 26S complex: 20S core + 19S regulatory particles |
The 26S proteasome represents the primary degradation machinery of the UPS, consisting of a 20S core particle that houses proteolytic activity and 19S regulatory particles that recognize ubiquitinated substrates, remove ubiquitin chains, unfold proteins, and translocate them into the proteolytic chamber [1]. Beyond this degradative function, the UPS employs a sophisticated signaling language through diverse ubiquitin chain topologies that coordinate virtually all cellular processes through both degradative and non-degradative mechanisms.
DIA-Based Ubiquitinome Analysis: Workflow and Optimization
Revolutionizing Ubiquitinome Analysis with DIA-MS
Traditional data-dependent acquisition (DDA) mass spectrometry approaches for ubiquitinome analysis have faced limitations in sensitivity, reproducibility, and quantitative accuracy due to the low stoichiometry of ubiquitination events and the dynamic range challenges presented by complex cellular lysates. The emergence of data-independent acquisition (DIA) methodologies has transformed ubiquitinome analysis by providing comprehensive coverage and superior quantitative precision [5]. DIA operates by systematically fragmenting all ions within predefined mass-to-charge windows, eliminating stochastic precursor selection and thereby reducing missing values across samples [5].
The critical advantage of DIA for ubiquitinome analysis lies in its ability to consistently detect and quantify over 35,000 distinct diGly-modified peptides in single measurements of proteasome inhibitor-treated cells—approximately double the identification rate achievable with DDA methods [5]. This dramatic improvement in depth and quantitative accuracy (with 45% of diGly peptides showing coefficients of variation below 20% in replicate analyses) enables researchers to capture subtle changes in ubiquitination status across multiple signaling pathways and conditions [5]. The implementation of DIA is particularly valuable for capturing transient ubiquitination events that characterize signaling pathways and for comprehensive profiling of ubiquitination dynamics across biological systems.
Optimized DIA Ubiquitinome Workflow Protocol
Sample Preparation (Days 1-3)
- Cell Culture and Treatment: Culture HEK293 or U2OS cells to 80% confluency in 15-cm dishes. Treat with 10 μM MG132 proteasome inhibitor for 4 hours to enrich ubiquitinated substrates [5].
- Protein Extraction and Digestion: Lyse cells in 8 M urea buffer supplemented with protease and phosphatase inhibitors. Reduce with 5 mM dithiothreitol (60°C, 30 min), alkylate with 15 mM iodoacetamine (room temperature, 30 min in darkness), and dilute to 1.5 M urea with 50 mM Tris-HCl (pH 8.0). Digest with sequencing-grade trypsin (1:50 w/w) overnight at 37°C [5].
- Peptide Desalting: Desalt digested peptides using C18 solid-phase extraction cartridges according to manufacturer's instructions. Lyophilize and quantify using spectrophotometric methods.
diGly Peptide Enrichment (Day 4)
- Antibody Binding: Resuspend 1 mg of peptide material in 1 mL immunoaffinity purification buffer. Add 31.25 μg of anti-diGly remnant motif (K-ε-GG) antibody and incubate with gentle mixing for 2 hours at 4°C [5].
- Peptide Capture: Add protein A/G agarose beads and incubate for an additional 1 hour. Pellet beads by gentle centrifugation (2000 × g, 2 min) and wash three times with cold PBS.
- Peptide Elution: Elute diGly peptides with 0.15% trifluoroacetic acid. Desalt using C18 StageTips and lyophilize for MS analysis.
DIA Mass Spectrometry Analysis (Day 5)
- Chromatography: Reconstitute peptides in 0.1% formic acid and separate using a 60-minute linear gradient (5-30% acetonitrile) on a 25-cm C18 column with 1.9-μm particle size [5].
- DIA Acquisition: Utilize an Orbitrap mass spectrometer with the following parameters: 46 variable windows covering 400-1000 m/z, MS1 resolution 120,000, MS2 resolution 30,000, normalized AGC target 100%, and maximum injection time 55 ms [5].
- Quality Control: Include a standard diGly peptide sample to monitor instrument performance and enrichment efficiency.
Data Processing and Analysis (Days 6-7)
- Spectral Library Generation: Construct a comprehensive spectral library using DDA analyses of fractionated diGly-enriched samples from relevant cell types or tissues.
- DIA Data Extraction: Process raw files using Spectronaut or similar software against the spectral library with standard settings.
- Bioinformatic Analysis: Perform statistical analysis of ubiquitination changes, pathway enrichment using tools like Ingenuity Pathway Analysis, and visualization in R or Python.
Diagram 1: Comprehensive DIA ubiquitinome analysis workflow. The optimized protocol enables identification of >35,000 diGly sites in single measurements.
Critical Optimization Parameters for DIA Ubiquitinome Analysis
Successful implementation of DIA for ubiquitinome analysis requires careful optimization of several key parameters. The precursor mass range should be divided into 46 variable windows tailored to the unique characteristics of diGly-modified peptides, which often generate longer peptides with higher charge states due to impeded C-terminal cleavage at modified lysine residues [5]. The fragment ion resolution should be set to 30,000 to maximize sensitivity while maintaining reasonable cycle times. For antibody-based enrichment, the optimal ratio is 31.25 μg anti-diGly antibody per 1 mg of peptide input, with only 25% of the total enriched material required for injection due to the exceptional sensitivity of DIA detection [5].
Table 2: Performance Comparison: DDA vs. DIA for Ubiquitinome Analysis
| Parameter | Data-Dependent Acquisition (DDA) | Data-Independent Acquisition (DIA) |
|---|---|---|
| diGly Peptides Identified | ~20,000 in single runs | ~35,000 in single runs |
| Quantitative Precision (CV) | 15% of peptides with CV <20% | 45% of peptides with CV <20% |
| Data Completeness | ~40% missing values across replicates | <10% missing values across replicates |
| Required Sample Input | 2-4 mg peptide material | 1 mg peptide material |
| Dynamic Range | Limited for low-abundance ubiquitination events | Enhanced detection of low-stoichiometry sites |
| Spectral Libraries | Project-specific libraries needed | Comprehensive libraries (>90,000 diGly peptides) |
The creation of a comprehensive spectral library represents the most critical factor for successful DIA ubiquitinome analysis. Researchers should develop libraries containing >90,000 diGly peptides through extensive fractionation (96 fractions consolidated to 8 pools) of multiple cell types, including both proteasome-inhibited and untreated conditions to capture the full diversity of ubiquitination events [5]. For specialized applications, such as analysis of phosphorylation-dependent ubiquitin signaling (e.g., pS65-Ub in mitophagy), libraries should include relevant post-translational modifications on ubiquitin itself [6] [7].
Application Note 1: Non-Degradative Ubiquitin Signaling in Innate Immunity
Protocol: Monitoring K63-Linked Ubiquitination in TLR Signaling
Background and Principle Toll-like receptor (TLR) signaling represents a paradigm of non-degradative ubiquitination, where K63-linked ubiquitin chains serve as scaffolding platforms for the assembly of multiprotein complexes that launch innate immune responses [3]. This protocol details the monitoring of K63-linked ubiquitination events following TLR activation using DIA-based ubiquitinome analysis combined with linkage-specific immunoblotting.
Reagents and Solutions
- TLR agonists: LPS (TLR4), Pam3CSK4 (TLR2)
- Lysis buffer: 50 mM Tris-HCl (pH 7.5), 150 mM NaCl, 1% NP-40, 0.5% sodium deoxycholate, 0.1% SDS, plus protease and phosphatase inhibitors
- K63-linkage specific ubiquitin antibody (e.g., Millipore 05-1308)
- TNF-α and IL-1β for positive control stimulation
Experimental Procedure
- Cell Stimulation: Seed THP-1 or primary macrophages in 10-cm dishes (2 × 10^6 cells/dish). Stimulate with TLR agonists (100 ng/mL LPS or 1 μg/mL Pam3CSK4) for 0, 15, 30, 60, and 120 minutes.
- Sample Preparation: Lyse cells in 1 mL ice-cold lysis buffer with sonication (3 × 10-second pulses). Clarify by centrifugation (16,000 × g, 15 min, 4°C).
- Ubiquitinome Analysis: Process 1 mg of protein lysate according to the DIA ubiquitinome workflow described in Section 3.2.
- Immunoblot Validation: Resolve 30 μg of protein by SDS-PAGE, transfer to PVDF membrane, and probe with K63-linkage specific ubiquitin antibody (1:1000 dilution).
- Immunoprecipitation: For specific targets like TRAF6, pre-clear 500 μg lysate with protein A/G beads, then incubate with 1 μg anti-TRAF6 antibody overnight at 4°C. Capture with protein A/G beads, wash, and elute with 2× Laemmli buffer for ubiquitin immunoblotting.
Data Analysis and Interpretation Process DIA data against a spectral library enriched for immune signaling components. Focus on known NF-κB pathway components (TRAF6, IRAK1, NEMO) and identify K63-linked ubiquitination events by correlation with linkage-specific immunoblots. The kinetic profile of ubiquitination should reveal rapid (15-30 minute), transient modifications that correspond with pathway activation. Key validation targets include TRAF6 auto-ubiquitination and NEMO ubiquitination, both critical for IKK complex activation [3].
Deubiquitination Regulation Analysis: A20 DUB Function
The zinc finger protein A20 (TNFAIP3) represents a critical negative regulator of NF-κB signaling through its dual ubiquitin-editing function, demonstrating the importance of deubiquitination in maintaining signaling homeostasis [3].
A20 DUB Activity Assessment Protocol
- A20 Immunoprecipitation: Prepare lysates from TLR-stimulated cells as above. Incubate 500 μg lysate with 2 μg anti-A20 antibody for 4 hours at 4°C.
- DUB Activity Assay: Wash immunoprecipitates with DUB assay buffer (50 mM Tris-HCl pH 7.5, 150 mM NaCl, 5 mM DTT). Incubate with 500 ng K63-linked ubiquitin chains (Boston Biochem) for 1 hour at 37°C.
- Reaction Analysis: Resolve reactions by SDS-PAGE and silver stain or immunoblot for ubiquitin.
- Functional Validation: Knockdown A20 using siRNA and monitor sustained ubiquitination of TRAF6, RIP1, and other NF-κB pathway components by DIA ubiquitinome analysis.
The power of DIA ubiquitinome analysis in this context lies in its ability to simultaneously monitor multiple substrate deubiquitination events regulated by A20, providing systems-level insight into DUB function rather than single-substrate observations.
Diagram 2: Non-degradative ubiquitin signaling in NF-κB activation. K63-linked ubiquitin chains serve as scaffolding platforms for signal transduction, regulated by A20 deubiquitination.
Application Note 2: Mitochondrial Quality Control via PARKIN/PINK1
Protocol: Analyzing Phospho-Ubiquitin in Mitophagy
Background and Principle The PINK1/PARKIN pathway represents a sophisticated example of ubiquitin phosphorylation regulating mitochondrial quality control. Upon mitochondrial damage, PINK1 accumulates on the outer mitochondrial membrane and phosphorylates both PARKIN and ubiquitin at Ser65, creating a feed-forward amplification mechanism that drives mitophagy [6] [8] [7]. This protocol details the analysis of ubiquitin phosphorylation and mitochondrial ubiquitylation during mitophagy induction.
Reagents and Solutions
- Mitochondrial uncouplers: 10 μM carbonyl cyanide m-chlorophenyl hydrazone (CCCP) or 20 μM antimycin A + 1 μM oligomycin A
- Lysis buffer: 20 mM HEPES (pH 7.4), 150 mM NaCl, 1% Triton X-100, 1 mM EDTA, plus protease and phosphatase inhibitors
- Phospho-Ser65 ubiquitin antibody (CST #62808)
- Mitochondrial isolation kit (e.g., Abcam ab110168)
Experimental Procedure
- Mitophagy Induction: Culture HeLa or SH-SY5Y cells stably expressing PARKIN to 80% confluency in 15-cm dishes. Treat with 10 μM CCCP for 0, 1, 2, 4, and 8 hours.
- Mitochondrial Isolation: For subcellular fractionation, harvest cells by scraping and isolate mitochondria using a commercial mitochondrial isolation kit according to manufacturer's instructions.
- Ubiquitinome Analysis: Process whole cell lysates (1 mg) and mitochondrial fractions (200 μg) according to the DIA ubiquitinome workflow in Section 3.2.
- Phospho-Ubiquitin Monitoring: Resolve 30 μg of mitochondrial proteins by SDS-PAGE and immunoblot with phospho-Ser65 ubiquitin antibody (1:1000).
- PARKIN Recruitment Assessment: Fix parallel samples at each time point and immunostain for PARKIN and TOM20 (mitochondrial marker) to monitor PARKIN translocation.
Data Analysis and Interpretation Process DIA data against a spectral library enriched for mitochondrial proteins. Focus on known PARKIN substrates (MFN1, MFN2, VDAC1, CISD1) and quantify ubiquitination kinetics [6]. The temporal sequence should reveal early monoubiquitination events (30-60 minutes) progressing to polyubiquitination (2-4 hours) on multiple mitochondrial outer membrane proteins. Correlation with phospho-Ser65 ubiquitin signal should demonstrate the feed-forward relationship between ubiquitin phosphorylation and substrate ubiquitylation. Key analytical challenges include distinguishing between K48-linked chains (proteasomal degradation of individual proteins) and K6/K63-linked chains (mitophagy receptor recruitment) [6] [7].
Advanced Technique: UB-Replacement System for Phospho-Ubiquitin Function
To definitively establish the role of ubiquitin phosphorylation in mitophagy, implement a UB-replacement system that enables expression of ubiquitin mutants in cells depleted of endogenous ubiquitin [6].
UB-Replacement Protocol
- Cell Engineering: Generate U2OS cells expressing doxycycline-inducible shRNA targeting all endogenous ubiquitin genes while simultaneously expressing shRNA-resistant UBWT or UBS65A.
- UB Depletion and Replacement: Treat cells with 1 μg/mL doxycycline for 5 days to deplete endogenous ubiquitin and express replacement ubiquitin variants.
- PARKIN Expression: Introduce low levels of PARKINWT, PARKINS65A, or PARKINC431S via lentiviral transduction.
- Functional Assessment: Induce mitophagy with CCCP and assess via:
- Mitochondrial ubiquitylation by DIA ubiquitinome analysis
- PARKIN recruitment by immunofluorescence
- Mitophagy efficiency by flow cytometry measuring mitochondrial membrane potential loss
- Quantitative Proteomics: Use parallel reaction monitoring (PRM) to precisely quantify pS65-Ub stoichiometry during mitophagy induction [7].
This sophisticated approach reveals that while PARKIN activation and initial substrate monoubiquitination can occur without ubiquitin phosphorylation, efficient polyubiquitin chain formation, PARKIN retention on mitochondria, and complete mitophagy require S65 ubiquitin phosphorylation [6]. The DIA ubiquitinome analysis in this system provides unprecedented insight into the quantitative requirements for ubiquitin phosphorylation in mitochondrial quality control.
The Scientist's Toolkit: Essential Research Reagents
Table 3: Essential Research Reagents for Ubiquitin-Proteasome System Studies
| Reagent Category | Specific Examples | Research Application | Key Considerations |
|---|---|---|---|
| E1 Inhibitors | PYR-41, TAK-243 | Global ubiquitination blockade | High toxicity; useful for positive controls |
| Proteasome Inhibitors | MG132, Bortezomib, Carfilzomib | Ubiquitinated protein accumulation | MG132 for experimental use; clinical analogs available |
| DUB Inhibitors | PR-619 (pan-DUB), P5091 (USP7) | Deubiquitination inhibition | Varying specificity; off-target effects common |
| Linkage-Specific Antibodies | K48-linkage (CST #8081), K63-linkage (Millipore 05-1308) | Ubiquitin chain typing | Validation required for specific applications |
| diGly Remnant Antibodies | PTMScan Ubiquitin Remnant Motif Kit (CST) | Ubiquitinome enrichment | Critical for MS studies; commercial kits available |
| E3 Ligase Modulators | MLN4924 (NAE1 inhibitor), Nutlin-3 (MDM2 inhibitor) | Specific pathway manipulation | Varying selectivity profiles |
| Ubiquitin Mutants | K48R, K63R, S65A, S65D | Linkage-specific function studies | Combine with replacement systems for clean analysis |
| PINK1/PARKIN Tools | CCCP, Valinomycin, PARKIN inhibitors | Mitophagy studies | Multiple mechanisms of mitochondrial depolarization |
| Activity Probes | Ub-AMC, Ub-rhodamine110 | DUB activity profiling | Fluorescent substrates for kinetic analyses |
| Targeted Degradation Tools | PROTACs, Molecular Glues | Targeted protein degradation research | Heterobifunctional molecules requiring optimization |
Application Note 3: Targeted Protein Degradation Technologies
Protocol: Development and Validation of PROTAC Molecules
Background and Principle PROteolysis TArgeting Chimeras (PROTACs) represent a revolutionary approach in chemical biology and therapeutics that hijacks the ubiquitin-proteasome system for targeted protein degradation [4]. These heterobifunctional molecules consist of a target-binding warhead, an E3 ligase recruiter, and a linker that optimizes ternary complex formation. This protocol outlines the development and validation process for PROTAC molecules.
PROTAC Design and Synthesis
- Warhead Selection: Identify high-affinity ligands for the protein of interest (POI). These can be small-molecule inhibitors, natural products, or fragment-like binders with confirmed target engagement.
- E3 Ligase Ligand Selection: Choose E3-recruiting moieties based on expression in target cells and compatibility with the POI. Common choices include:
- VHL ligands: Adapted from HIF-1α hydroxyproline peptide
- CRBN ligands: Thalidomide derivatives (lenalidomide, pomalidomide)
- MDM2 ligands: Nutlin-based compounds
- cIAP ligands: MV1 analogs
- Linker Optimization: Synthesize PROTACs with varying linker compositions (PEG, alkyl, piperazine) and lengths (5-15 atoms). Empirical testing is essential as linker properties significantly impact degradation efficiency.
- Control Compounds: Include negative controls with warhead or E3 ligand alone, and mismatch pairs that combine irrelevant binding elements.
PROTAC Validation Protocol
- Cellular Degradation Assay:
- Seed appropriate cell lines in 12-well plates (2 × 10^5 cells/well)
- Treat with PROTACs at varying concentrations (1 nM - 10 μM) for 4-16 hours
- Prepare lysates and analyze POI levels by immunoblotting
- Include proteasome (MG132) and neddylation (MLN4924) inhibitors to confirm UPS dependence
- Ternary Complex Assessment:
- Use immunoprecipitation to isolate POI or E3 ligase and probe for associated proteins
- Implement cellular thermal shift assays (CETSA) to monitor stabilization upon ternary complex formation
- Employ biophysical techniques (SPR, ITC) for in vitro binding studies
- Kinetic Analysis:
- Treat cells with PROTAC (100 nM) and harvest at timepoints from 0.5-24 hours
- Monitor POI degradation and recovery kinetics after PROTAC washout
- DIA Ubiquitinome Analysis:
- Process PROTAC-treated samples according to Section 3.2 protocol
- Specifically monitor ubiquitination of the target protein and potential off-targets
- Compare ubiquitination patterns with functional degradation outcomes
Data Interpretation and Optimization Successful PROTACs demonstrate substoichiometric activity (catalytic degradation), with DC50 values typically in the nanomolar range. The DIA ubiquitinome analysis should reveal specific ubiquitination of the target protein without widespread disruption of the global ubiquitinome. PROTACs offer advantages over traditional inhibitors through their event-driven pharmacology, ability to target scaffolding functions, and potential to address drug resistance mechanisms [4].
Protocol: Molecular Glue Degrader Characterization
Background and Principle Molecular glue degraders represent a distinct class of induced proximity agents that typically interact with either an E3 ligase or substrate to create a novel interaction surface, leading to target ubiquitination and degradation [4]. Unlike PROTACs, molecular glues are typically monovalent and smaller in size, offering potential advantages in drug-like properties.
Characterization Workflow
- Target Identification:
- Use chemoproteomic approaches (affinity purification + MS) to identify binding partners
- Implement genetic screens (CRISPR, RNAi) to identify essential pathway components
- Mechanistic Studies:
- Employ cryo-EM or X-ray crystallography to visualize ternary complex structure
- Use hydrogen-deuterium exchange MS to map interaction surfaces
- Implement BRET/FRET assays to monitor complex formation in live cells
- Functional Assessment:
- Monitor target degradation kinetics and specificity
- Assess consequences of degradation on downstream pathway modulation
- DIA Ubiquitinome Analysis:
- Process samples treated with molecular glue degraders using the standard workflow
- Compare ubiquitination patterns with known CRBN or other E3 ligase substrates
- Identify potential neosubrates created by the molecular glue interaction
Key Examples and Applications Classic molecular glue degraders include thalidomide and its analogs (lenalidomide, pomalidomide) that reprogram CRBN E3 ligase activity toward novel substrates like IKZF1/3 transcription factors [4]. The DIA ubiquitinome analysis platform provides an ideal method for comprehensive assessment of degradation specificity and potential off-target effects during molecular glue development.
Diagram 3: PROTAC mechanism of action. Heterobifunctional molecules induce proximity between target proteins and E3 ubiquitin ligases, leading to ubiquitination and proteasomal degradation.
Concluding Perspectives
The ubiquitin-proteasome system continues to emerge as one of the most sophisticated regulatory networks in cell biology, with implications spanning from fundamental biological processes to therapeutic development. The integration of DIA mass spectrometry approaches has transformed our ability to comprehensively monitor ubiquitination dynamics at a systems level, revealing new dimensions of complexity in both degradative and non-degradative ubiquitin signaling. These technological advances coincide with the revolutionary development of targeted protein degradation technologies that leverage the UPS for therapeutic purposes.
Future directions in UPS research will likely focus on several key areas: First, the continued elucidation of non-degradative ubiquitination functions in cellular signaling, particularly in the regulation of membrane dynamics, phase separation, and metabolic adaptation. Second, the development of next-generation degradation technologies that expand beyond the proteasome to leverage lysosomal degradation pathways (LYTACs, AUTACs) and enable targeting of previously "undruggable" proteins. Third, the clinical translation of UPS-targeting agents, with an emphasis on achieving tissue specificity and minimizing off-target effects. Throughout these advances, DIA-based ubiquitinome analysis will remain an essential platform for target validation, mechanism of action studies, and pharmacodynamic assessment in both basic research and therapeutic development.
Protein ubiquitination is a fundamental post-translational modification (PTM) that regulates virtually all cellular processes in eukaryotic cells, including protein degradation, signal transduction, DNA repair, and immune responses [9] [10] [11]. This modification involves the covalent attachment of ubiquitin, a 76-amino acid protein, to target substrates via a three-enzyme cascade consisting of ubiquitin-activating (E1), conjugating (E2), and ligating (E3) enzymes [11] [12]. The versatility of ubiquitin signaling arises from the ability of ubiquitin itself to be modified, forming polyubiquitin chains of different linkages that encode distinct cellular signals [10] [11].
The discovery that tryptic digestion of ubiquitinated proteins leaves a characteristic diGlycine (diGly or K-ε-GG) remnant on modified lysine residues revolutionized the field of ubiquitinomics [9] [11] [12]. This 114.0429 Da mass signature serves as a key handle for both identifying ubiquitination sites and enriching the typically low-abundance ubiquitinated peptides from complex protein digests [12]. With the advent of data-independent acquisition (DIA) mass spectrometry, researchers can now achieve unprecedented depth and quantitative accuracy in ubiquitinome profiling, enabling systems-wide investigations of ubiquitin signaling dynamics [9] [13] [14].
This application note details established protocols for diGly remnant-based ubiquitinome analysis, with particular emphasis on optimized workflows for DIA-MS, and provides a resource for researchers investigating ubiquitin signaling in health and disease.
The DiGly Signature: Mechanism and Specificity
Biochemical Origin
During protein ubiquitination, the C-terminal carboxyl group of glycine 76 (G76) of ubiquitin forms an isopeptide bond with the ε-amino group of a lysine residue on the substrate protein [10] [11]. Subsequent tryptic digestion cleaves the protein backbone after lysine and arginine residues, but the isopeptide bond remains intact. This digestion releases all but the two C-terminal glycine residues (G75-G76) of ubiquitin, which remain attached to the modified lysine on the substrate-derived peptide, creating the characteristic diGly remnant (K-ε-GG) [12].
Specificity Considerations
While the diGly signature is primarily associated with ubiquitination, it is important to note that identical remnants can be generated by ubiquitin-like modifiers (UBLs) such as NEDD8 and ISG15 [9] [15]. Studies indicate that the contribution of these UBLs to the total diGly proteome is generally low (<6%) [9]. For applications requiring absolute specificity for ubiquitin, alternative approaches using antibodies targeting longer ubiquitin-derived remnants (e.g., the K-ε-GGRLRLVLHLTSE remnant from LysC digestion) have been developed [13].
Table 1: Key Characteristics of the DiGly Remnant
| Characteristic | Description | Significance |
|---|---|---|
| Mass Shift | +114.0429 Da on modified lysine | Enables MS-based identification and site localization |
| Origin | C-terminal Gly75-Gly76 of ubiquitin after tryptic digestion | Specific signature of ubiquitin/UBL modification |
| Trypsin Cleavage | Prevents cleavage at the modified lysine | Results in longer peptides with missed cleavages |
| Enrichment Handle | Antigen for anti-K-ε-GG antibodies | Enables enrichment of low-abundance ubiquitinated peptides |
Diagram 1: Formation of the DiGly Remnant. The process involves (1) covalent conjugation of ubiquitin to a substrate lysine, (2) tryptic digestion of the ubiquitinated protein, and (3) generation of a peptide with the characteristic diGly remnant on the modified lysine.
DIA-MS: A Transformative Approach for Ubiquitinomics
Principles and Advantages
Data-independent acquisition (DIA) has emerged as a powerful alternative to traditional data-dependent acquisition (DDA) for ubiquitinome analysis [9] [13] [14]. Unlike DDA, which selectively fragments the most abundant precursors, DIA systematically fragments all ions within predetermined isolation windows, resulting in more complete and reproducible data acquisition [9] [14]. This approach is particularly beneficial for ubiquitinomics due to:
- Enhanced Data Completeness: Dramatically reduced missing values across sample series [9] [13]
- Improved Quantitative Accuracy: More precise and accurate quantification over a wider dynamic range [9]
- Increased Sensitivity: Identification of low-abundance ubiquitination events [9] [13]
Performance Benchmarks
Recent studies have demonstrated the remarkable capabilities of DIA for ubiquitinome profiling. One study combining diGly antibody-based enrichment with optimized Orbitrap-based DIA identified approximately 35,000 diGly peptides in single measurements of proteasome inhibitor-treated cells—doubling the number achieved with DDA [9]. Another report utilizing an improved sample preparation protocol with DIA-MS and neural network-based data processing more than tripled identification numbers to 70,000 ubiquitinated peptides in single MS runs while significantly improving robustness and quantification precision [13].
Table 2: Performance Comparison of DIA vs. DDA for Ubiquitinome Analysis
| Parameter | DDA | DIA | Improvement |
|---|---|---|---|
| Typical DiGly Peptides (single run) | ~21,000 [13] | ~68,000 [13] | >3x increase |
| Quantitative Precision (median CV) | ~20-30% | ~10% [13] | 2-3x improvement |
| Data Completeness | ~50% peptides without missing values in replicates [13] | >90% peptides quantified across replicates [13] | Near-complete data |
| Spectral Libraries | Required for traditional analysis | Can be library-free with modern software [13] | Increased flexibility |
Optimized Protocols for DiGly-Based Ubiquitinome Analysis
Sample Preparation and Lysis
SDC-Based Lysis Protocol [13]
- Reagents: Lysis buffer containing 1-2% sodium deoxycholate (SDC), 10-40 mM chloroacetamide (CAA), 100 mM Tris-HCl (pH 8.5)
- Procedure:
- Lyse cells or tissue in SDC buffer supplemented with CAA
- Immediately boil samples at 95°C for 5-10 minutes to inactivate deubiquitinases
- Sonicate to reduce viscosity and complete lysis
- Cool to room temperature and digest directly with trypsin
- Benefits: SDC-based lysis yields 38% more K-GG peptides compared to conventional urea buffer [13]
Note: Chloroacetamide is preferred over iodoacetamide for alkylation as it does not cause di-carbamidomethylation of lysine residues, which can mimic diGly remnants [13].
Peptide Digestion and DiGly Peptide Enrichment
Trypsin Digestion and Desalting
- Digest lysates with trypsin (1:50-1:100 enzyme-to-protein ratio) at 37°C overnight [12]
- Acidify with trifluoroacetic acid (TFA) to pH < 3 to precipitate SDC
- Desalt peptides using C18 solid-phase extraction cartridges or columns
Anti-K-ε-GG Antibody Enrichment [9] [12]
- Input Material: 1-4 mg of peptide material [9] [13]
- Antibody Amount: 31.25-50 μg anti-K-ε-GG antibody per mg peptide [9]
- Procedure:
- Incubate peptides with antibody conjugated to beads for 1-2 hours at 4°C
- Wash beads extensively with ice-cold PBS or IAP buffer (Cell Signaling Technology)
- Elute diGly peptides with 0.1-0.2% TFA or low-pH buffer
- Desalt eluted peptides using C18 StageTips or columns
Special Consideration: For proteasome inhibitor-treated samples, the abundant K48-linked ubiquitin-chain derived diGly peptide may compete for antibody binding sites. Consider separating fractions containing this highly abundant peptide before enrichment [9].
DIA-MS Acquisition Parameters
Liquid Chromatography
- Column: C18 reversed-phase nanoLC column (75 μm × 25 cm)
- Gradient: 75-180 minutes
- Flow rate: 300 nL/min
- MS1 Resolution: 120,000
- MS2 Resolution: 30,000-45,000
- Isolation Windows: 46 windows of variable width (optimized for diGly precursor distribution)
- Collision Energy: Stepped (e.g., 25, 27.5, 30%)
- AGC Target: Customized for optimal fill times
Data Processing and Analysis
Spectral Libraries
- Option 1: Experimentally generated libraries from fractionated samples (can contain >90,000 diGly peptides) [9]
- Option 2: Library-free analysis using tools like DIA-NN [13]
Software Tools
- DIA-NN: Features specialized scoring for modified peptides, including K-GG peptides [13]
- MaxQuant: Traditional analysis of DDA data for library generation [12]
- Spectronaut: Commercial solution with comprehensive DIA analysis capabilities
Diagram 2: Optimized DIA-MS Workflow for Ubiquitinome Analysis. The integrated process from sample preparation to computational analysis, highlighting key optimized steps for deep ubiquitinome coverage.
The Scientist's Toolkit: Essential Research Reagents
Table 3: Key Reagents for DiGly-Based Ubiquitinome Analysis
| Reagent/Category | Specific Examples | Function and Application Notes |
|---|---|---|
| Anti-diGly Antibodies | PTMScan Ubiquitin Remnant Motif Kit (CST) [9]; UbiSite Antibody [13] [15] | Immunoaffinity enrichment of diGly-modified peptides; UbiSite offers higher specificity for ubiquitin over UBLs |
| Cell Lysis Reagents | SDC buffer with CAA [13]; Urea buffer (traditional) | Protein extraction with protease/deubiquitinase inhibition; SDC shows superior performance |
| Proteasome Inhibitors | MG132, Bortezomib, Carfilzomib [9] [15] | Increase ubiquitinated substrate abundance by blocking degradation |
| DUB Inhibitors | PR619 (broad-spectrum) [15] | Stabilize ubiquitination by preventing deubiquitination |
| Enrichment Resins | Anti-Rabbit IgG Agarose, Protein A/G Beads | Solid support for antibody-mediated peptide capture |
| MS Instrumentation | Orbitrap Tribrid Mass Spectrometers | High-resolution mass analysis for DIA ubiquitinomics |
| Data Analysis Software | DIA-NN [13], MaxQuant [12], Spectronaut | Identification and quantification of diGly peptides |
Applications in Biological Research
Signaling Pathway Analysis
The sensitivity of DIA-based ubiquitinomics enables comprehensive analysis of ubiquitin signaling dynamics. Application to TNFα signaling comprehensively captured known ubiquitination sites while adding many novel ones, providing a more complete picture of this important pathway [9].
Circadian Regulation
An in-depth, systems-wide investigation of ubiquitination across the circadian cycle uncovered hundreds of cycling ubiquitination sites and dozens of cycling ubiquitin clusters within individual membrane protein receptors and transporters, highlighting new connections between metabolism and circadian regulation [9].
Deubiquitinase Target Identification
DIA ubiquitinomics has proven powerful for identifying substrates of deubiquitinating enzymes (DUBs). Upon inhibition of the oncology target USP7, researchers simultaneously recorded ubiquitination and consequent changes in abundance of more than 8,000 proteins at high temporal resolution, distinguishing regulatory ubiquitination leading to protein degradation from non-degradative events [13].
The diGly remnant remains the cornerstone of modern ubiquitinome analysis, providing a specific handle for both enrichment and detection of ubiquitination sites. When combined with DIA-MS methodologies, this signature enables unprecedented depth and quantitative precision in profiling ubiquitin signaling dynamics. The optimized protocols detailed in this application note provide a robust framework for researchers to investigate the ubiquitinome in various biological contexts, from fundamental signaling studies to drug mechanism-of-action investigations. As DIA methodologies continue to evolve and become more accessible, diGly-based ubiquitinomics will undoubtedly remain an essential tool for unraveling the complexities of ubiquitin-mediated cellular regulation.
Mass spectrometry (MS)-based proteomics has undergone a significant methodological evolution, marked by a transition from Data-Dependent Acquisition (DDA) to Data-Independent Acquisition (DIA). This paradigm shift is particularly transformative for the analysis of challenging post-translational modifications such as the ubiquitinome. Ubiquitination, a key regulatory mechanism governing protein stability, signaling, and degradation, presents unique analytical challenges due to its low stoichiometry, dynamic nature, and complex chain architectures. Traditional DDA methods, which selectively fragment the most abundant precursor ions, have been plagued by incomplete sampling and missing values across replicates, fundamentally limiting the robustness and depth of quantitative ubiquitinome studies. In contrast, DIA systematically fragments all ions within sequential, predefined mass windows, enabling comprehensive, unbiased acquisition of fragment ion spectra. This application note details how DIA-MS, combined with optimized sample preparation and bioinformatic workflows, overcomes the inherent limitations of stochastic sampling to provide deep, reproducible, and precise quantification of ubiquitination events, thereby empowering drug discovery efforts focused on targeted protein degradation and deubiquitinase (DUB) inhibition.
Quantitative Performance Comparison: DDA vs. DIA
The superior performance of DIA for ubiquitinome analysis is consistently demonstrated across multiple, independent studies. The following tables summarize key quantitative metrics that highlight this paradigm shift.
Table 1: Overall Performance Comparison in Ubiquitinome Profiling
| Performance Metric | Data-Dependent Acquisition (DDA) | Data-Independent Acquisition (DIA) | Improvement Factor | Citation |
|---|---|---|---|---|
| Typical Ubiquitinated Peptide IDs (Single Shot) | ~20,000 - 21,434 peptides | ~35,000 - 68,429 peptides | 2x to 3x increase | [13] [5] |
| Quantitative Reproducibility (Median CV) | ~17% (Proteomics) | ~10% (Proteomics) | ~40% improvement | [16] [13] |
| Data Completeness (Protein/Peptide Level) | ~42% - 69% | ~78% - 93% | Drastic reduction in missing values | [16] [17] |
| Spectral Library Depth | Limited by stochastic sampling | >90,000 diGly peptides possible | Enables deeper retrospective analysis | [5] |
Table 2: Performance in General Proteomics and Ubiquitinome-Specific Workflows
| Application Context | DDA Performance | DIA Performance | Notes | |
|---|---|---|---|---|
| General Proteomics (Tear Fluid) | 396 proteins, 1,447 peptides | 701 proteins, 2,444 peptides | DIA showed 78.7% data completeness vs. 42% for DDA [16] | |
| General Proteomics (Mouse Liver - Orbitrap Astral) | 2,500 - 3,600 protein groups | Over 10,000 protein groups | 93% data completeness for DIA vs. 69% for DDA [17] | |
| Ubiquitinome (Single-Shot, MG132-treated cells) | ~20,000 diGly peptides | ~35,000 diGly peptides | DIA doubles identifications with superior accuracy [5] | |
| Ubiquitinome (Optimized Workflow) | 21,434 diGly peptides | 68,429 diGly peptides | More than triples identification numbers [13] | |
| Low-Abundance Protein Coverage | Limited by dynamic exclusion | >2-fold increase in quantified peptides | Extends dynamic range by an order of magnitude [17] |
Detailed Experimental Protocol for DIA-Based Ubiquitinome Analysis
The following section provides a step-by-step protocol for deep ubiquitinome profiling using a DIA-MS workflow, optimized from recently published methods [13] [5].
Sample Preparation and Lysis
- Cell Culture and Treatment: Culture cells (e.g., HCT116, HEK293) under standard conditions. To stabilize ubiquitinated substrates, treat cells with a proteasome inhibitor such as MG-132 (10 µM for 4-6 hours). Include appropriate vehicle controls.
- Rapid Lysis and Protein Extraction: Aspirate culture medium and wash cells with ice-cold PBS. Lyse cells directly in plates using SDC Lysis Buffer.
- SDC Lysis Buffer Composition: 1% (w/v) Sodium Deoxycholate (SDC), 100 mM Tris-HCl (pH 8.5), 10 mM Tris(2-carboxyethyl)phosphine (TCEP), 40 mM Chloroacetamide (CAA).
- Critical: The use of CAA over iodoacetamide is essential to prevent artifactual di-carbamidomethylation of lysines, which can mimic diGly remnants [13].
- Immediately after adding buffer, scrape cells and transfer lysates to microfuge tubes. Boil samples at 95°C for 5-10 minutes to ensure efficient protein extraction and instant enzyme inactivation.
- Protein Quantification and Normalization: Clarify lysates by centrifugation (14,000 x g, 10 min). Determine protein concentration using a compatible assay (e.g., BCA assay). Normalize samples to a consistent protein concentration (e.g., 1-2 mg total protein is ideal for subsequent enrichment) using SDC lysis buffer.
Protein Digestion and Peptide Clean-up
- Protein Digestion: Dilute the normalized protein lysates with 100 mM Tris-HCl (pH 8.5) to reduce SDC concentration to ~0.5%. Digest proteins first with Lys-C (1:100 w/w, 2-4 hours at 25°C), followed by trypsin digestion (1:50 w/w, overnight at 25°C).
- Peptide Clean-up: Acidify digested peptides by adding Trifluoroacetic Acid (TFA) to a final concentration of 1-2%. SDC will precipitate out of solution. Centrifuge to remove precipitate. Desalt the acid-stable supernatant using C18 solid-phase extraction (SPE) cartridges or StageTips according to standard protocols. Dry peptides completely in a vacuum concentrator.
Immunoaffinity Enrichment of diGly-Containing Peptides
- Peptide Reconstitution: Reconstitute the dried peptide pellets in Immunoaffinity Purification (IAP) Buffer (50 mM MOPS-NaOH (pH 7.2), 10 mM Na₂HPO₄, 50 mM NaCl).
- Antibody-Bead Incubation: For each sample, use 31.25 µg of anti-K-ε-GG antibody (e.g., PTMScan Ubiquitin Remnant Motif Kit, Cell Signaling Technology). Pre-incubate the antibody with Protein A/G beads for at least 1 hour at 4°C to form the immunoaffinity matrix.
- Peptide Enrichment: Incubate the reconstituted peptides (from up to 2 mg protein input) with the antibody-bead complex for 2 hours at 4°C with gentle agitation.
- Washing and Elution: After incubation, pellet beads and carefully remove the supernatant. Wash beads stringently 3-4 times with 1 mL IAP buffer and twice with 1 mL HPLC-grade water. Elute bound diGly-peptides with 0.15% TFA (2 x 100 µL). Pool eluents and dry completely in a vacuum concentrator.
Liquid Chromatography and DIA-MS Acquisition
- Liquid Chromatography: Reconstitute enriched peptides in 2-3% Acetonitrile / 0.1% Formic Acid. Separate peptides using a nanoflow LC system with a C18 reversed-phase column (e.g., 75 µm x 25 cm, 1.6 µm bead size) over a 75-120 minute organic gradient (e.g., 5-30% acetonitrile in 0.1% formic acid).
- DIA-MS Method:
- MS1 Scan: Resolution: 120,000; Scan Range: 350-1100 m/z; AGC Target: 3e6; Maximum Injection Time: 50 ms.
- DIA MS2 Scans: Use variable window widths optimized for the diGly peptide precursor distribution [5].
- Number of windows: ~30-46.
- Window Placement: Optimized to cover 400-1000 m/z.
- Resolution: 30,000; AGC Target: 3e6; Maximum Injection Time: Auto; HCD Collision Energy: 25-30%.
- Cycle Time: Ensure the total cycle time for one MS1 and all MS2 scans is sufficiently fast (typically <3 seconds) to provide adequate data points across chromatographic peaks.
Data Processing and Analysis
- Spectral Library Generation:
- Option 1 (Library-Free): Use software like DIA-NN in "library-free" mode, which directly queries the DIA data against a protein sequence database (e.g., Swiss-Prot) augmented with the diGly modification (+114.04293 Da on Lysine) [13].
- Option 2 (Project-Specific Library): Generate a deep, project-specific spectral library by fractionating a representative pool of enriched diGly peptides (e.g., 96 fractions concatenated into 8-12) and acquiring data in DDA mode. Combine this with library-free data for a hybrid library [5].
- DIA Data Extraction: Process the raw DIA files using DIA-NN [13] or similar software (e.g., Spectronaut, Skyline) against the generated spectral library. Use recommended settings for ubiquitinomics, including cross-run normalization and robust signal extraction.
- Downstream Analysis: Perform statistical analysis on the output matrix to identify differentially regulated ubiquitination sites. Integrate with parallel global proteome data to distinguish changes in ubiquitination from changes in protein abundance [13].
Workflow Visualization and Data Processing Logic
The following diagram illustrates the optimized end-to-end workflow for DIA-based ubiquitinome analysis, highlighting critical steps that confer advantages over traditional DDA.
DIA Ubiquitinome Workflow: This diagram outlines the optimized sample preparation and data acquisition pipeline for deep ubiquitinome profiling.
The core data processing logic in DIA transforms complex, multiplexed spectra into a precise quantitative matrix, overcoming the missing value problem inherent to DDA.
DIA Data Processing Logic: The workflow demonstrates how software like DIA-NN uses a spectral library and deep learning to deconvolve complex DIA data into a high-fidelity, complete data matrix.
The Scientist's Toolkit: Essential Reagents and Software
Successful implementation of a DIA-based ubiquitinome workflow relies on specific, high-quality reagents and computational tools.
Table 3: Essential Research Reagent Solutions for DIA Ubiquitinomics
| Item Name | Function/Application | Critical Specifications | Example Product/Catalog |
|---|---|---|---|
| Anti-K-ε-GG Rabbit Mab | Immunoaffinity enrichment of ubiquitin-derived diGly peptides. | Specificity for K-ε-GG remnant; low non-specific binding. | PTMScan Ubiquitin Remnant Motif Kit (CST #5562) [5] [18] |
| Proteasome Inhibitor | Stabilizes ubiquitinated proteins by blocking proteasomal degradation. | High potency and specificity (e.g., MG-132, Bortezomib). | MG-132 (CST #1748) [13] |
| SDC Lysis Buffer Components | Efficient protein extraction with simultaneous cysteine alkylation. | Use of Chloroacetamide (CAA) over IAA to prevent artifacts. | Prepare in-lab [13] |
| High-Purity Trypsin/Lys-C | Specific protein digestion for mass spectrometry analysis. | Sequencing grade, MS-compatible. | Promega Trypsin/Lys-C Mix [13] |
| C18 Solid-Phase Extraction Tips | Desalting and cleanup of peptide digests prior to enrichment. | High recovery for low-abundance peptides. | Empore C18 StageTips [13] |
| DIA-NN Software | Processing of DIA data; deep learning-based quantification. | Specialized module for ubiquitinomics; library-free capability. | Open-source (GitHub) [13] |
| Orbitrap Astral Mass Spectrometer | High-speed, high-sensitivity DIA acquisition. | Enables deep proteome/ubiquitinome coverage in single shots. | Thermo Scientific Orbitrap Astral [17] |
Application in Drug Development: Mode-of-Action Studies
The robust quantification provided by DIA ubiquitinomics makes it exceptionally powerful for drug discovery, particularly for targeted protein degradation (TPD) and DUB inhibitor programs.
- Comprehensive Target Engagement Profiling: When profiling a DUB inhibitor (e.g., against USP7), DIA ubiquitinome analysis allows for the simultaneous recording of ubiquitination changes and consequent abundance changes for thousands of proteins at high temporal resolution [13]. This enables researchers to distinguish direct substrate ubiquitination from secondary effects and to dissect degradative from non-degradative ubiquitin signaling immediately following target engagement.
- Mechanism of Action for PROTACs/Molecular Glues: For TPD agents like PROTACs, the optimized DIA workflow can rapidly identify the ubiquitination sites on substrate proteins, helping to establish the mode of action and efficiency of degradation [19]. The high data completeness ensures that even low-abundance, critical substrates are reliably quantified across multiple treatment conditions and time points, providing a systems-level view of drug action.
- Biomarker Discovery and Validation: The reproducibility and depth of DIA facilitate the identification of specific ubiquitination signatures that can serve as pharmacodynamic biomarkers in preclinical models and clinical trials [14]. The ability to work with limited sample amounts while maintaining high coverage is crucial for translating these findings from in vitro models to patient-derived samples.
Data-independent acquisition (DIA) has revolutionized mass spectrometry-based proteomics by generating unbiased, high-accuracy, and reproducible data [20]. Unlike traditional data-dependent acquisition (DDA), which selectively chooses intense precursor ions for fragmentation, DIA systematically fragments all ions within predetermined, sequential isolation windows across the full mass range [21]. This fundamental difference in acquisition strategy mitigates stochastic sampling and missing values, enabling more comprehensive peptide capture and precise quantification—attributes particularly valuable for ubiquitinome analysis where capturing low-abundance, modified peptides is essential.
In DIA, the relationship between precursor and fragment ions is lost during acquisition, resulting in complex, multiplexed fragment ion spectra that require sophisticated computational deconvolution [21]. The reproducibility of DIA-MS has been firmly established in cross-laboratory studies, forming a crucial foundation for acquiring high-throughput proteome data from large-scale clinical sample cohorts [21]. This technical introduction establishes the framework for understanding how DIA principles can be leveraged for ubiquitinome research, where systematic fragmentation ensures more consistent detection of modified peptides across multiple samples.
Key Technological Aspects of DIA
Evolution of DIA Methodologies
DIA methodologies have evolved significantly from early conceptualizations to modern implementations. The foundational concept was introduced in 2003 with "shotgun collision-induced dissociation," involving one-shot CID of all peptides across the entire mass range [20]. This evolved into parallel acquisition approaches like MSE (Waters Corporation) and all-ion fragmentation (AIF) (Thermo Fisher), which utilized simultaneous low and high collision energy scans [20]. A pivotal advancement came with stepwise isolation fragmentation, exemplified by SWATH-MS (SCIEX), which systematically acquires tandem mass spectra across marginally overlapping precursor isolation windows (typically 25 m/z) [20]. Modern DIA implementations on Orbitrap and timsTOF instruments have further refined these approaches with narrower windows, higher resolution, and ion mobility separation, dramatically improving proteome coverage and quantitative precision [20].
Comparison of Data Acquisition Strategies
Table 1: Key Differences Between DDA and DIA Acquisition Methods
| Characteristic | Data-Dependent Acquisition (DDA) | Data-Independent Acquisition (DIA) |
|---|---|---|
| Fragmentation Strategy | Selects top N intense precursors | Fragments all precursors in sequential windows |
| Quantification Basis | MS1 peak areas or spectral counting | MS2 fragment ion intensities |
| Missing Values | Common due to stochastic sampling | Minimal due to systematic acquisition |
| Spectral Complexity | Low (isolated precursors) | High (multiplexed fragments) |
| Reproducibility | Moderate | High across samples and laboratories |
| Data Analysis | Direct database search | Requires spectral libraries or specialized algorithms |
DIA Data Analysis Strategies
Library-Based versus Library-Free Approaches
DIA data analysis employs two primary strategies for identifying and quantifying peptide precursors: library-based and library-free methods [21]. Library-based approaches utilize pre-constructed spectral libraries containing peptide fragment ion intensities and retention times, which can be generated from fractionated DDA data or predicted from precursor sequences [21]. These libraries serve as references for extracting and validating peptide signals from complex DIA data. In contrast, library-free approaches directly analyze DIA data against protein sequence databases or predicted spectral libraries without requiring experimental library construction [21]. Each method presents distinct advantages; library-free approaches offer greater flexibility when comprehensive spectral libraries are unavailable, while library-based methods typically provide more confident identifications when high-quality libraries exist [21].
Recent benchmarking studies indicate that library-free approaches outperform library-based methods when spectral libraries have limited comprehensiveness [21]. However, constructing a comprehensive project-specific library still offers benefits for most DIA analyses, particularly for complex applications like ubiquitinome research where modified peptides may be poorly represented in generic libraries [21]. Gas-phase fractionation (GPF)-based libraries, where a representative sample is repeatedly measured to cover distinct m/z ranges in greater detail, have demonstrated particularly strong performance in comparative studies [22].
DIA Analysis Software Tools
Multiple software tools have been developed to handle the computational challenges of DIA data analysis, each with unique algorithms for spectral matching, feature detection, and false discovery rate control [21] [20]. These tools have been optimized for different mass spectrometry platforms and offer varying capabilities for library-based and library-free analysis.
Table 2: Comparison of Major DIA Data Analysis Software Tools
| Software Tool | Analysis Modes | Optimal Instrument Platforms | Key Features |
|---|---|---|---|
| DIA-NN | Library-based, library-free | Orbitrap, timsTOF | Fast analysis, in-silico spectral libraries, high sensitivity [21] [22] |
| Spectronaut | Primarily library-based | Orbitrap, TripleTOF, timsTOF | Deep learning-based spectral prediction, high quantification precision [21] |
| Skyline | Library-based, library-free | Cross-platform | Open-source, extensive visualization, targeted analysis [21] |
| OpenSWATH | Library-based | TripleTOF, Orbitrap | Open-source, high reproducibility, PyProphet integration [21] [23] |
| EncyclopeDIA | Library-based, library-free | Orbitrap | Library-free search capabilities, DDA library compatibility [21] [22] |
Recent benchmarking studies utilizing large-scale datasets with inter-patient heterogeneity have demonstrated that all DIA software suites benefit from using gas-phase fractionated spectral libraries [22]. The choice of software significantly impacts downstream statistical analysis, including data sparsity patterns and the effectiveness of normalization methods, ultimately influencing the detection of differentially abundant proteins [22].
Experimental Protocols for DIA-Based Ubiquitinome Analysis
Sample Preparation for Ubiquitinome Analysis
Materials Required:
- Lysis buffer (e.g., RIPA buffer with protease and deubiquitinase inhibitors)
- Protein quantification assay (e.g., BCA assay)
- Digestion enzyme (trypsin/Lys-C mix)
- DiGly remnant antibody-conjugated beads for ubiquitinated peptide enrichment
- StageTips or C18 cartridges for desalting
- iRT calibration kit for retention time standardization
Protocol:
- Cell Lysis and Protein Extraction: Lyse cells or tissue in RIPA buffer (150 mM NaCl, 5 mM EDTA, 50 mM Tris pH 8, 1% IGEPAL CA-630, 0.5% sodium deoxycholate, 0.1% SDS) supplemented with protease inhibitors (including 10 mM N-ethylmaleimide to preserve ubiquitination) and deubiquitinase inhibitors [24]. Incubate on ice for 30 minutes with occasional vortexing, then centrifuge at 21,000 × g for 15 minutes at 4°C to remove insoluble material.
Protein Digestion: Quantify protein concentration using BCA assay. Digest 500 μg to 1 mg protein with trypsin/Lys-C mixture (1:25-1:50 enzyme-to-protein ratio) at 37°C for 12-16 hours [24]. Desalt resulting peptides using C18 StageTips or cartridges.
Ubiquitinated Peptide Enrichment: Reconstitute desalted peptides in immunoaffinity purification (IAP) buffer. Incubate with DiGly remnant antibody-conjugated beads for 2 hours at 4°C with gentle rotation. Wash beads sequentially with IAP buffer and water, then elute ubiquitinated peptides with 0.1% trifluoroacetic acid [24].
Sample Cleanup and Concentration: Desalt eluted peptides using C18 StageTips. Dry samples in a vacuum concentrator and reconstitute in 2% acetonitrile/0.1% formic acid for LC-MS/MS analysis.
DIA Liquid Chromatography and Mass Spectrometry Methods
Materials Required:
- Nanoflow liquid chromatography system
- C18 reverse-phase analytical column (25-50 cm)
- Mass spectrometer (Orbitrap, TripleTOF, or timsTOF platforms)
- iRT peptides for retention time calibration
LC-MS/MS Parameters:
- Chromatographic Separation: Use a 60-120 minute linear gradient from 2% to 30% acetonitrile in 0.1% formic acid at a flow rate of 300 nL/min. Maintain column temperature at 50°C for improved retention time reproducibility [22].
DIA Acquisition Method:
- Orbitrap Methods: Set MS1 resolution to 120,000, mass range 350-1200 m/z. For DIA, use 20-40 variable windows covering the 400-1000 m/z range, with MS2 resolution 30,000-45,000, normalized HCD collision energy 25-32% [21] [20].
- timsTOF Methods: Use parallel accumulation-serial fragmentation (PASEF) DIA methods with 100-200% ion mobility range, 0.6-1.6 Vs/cm², and 4-8 TIMS scans per window [21].
- TripleTOF Methods: Implement SWATH-MS with 32-64 variable windows, accumulation time 50-100 ms per window [21].
Quality Control: Include iRT peptides in each sample for retention time alignment. Run quality control samples (e.g., HeLa digest) periodically to monitor system performance.
Data Processing and Statistical Analysis Workflow
Software and Tools:
- DIA analysis software (DIA-NN, Spectronaut, or OpenSWATH)
- Statistical analysis package (MSstats or similar)
- Custom scripts for ubiquitin site localization and analysis
Processing Steps:
- Library Generation: Create a project-specific spectral library using gas-phase fractionation of a representative sample or refine a predicted library (from Prosit or DIA-NN's in-silico library) with experimental DIA data [22]. For ubiquitinome analysis, include synthetic ubiquitinated peptides when possible to improve identification.
DIA Data Processing: Process raw files using chosen DIA software with the following key parameters:
Statistical Analysis with MSstats:
- Convert DIA output to MSstats-compatible format
- Perform data normalization (global standard or quantile)
- Implement protein-wise linear models for differential analysis
- Control false discovery rates using Benjamini-Hochberg or permutation-based methods [23]
Ubiquitin-Specific Analysis: Filter results for DiGly-modified peptides. Apply site-level localization scoring to distinguish true ubiquitination sites from possible co-eluting unmodified peptides. Integrate with functional annotations (pathway analysis, protein interaction networks) for biological interpretation.
Research Reagent Solutions for DIA Ubiquitinome Analysis
Table 3: Essential Research Reagents for DIA Ubiquitinome Studies
| Reagent/Material | Function | Application Notes |
|---|---|---|
| DiGly Remnant Antibody | Immunoaffinity enrichment of ubiquitinated peptides | Critical for ubiquitinome depth; clone-specific performance varies |
| Protease Inhibitor Cocktails | Prevent protein degradation during sample preparation | Must include deubiquitinase inhibitors (N-ethylmaleimide, PR-619) |
| iRT Kit | Retention time calibration standard | Enables cross-run alignment and improves quantification accuracy |
| Trypsin/Lys-C Mix | Protein digestion | Provides specific cleavage at Lys and Arg residues, generating K-ε-GG remnants |
| C18 StageTips | Peptide desalting and concentration | Essential for sample cleanup before LC-MS/MS |
| UHPLC Columns | Peptide separation | 25-50 cm columns with 1.5-2μm C18 particles for optimal resolution |
| Reference Spectral Libraries | Peptide identification in DIA analysis | Project-specific GPF libraries recommended over generic libraries |
Visualizing DIA Principles and Ubiquitinome Applications
Core DIA Principle: Systematic Fragmentation
DIA Ubiquitinome Analysis Workflow
The systematic fragmentation approach of DIA mass spectrometry provides a powerful foundation for comprehensive ubiquitinome analysis. By fragmenting all peptides within sequential isolation windows regardless of intensity, DIA ensures consistent detection of low-abundance ubiquitinated peptides across multiple samples—a critical advantage for capturing dynamic ubiquitination events. The combination of optimized sample preparation protocols, advanced DIA acquisition methods, and sophisticated computational tools enables robust identification and quantification of ubiquitination sites. As DIA technologies continue evolving with faster acquisition speeds, improved sensitivity, and enhanced computational pipelines, they will further advance our understanding of the ubiquitin code in health and disease.
Optimized DIA-Ubiquitinome Workflows: From Bench to Biomarker Discovery
In mass spectrometry-based ubiquitinome analysis, sample preparation is a critical determinant of data quality and depth. The ubiquitin-proteasome system (UPS) regulates virtually all cellular processes, and its dysregulation is implicated in carcinogenesis and other diseases [13]. Profiling ubiquitination on a proteome-wide scale presents unique challenges due to the low stoichiometry of the modification and the labile nature of the ubiquitin signal. Data-independent acquisition (DIA) mass spectrometry has emerged as a powerful tool for ubiquitinomics, offering superior quantitative accuracy, reproducibility, and data completeness compared to traditional data-dependent acquisition (DDA) [13] [5] [14]. However, the full potential of DIA can only be realized through optimized sample preparation protocols that maximize ubiquitin remnant peptide recovery while minimizing artifacts. This application note details two critical steps—sodium deoxycholate (SDC)-based lysis and chloroacetamide (CAA) alkylation—that significantly enhance the depth and precision of in vivo ubiquitinome profiling when integrated with DIA-MS workflows.
Key Methodological Advantages of SDC and CAA
SDC-Based Lysis for Enhanced Ubiquitinome Coverage
Traditional urea-based lysis buffers have been widely used in proteomic sample preparation, but they present limitations for ubiquitinomics. Recent systematic comparisons demonstrate that SDC-based protein extraction significantly improves ubiquitin remnant peptide identification. When coupled with immediate sample boiling, SDC lysis enhances protein solubilization and protease inactivation, leading to a marked increase in K-ε-GG peptide recovery.
Table 1: Quantitative Comparison of Lysis Buffer Performance in Ubiquitinomics
| Parameter | SDC-Based Lysis | Urea-Based Lysis | Improvement |
|---|---|---|---|
| Average K-GG Peptides Identified | 26,756 | 19,403 | +38% [13] |
| Enrichment Specificity | Maintained high | Comparable | No negative effect [13] |
| Reproducibility (CV <20%) | Significantly increased | Lower | Improved precision [13] |
| Protein Input Requirement | 2 mg for ~30,000 IDs | Higher input typically needed | 20x less than fractionation-based methods [13] |
Chloroacetamide Alkylation to Prevent Artifacts
The choice of alkylating reagent is particularly crucial in ubiquitinome studies due to the potential for artifactual modifications that can mimic the diglycine remnant. Iodoacetamide (IAA), a common alkylation reagent, has been reported to cause di-carbamidomethylation of lysine residues. This modification adds a mass shift of 114.0249 Da, identical to the K-GG remnant, potentially leading to false identifications [13]. Chloroacetamide (CAA) effectively alkylates cysteine residues without inducing unspecific di-carbamidomethylation of lysines, even when incubated at high temperatures [13]. Furthermore, systematic evaluations of reduction and alkylation reagents have demonstrated that iodine-containing alkylation reagents like IAA can alkylate methionine residues, leading to prominent neutral losses during ESI ionization or MS/MS fragmentation that strongly decrease identification rates of methionine-containing peptides [25]. CAA circumvents these issues, making it particularly suitable for ubiquitinome studies.
Integrated Protocol for SDC-Based Lysis and CAA Alkylation
Cell Lysis and Protein Extraction
Reagents Needed:
- SDC Lysis Buffer: 1% sodium deoxycholate, 100 mM Tris-HCl (pH 8.5)
- 500 mM chloroacetamide (CAA) stock solution in water
- Protease inhibitors (without EDTA)
- Deubiquitinase (DUB) inhibitors (e.g., PR-619, N-ethylmaleimide)
- Phosphatase inhibitors (if phosphorylated ubiquitin chains are of interest)
- Benzonase (optional, for DNA digestion)
Procedure:
- Prepare fresh SDC lysis buffer supplemented with 10-20 mM CAA from the 500 mM stock.
- Add protease, DUB, and phosphatase inhibitors immediately before use.
- For cell cultures: Aspirate media and wash cells once with ice-cold PBS.
- Add appropriate volume of SDC lysis buffer directly to cells (e.g., 100-200 µL per 10⁶ cells).
- Immediately scrape cells and transfer the lysate to a pre-heated (95°C) thermomixer.
- Incubate at 95°C for 5-10 minutes with vigorous shaking (1000 rpm) to fully denature proteins and inactivate endogenous enzymes.
- Sonicate samples on ice (3-5 cycles of 15 seconds on, 30 seconds off) to reduce viscosity and ensure complete lysis.
- Centrifuge at 16,000 × g for 10 minutes at room temperature to remove insoluble material.
- Transfer the clear supernatant to a new tube and proceed to protein quantification.
Protein Reduction and Alkylation
Reagents Needed:
- 1 M dithiothreitol (DTT) or 500 mM tris(2-carboxyethyl)phosphine (TCEP)
- 500 mM chloroacetamide (CAA) stock solution
- SDC lysis buffer
Procedure:
- Determine protein concentration using a compatible assay (e.g., BCA or Lowry).
- Reduce disulfide bonds by adding DTT to 5-10 mM final concentration (or TCEP to 5 mM).
- Incubate at 45°C for 30 minutes with gentle shaking (500 rpm).
- Alkylate by adding CAA to 20-40 mM final concentration.
- Incubate in the dark at room temperature for 30 minutes.
- Quench excess alkylating reagent by adding additional DTT to 10-20 mM final concentration.
- Process samples immediately for digestion or store at -80°C.
Downstream Processing for DIA-Ubiquitinomics
Protein Digestion and DiGly Peptide Enrichment
Following reduction and alkylation, proteins are digested using trypsin, which cleaves C-terminal to arginine and lysine residues, generating peptides with a diglycine remnant on previously ubiquitinated lysines. The resulting K-ε-GG peptides are then enriched using specific antibodies before DIA-MS analysis [13] [5]. Optimization experiments indicate that enrichment from 1 mg of peptide material using 31.25 µg of anti-diGly antibody provides an optimal balance between yield and coverage [5]. Only 25% of the total enriched material typically needs to be injected for DIA analysis when using optimized workflows [5].
DIA-MS Analysis and Data Processing
For DIA ubiquitinomics, specialized data processing tools like DIA-NN have been developed with scoring modules specifically optimized for the confident identification of modified peptides, including K-GG peptides [13]. The implementation of deep neural network-based processing significantly increases proteomic depth and quantitative accuracy for DIA, particularly for complex ubiquitinome samples [13].
Table 2: Performance Comparison of MS Acquisition Methods for Ubiquitinomics
| Performance Metric | DDA with MBR | DIA with DIA-NN | Improvement |
|---|---|---|---|
| K-GG Peptides per Single Run | 21,434 | 68,429 | >3x increase [13] |
| Median Quantitative CV | ~20% or higher | ~10% | ~2x improvement [13] |
| Data Completeness | ~50% without missing values | 68,057 peptides in ≥3 replicates | Major enhancement [13] |
| Coverage of DDA Identifications | Reference | 88% captured | Nearly comprehensive [13] |
Research Reagent Solutions
Table 3: Essential Materials for SDC-Based Ubiquitinomics Workflow
| Reagent/Category | Specific Examples | Function in Workflow |
|---|---|---|
| Lysis Detergent | Sodium Deoxycholate (SDC) | Efficient protein solubilization, compatible with MS, improves peptide recovery |
| Alkylation Reagent | Chloroacetamide (CAA) | Cysteine alkylation without lysine di-carbamidomethylation artifacts |
| Reducing Agents | DTT, TCEP, β-mercaptoethanol | Break disulfide bonds, with performance varying by application [25] |
| Enrichment Antibody | PTMScan Ubiquitin Remnant Motif (K-ε-GG) Kit | Immunoaffinity purification of diglycine-modified peptides |
| Protease Inhibitors | Complete/EDTA-free, PR-619, NEM | Prevent protein degradation and preserve ubiquitin signals |
| Digestion Enzyme | Sequencing-grade trypsin | Generates K-ε-GG remnant peptides from ubiquitinated proteins |
| MS Acquisition Mode | DIA with optimized windows | Unbiased fragmentation of all ions, superior quantification [13] [5] |
| Data Processing Software | DIA-NN, Spectronaut, FragPipe | Specialized analysis of DIA ubiquitinomics data [13] [26] |
Workflow Visualization
Diagram 1: Integrated workflow for SDC-based lysis and CAA alkylation in DIA-ubiquitinomics.
The integration of SDC-based lysis and chloroacetamide alkylation represents a significant advancement in sample preparation for DIA-based ubiquitinome analysis. This optimized workflow addresses key limitations of traditional methods by enhancing ubiquitin remnant peptide recovery by 38%, eliminating artifact formation that mimics K-GG modifications, and improving quantitative precision. When coupled with DIA-MS acquisition and neural network-based data processing, researchers can achieve unprecedented depth—quantifying over 70,000 ubiquitinated peptides in single MS runs—while maintaining high reproducibility and quantitative accuracy. This robust and scalable workflow enables rapid mode-of-action profiling for drug candidates targeting DUBs or ubiquitin ligases, facilitating drug development in oncology and other disease areas involving ubiquitin signaling pathways.
Within the framework of data-independent acquisition (DIA) for ubiquitinome analysis, the precise enrichment of target peptides is a critical first step that determines the overall success and depth of the investigation. Ubiquitination, a pivotal post-translational modification (PTM), is typically studied by mass spectrometry (MS) through the detection of a characteristic diGly (K-ε-GG) remnant left on substrate lysines after tryptic digestion [9] [11] [27]. However, the low stoichiometry of ubiquitination and the high dynamic range of the cellular proteome present a significant challenge, necessitating highly specific and efficient enrichment methods prior to DIA-MS.
This Application Note details a robust protocol for the high-stringency, antibody-based purification of diGly peptides. This methodology is engineered to be fully compatible with subsequent DIA analysis, a technique renowned for its superior quantitative accuracy, reproducibility, and data completeness compared to traditional data-dependent acquisition (DDA) [9] [28]. By enabling the sensitive and large-scale identification of ubiquitination sites—over 35,000 distinct diGly peptides in a single measurement—this workflow provides a powerful tool for exploring ubiquitin signaling in biological systems, from targeted protein degradation (TPD) to circadian regulation [9] [19].
Background & Principle
The principle of diGly antibody-based enrichment capitalizes on a unique proteomic signature. During standard proteomic sample preparation, proteins are digested with the protease trypsin. When a ubiquitinated protein is digested, the C-terminal glycine of ubiquitin remains covalently attached to the modified lysine residue on the substrate peptide, generating a tryptic peptide with a diGly (K-ε-GG) modification [11] [27].
A highly specific antibody has been developed that recognizes this diGly remnant motif with high affinity. This allows for the immunoaffinity purification (IP) of these modified peptides from the complex background of unmodified peptides [9] [27]. It is crucial to note that this antibody also enriches for identical remnants generated by ubiquitin-like modifiers such as NEDD8 and ISG15. However, studies indicate that the vast majority (>95%) of enriched diGly peptides originate from ubiquitination [27].
When coupled with DIA mass spectrometry, this enrichment strategy forms a formidable workflow. DIA overcomes the stochasticity and under-sampling limitations of DDA by systematically fragmenting all ions within pre-defined isolation windows, leading to more comprehensive and reproducible data acquisition [9] [28]. The high-stringency enrichment protocol described herein ensures that the input for the DIA-MS system is of the highest quality, maximizing the return from this advanced acquisition technique.
Key Reagents and Equipment
The following table catalogues the essential research reagent solutions and equipment required for the successful execution of the high-stringency diGly peptide enrichment protocol.
Table 1: Essential Research Reagent Solutions for DiGly Peptide Enrichment
| Item | Function/Description | Key Considerations |
|---|---|---|
| diGly Motif Antibody ( [9] [27]) | Immunoaffinity enrichment of diGly-modified peptides; Core of the protocol. | Commercial kits are available (e.g., PTMScan Ubiquitin Remnant Motif Kit). |
| Cell/Tissue Lysis Buffer ( [27]) | Protein extraction and denaturation while preserving the modification. | 8M Urea, 50mM Tris-HCl, pH 8.0. Must include protease and deubiquitinase (DUB) inhibitors. |
| Deubiquitinase (DUB) Inhibitor ( [27]) | Prevents the cleavage of ubiquitin from substrates during lysis, preserving the native ubiquitinome. | N-Ethylmaleimide (NEM) or Iodoacetamide, added fresh. |
| Proteases: LysC & Trypsin ( [27]) | Sequential digestion of proteins to generate peptides. LysC improves digestion efficiency in urea. | Sequencing grade, MS-compatible enzymes are required. |
| Solid-Phase Extraction Cartridge ( [27]) | Desalting and cleanup of peptides prior to enrichment. | Reverse-phase C18 material (e.g., Sep-Pak tC18). |
| Chromatography System ( [9]) | Nano-flow liquid chromatography system for peptide separation. | Coupled online to the mass spectrometer. |
| High-Resolution Mass Spectrometer ( [9] [28]) | DIA acquisition of enriched diGly peptides. | Orbitrap or Q-TOF mass analyzers are suitable. |
Method & Protocol
Sample Preparation and Protein Digestion
- Cell Lysis: Harvest cells or tissue and lyse in a pre-chilled, strong denaturing lysis buffer (e.g., 8M Urea, 50mM Tris-HCl, pH 8.0) supplemented with comprehensive protease inhibitors and, critically, 5mM N-Ethylmaleimide (NEM) to inhibit deubiquitinating enzymes (DUBs) [27].
- Protein Quantification and Reduction/Alkylation: Determine protein concentration using a compatible assay (e.g., BCA). Reduce disulfide bonds with 5mM dithiothreitol (DTT) at 25°C for 30 minutes, then alkylate with 10mM iodoacetamide (IAA) at 25°C for 30 minutes in the dark.
- Sequential Protein Digestion:
- LysC Digestion: Dilute the urea concentration to ~2M. Add LysC protease at a 1:100 (w/w) enzyme-to-protein ratio and incubate for 2-4 hours at 25°C [27].
- Trypsin Digestion: Further dilute the sample to <1.5M urea. Add trypsin at a 1:100 (w/w) ratio and incubate overnight (~12-16 hours) at 25°C.
- Peptide Desalting: Acidify the digested peptide mixture with trifluoroacetic acid (TFA) to a final concentration of 0.5-1%. Desalt the peptides using a reverse-phase C18 solid-phase extraction cartridge (e.g., Sep-Pak), eluting with 30-50% acetonitrile. Lyophilize the eluate to dryness [27].
High-Stringency DiGly Peptide Enrichment
- Peptide Reconstitution: Reconstitute the dried peptide pellet in 1 mL of Immunoaffinity Purification (IAP) Buffer (50mM MOPS-NaOH, pH 7.2, 10mM Na2HPO4, 50mM NaCl).
- Antibody Incubation: Add the appropriate amount of anti-diGly antibody (e.g., ~30 µg per 1-2 mg of total peptide input) to the peptide solution [9]. Incubate the mixture with gentle rotation for 2 hours at 4°C.
- Antibody Capture: Add protein A or protein G agarose/bead slurry to the peptide-antibody mixture and incubate for an additional 1-2 hours at 4°C to capture the antibody-diGly peptide complexes.
- Washing: Pellet the beads and carefully remove the supernatant. Wash the beads 3-4 times with 1 mL of ice-cold IAP buffer, followed by 2-3 washes with 1 mL of ice-cold HPLC-grade water to remove non-specifically bound peptides.
- Peptide Elution: Elute the bound diGly peptides from the beads by adding two aliquots of 50 µL of 0.15% trifluoroacetic acid (TFA). Combine the eluates.
Post-Enrichment Cleanup and DIA-MS Analysis
- Stage Tip Cleanup: Desalt the enriched diGly peptides using C18 Stage Tips to remove salts and residual TFA, eluting in a small volume of LC-MS loading solvent [9].
- DIA-MS Acquisition: Analyze the enriched peptides by nano-LC coupled to a high-resolution mass spectrometer operated in DIA mode. The optimized DIA method should utilize narrow, variable-width windows and high MS2 resolution (e.g., 30,000) for maximal identification of diGly peptides [9].
Expected Results & Data Analysis
The optimized workflow combining high-stringency diGly enrichment with DIA-MS consistently enables the identification of a remarkable number of ubiquitination sites. As demonstrated in foundational studies, this approach allows for the identification of over 35,000 distinct diGly peptides from a single measurement of proteasome inhibitor-treated cells, effectively doubling the number of identifications achievable with DDA methods [9]. Applied to targeted protein degradation models, similar workflows have identified over 40,000 diGly precursors corresponding to more than 7,000 proteins in a single run [19].
The quantitative data generated by DIA is highly reproducible. Typically, 77% of identified diGly peptides can show coefficients of variation (CVs) below 50% across technical and biological replicates, with a significant proportion (45%) exhibiting CVs below 20% [9]. This high quantitative accuracy is essential for detecting subtle but biologically significant changes in the ubiquitinome.
Table 2: Typical Performance Metrics of DIA-based Ubiquitinome Analysis
| Performance Metric | DDA-based Method | DIA-based Method (This Protocol) |
|---|---|---|
| DiGly Peptides (Single Shot) | ~17,500 | ~35,000 |
| Quantitative Accuracy (CV < 20%) | Lower | ~45% of peptides |
| Data Completeness | Moderate, more missing values | High, fewer missing values |
| Required Peptide Input | Higher | 25% of total enriched material |
Application Notes
- Input Optimization: For endogenous ubiquitination levels (without proteasome inhibition), an input of 1 mg of total peptides enriched with ~30 µg of antibody has been determined to be optimal for depth of coverage while maintaining efficiency [9].
- Specificity Consideration: Researchers should be aware that the diGly antibody also enriches peptides modified by the ubiquitin-like proteins NEDD8 and ISG15. For studies requiring absolute specificity, complementary validation experiments are recommended [27].
- Pathway Analysis: The power of this workflow is its application to biological questions. It has been successfully used to uncover novel ubiquitination events in TNFα signaling and to identify hundreds of cycling ubiquitination sites across the circadian cycle, revealing new regulatory mechanisms [9] [29].
- Troubleshooting: Low yields can result from insufficient peptide input or antibody amount, or from incomplete inhibition of DUBs during lysis. High background can be mitigated by ensuring stringent wash conditions and using high-purity reagents.
Data-independent acquisition (DIA) mass spectrometry has revolutionized the field of ubiquitinomics by providing unparalleled data completeness, quantitative accuracy, and reproducibility compared to traditional data-dependent acquisition (DDA) methods. Ubiquitination, a crucial post-translational modification (PTM), regulates virtually all cellular processes through the covalent attachment of ubiquitin to substrate proteins. The ubiquitin-proteasome system (UPS) mediates approximately 80%-85% of protein degradation in eukaryotic organisms and plays critical roles in cell cycle control, apoptosis, transcription regulation, and DNA damage repair [30] [31]. Dysregulation of ubiquitination pathways is implicated in numerous diseases, including cancer and neurodegenerative disorders, making comprehensive ubiquitinome profiling an essential tool for understanding disease mechanisms and identifying therapeutic targets [5] [32].
Mass spectrometry-based ubiquitinomics typically relies on immunoaffinity purification and MS-based detection of diglycine-modified peptides (K-ε-GG), generated by tryptic digestion of ubiquitin-modified proteins [30] [5]. While early studies employed DDA methods, this approach often suffered from missing values across samples and limited dynamic range. DIA overcomes these limitations by systematically fragmenting all peptides within predefined mass-to-charge (m/z) windows, enabling unbiased acquisition of proteomic data with significantly enhanced quantitative precision [14] [5]. This technical advance is particularly valuable for ubiquitinome analysis due to the low stoichiometry of ubiquitination and the diverse ubiquitin-chain topologies that encode specific biological functions [30].
Optimized DIA Acquisition Parameters for Ubiquitinated Peptides
Mass Spectrometry Instrument Settings
Ubiquitinated peptides exhibit unique characteristics that necessitate specialized DIA acquisition parameters. The impeded C-terminal cleavage of modified lysine residues frequently generates longer peptides with higher charge states, resulting in diGly precursors with distinct properties compared to unmodified peptides [5]. Through systematic optimization experiments, researchers have identified specific instrument settings that maximize ubiquitinome coverage and quantitative accuracy.
Table 1: Optimized DIA Acquisition Parameters for Ubiquitinome Analysis
| Parameter | Optimal Setting | Alternative Setting | Instrument Platform | Effect on Performance |
|---|---|---|---|---|
| MS2 Resolution | 30,000 | 45,000-60,000 | Orbitrap | 13% improvement in diGly peptide identifications [5] |
| Number of Windows | 46 | 32-64 | Orbitrap | Balances cycle time and peak sampling [5] |
| Isolation Window | 8-12 Th | 12-16 Th | Orbitrap | Compromise between precursor multiplexing and spectrum complexity [5] [33] |
| Mass Accuracy (MS1) | 10-15 ppm | 4.0 ppm (Orbitrap Astral) | timsTOF/Orbitrap | Guidance for m/z matching; instrument-dependent optimization [34] |
| Mass Accuracy (MS/MS) | 15-20 ppm | 10.0 ppm (Orbitrap Astral) | timsTOF/Orbitrap | Affects fragment ion matching precision [34] |
| Scan Window | ~20-30 | Instrument-specific | All | Approximate DIA cycles during average peptide elution [34] |
The optimization of DIA window schemes is particularly critical for ubiquitinome analysis. Research demonstrates that a method with relatively high MS2 resolution of 30,000 and 46 precursor isolation windows provides significantly improved performance (13% improvement compared to standard full proteome methods) [5]. The mass accuracy settings should be optimized based on the specific instrument platform: timsTOF instruments typically perform best with both MS1 and MS/MS mass tolerances set to 15.0 ppm, while Orbitrap Astral systems achieve optimal performance with MS1 accuracy at 4.0 ppm and MS/MS accuracy at 10.0 ppm [34].
The isolation window width represents a critical compromise in DIA ubiquitinome analysis. While wider windows (e.g., 8-12 Th) enable co-isolation and co-fragmentation of multiple precursors, excessively wide windows (beyond 12 Th) can generate overly complex MS2 spectra that impede confident identification [5] [33]. This "wide window acquisition" approach serves as a hybrid between traditional DDA and DIA, with a specific precursor being isolated for fragmentation while wide isolation windows allow for co-fragmentation and analysis of untargeted neighboring precursors [33].
LC Separation and Gradient Optimization
Chromatographic separation parameters significantly impact the depth of ubiquitinome coverage in DIA analyses. Several studies have successfully utilized medium-length nanoLC gradients (75-90 minutes) for deep ubiquitinome profiling [30] [5]. However, recent advances in ultra-low-flow chromatography have enabled substantial reductions in analysis time while maintaining impressive proteome coverage.
For ubiquitinated peptide separation, a PepSep C18 column (15 cm × 150 μm, 1.5 μm) with LC gradients ranging from 3% to 35% acetonitrile has been successfully employed [35]. When operated at ultra-low flow rates of approximately 15 nL/min, this chromatographic setup can achieve identification of >3,000 protein groups from single-cell-sized samples (0.2 ng aliquots) using a 40-minute active gradient [33]. Reducing the active gradient to 20 minutes results in only a modest 10% decrease in proteome coverage, highlighting the potential for higher-throughput ubiquitinome analyses without catastrophic losses in depth [33].
Experimental Protocols for DIA-Based Ubiquitinome Analysis
Sample Preparation and Lysis Optimization
Proper sample preparation is fundamental to successful ubiquitinome profiling. Recent methodological advances have identified optimal lysis and digestion conditions that maximize ubiquitin site coverage while maintaining reproducibility.
Protocol: SDC-Based Lysis for Ubiquitinomics
Lysis Buffer Preparation: Prepare SDC lysis buffer containing 5% sodium deoxycholate, 50 mM Tris-HCl (pH 8.5), and 10 mM chloroacetamide (CAA). The use of CAA instead of iodoacetamide is critical, as iodoacetamide can cause di-carbamidomethylation of lysine residues that mimic ubiquitin remnant K-ε-GG peptides in terms of mass tag added (both 114.0249 Da) [30].
Cell Lysis: Add SDC lysis buffer to cell pellets or tissue samples. Immediate boiling of samples after lysis is recommended to rapidly inactivate cysteine ubiquitin proteases [30].
Protein Digestion: Digest proteins using Lys-C (Wako Chemicals) at a 1 mAU:50 μg enzyme-to-substrate ratio, followed by sequencing-grade modified trypsin (Promega) at a 1:50 enzyme-to-substrate ratio [35].
Peptide Cleanup: Desalt digested peptides using a 100 mg Sep-Pak C18 SPE plate (Waters) [35].
Comparative studies demonstrate that SDC-based lysis yields approximately 38% more K-ε-GG peptides than conventional urea buffer (26,756 vs 19,403, n = 4 workflow replicates), without negatively affecting relative enrichment specificity [30]. This protocol also increases both the number of precisely quantified K-ε-GG peptides and overall reproducibility.
Ubiquitinated Peptide Enrichment
Protocol: Anti-K-ε-GG Antibody-Based Enrichment
Peptide Input: Use 1-2 mg of peptide material as starting input for enrichment. Titration experiments have demonstrated that enrichment from 1 mg of peptide material using 1/8th of an anti-diGly antibody vial (31.25 μg) provides optimal results [5].
Enrichment Specificity: To address interference from highly abundant K48-linked ubiquitin-chain derived diGly peptides, consider separating fractions containing these peptides and processing them separately. This reduces competition for antibody binding sites during enrichment and improves detection of co-eluting peptides [5].
Automated Enrichment: For large-scale studies, automated platforms like AUTO-SP can be employed for reproducible ubiquitinated peptide enrichment. This platform utilizes antibody-based magnetic beads from the PTMScan HS Ubiquitin/SUMO remnant motif (K-ε-GG) kit (Cell Signaling Technology) [35].
Using this optimized enrichment protocol, researchers have identified >14,000 ubiquitinated peptides from patient-derived xenograft (PDX) breast cancer tumor tissues, demonstrating the method's applicability to complex biological samples [35].
Data Processing and Analysis
Protocol: DIA-NN Processing for Ubiquitinomics Data
Spectral Library Generation:
- Click "Add FASTA" to add sequence databases in UniProt format
- Check "FASTA digest" checkbox (the "Deep learning" checkbox will activate automatically)
- For ubiquitinome analysis, enable the "PTM" mode and specify "GlyGly (K)" as the variable modification [34]
DIA Data Analysis:
- Select the appropriate spectral library (.predicted.speclib file for predicted libraries or .parquet for empirical libraries)
- Add the same FASTA databases used for library generation
- Select raw data files for analysis
- Set mass accuracy parameters according to instrument platform (see Table 1)
- For timsTOF data, set both MS1 and MS/MS mass accuracy to 15.0 ppm [34]
Quantification Settings:
DIA-NN incorporates a specialized scoring module that ensures confident identification of modified peptides, including K-ε-GG peptides, and has been shown to identify approximately 40% more K-ε-GG peptides compared to alternative DIA processing software [30]. The software can operate in "library-free" mode, searching directly against sequence databases without experimentally-generated spectral libraries, or utilize comprehensive spectral libraries generated through high-pH reversed-phase fractionation.
Visualization of DIA Ubiquitinomics Workflow
Figure 1: Comprehensive DIA Ubiquitinomics Workflow. This integrated protocol encompasses sample preparation through bioinformatics analysis, highlighting critical optimization points for deep ubiquitinome profiling.
Research Reagent Solutions for DIA Ubiquitinomics
Table 2: Essential Research Reagents for DIA Ubiquitinome Analysis
| Reagent/Kit | Manufacturer | Function in Protocol | Key Features |
|---|---|---|---|
| PTMScan HS Ubiquitin/SUMO Remnant Motif (K-ε-GG) Kit | Cell Signaling Technology | Immunoaffinity enrichment of ubiquitinated peptides | High-specificity antibody; magnetic bead format for automation compatibility [35] |
| OtUBD Affinity Resin | Laboratory-prepared [32] | Alternative enrichment using ubiquitin-binding domain | Enriches both mono- and polyubiquitinated proteins; works with native or denaturing conditions [32] |
| SulfoLink Coupling Resin | Thermo Scientific | OtUBD immobilization for affinity purification | Thiol-reactive resin for covalent attachment [32] |
| Sequencing-Grade Modified Trypsin | Promega | Protein digestion | High specificity; minimal autolysis [35] |
| Lys-C Protease | Wako Chemicals | Protein digestion for ubiquitinome analysis | Complementary cleavage specificity to trypsin [35] |
| DIA-NN Software | GitHub/Aptila Biotech | DIA data processing | Neural network-based analysis; optimized for ubiquitinomics [30] [34] |
| Spectronaut Software | Biognosys | Alternative DIA data processing | DirectDIA approach for library-free analysis [35] |
The selection of appropriate reagents is critical for successful DIA ubiquitinome analysis. The PTMScan HS Ubiquitin/SUMO Remnant Motif Kit provides high-specificity enrichment of ubiquitinated peptides and is compatible with automated platforms like AUTO-SP [35]. As an alternative to antibody-based enrichment, the OtUBD affinity resin offers a versatile and economical approach that effectively enriches both mono- and polyubiquitinated proteins, addressing a limitation of tandem ubiquitin-binding entities (TUBEs) which work poorly against monoubiquitinated proteins [32].
For data processing, DIA-NN has demonstrated particular effectiveness for ubiquitinome applications, with specialized scoring algorithms for modified peptides and the ability to operate in library-free mode, which is valuable for discovery applications where comprehensive spectral libraries may not be available [30] [34].
Applications and Biological Insights
The optimized DIA ubiquitinomics workflow has enabled significant biological discoveries across diverse research areas. When applied to the investigation of deubiquitinase (DUB) substrates, this approach has facilitated rapid mode-of-action profiling of candidate drugs targeting DUBs or ubiquitin ligases at high precision and throughput [30]. For example, upon inhibition of the oncology target USP7, researchers simultaneously recorded ubiquitination and consequent changes in abundance of more than 8,000 proteins at high temporal resolution. This analysis revealed that while ubiquitination of hundreds of proteins increases within minutes of USP7 inhibition, only a small fraction of those are subsequently degraded, thereby precisely dissecting the scope of USP7 action [30].
In circadian biology studies, DIA-based ubiquitinome analysis uncovered hundreds of cycling ubiquitination sites and dozens of cycling ubiquitin clusters within individual membrane protein receptors and transporters, highlighting previously unappreciated connections between metabolism and circadian regulation [5]. The comprehensive coverage afforded by optimized DIA methods nearly doubled the number of ubiquitination sites identified in single measurements compared to DDA approaches (35,000 vs 20,000 diGly peptides), enabling detection of these dynamic regulatory patterns [5].
The integration of proximity labeling with ubiquitinome profiling has further enhanced the specificity of DUB substrate identification. By combining APEX2-based proximity labeling with K-ε-GG ubiquitin remnant enrichment, researchers have developed a proximal-ubiquitome workflow that facilitates identification of substrates within the native microenvironment of specific DUBs, such as USP30 [36]. This approach successfully recovered known substrates (TOMM20, FKBP8) and identified novel candidates (LETM1), providing a robust framework for mapping DUB-substrate relationships with spatial resolution [36].
Optimized DIA acquisition methods represent a transformative advancement for ubiquitinome research, enabling unprecedented depth, precision, and throughput in the analysis of ubiquitination dynamics. The specialized window schemes and scan settings detailed in this protocol, particularly the use of 8-12 Th isolation windows with MS2 resolution of 30,000, have demonstrated remarkable improvements in ubiquitinated peptide identifications, more than tripling coverage compared to conventional DDA methods [30]. When integrated with robust sample preparation methods such as SDC-based lysis and anti-K-ε-GG antibody enrichment, these acquisition parameters facilitate comprehensive mapping of ubiquitination events across diverse biological systems.
The implementation of these optimized DIA ubiquitinomics workflows is advancing our understanding of ubiquitin signaling in fundamental cellular processes and disease mechanisms. As mass spectrometry technology continues to evolve with improvements in sensitivity, resolution, and acquisition speed, the depth and scope of ubiquitinome analyses will further expand. The protocols and parameters outlined here provide a foundation for researchers to implement these powerful methods in their investigation of the ubiquitin code and its functional consequences in biology and disease.
Data-independent acquisition mass spectrometry (DIA-MS) has revolutionized proteomic analysis by providing comprehensive, reproducible, and quantitative data. For the specific analysis of ubiquitinated proteins (ubiquitinome), DIA-MS coupled with advanced computational tools has enabled unprecedented depth and precision. The DIA-NN software suite represents a transformative advancement in this field, leveraging deep neural networks and innovative interference correction strategies to process highly complex DIA proteomics data [37] [38]. This integrated platform specifically addresses key challenges in ubiquitinomics, including low stoichiometry of ubiquitination, varying ubiquitin-chain topologies, and signal interference from co-eluting peptides [13] [5].
Within the broader context of DIA for ubiquitinome research, DIA-NN provides crucial computational infrastructure that enables researchers to move beyond traditional data-dependent acquisition (DDA) limitations. By employing a fully automated pipeline that includes intuitive graphical and command-line interfaces, DIA-NN eliminates the lengthy optimization processes typically required for DIA data processing [34] [38]. Its specialized algorithms, including an additional scoring module for confident identification of modified peptides such as K-ε-GG remnant peptides, make it particularly valuable for ubiquitinome studies where precise identification and quantification are paramount [13].
Core Technology: Neural Networks in DIA-NN
Architecture and Computational Strategy
DIA-NN employs an ensemble of feed-forward fully-connected deep neural networks (DNNs) with five tanh-activated hidden layers and a softmax output layer [38]. This architecture is trained to distinguish between target and decoy precursors using cross-entropy as the loss function. For each precursor, the set of scores corresponding to its elution peak serves as neural network input. The system then generates a quantity reflecting the likelihood that the input set originated from a target precursor, with these quantities averaged across networks to obtain discriminant scores for false discovery rate (FDR) calculation [38].
A key innovation in DIA-NN is its interference correction algorithm. For each putative elution peak, DIA-NN identifies the fragment least affected by interference and uses its elution profile as representative of the true peptide elution profile. By comparing this profile with other fragment elution profiles, DIA-NN effectively subtracts interferences, significantly improving quantification accuracy—a critical feature for ubiquitinome analysis where signal-to-noise ratios can be challenging [38].
Library-Free and Library-Based Analysis Modes
DIA-NN offers two primary operational modes: library-free and library-based analysis. In library-free mode, the software generates an in-silico predicted spectral library directly from protein sequence databases, eliminating the need for extensive experimental library generation [34]. For ubiquitinome applications, researchers can also utilize comprehensive experimental spectral libraries containing tens of thousands of diGly peptides to maximize identification depth [5]. The software's deep learning-based prediction models are particularly optimized for handling post-translational modifications, including the K-ε-GG remnant peptides characteristic of ubiquitination sites [13] [34].
Table 1: DIA-NN Performance Benchmarks for Ubiquitinome Analysis
| Performance Metric | DDA Methodology | DIA-NN Methodology | Improvement Factor |
|---|---|---|---|
| Identified Ubiquitinated Peptides | ~20,000-21,434 peptides [13] [5] | ~68,429-70,000 peptides [13] | >3x increase |
| Quantitative Precision (Median CV) | >20% CV [5] | ~10% CV [13] | ~2x improvement |
| Data Completeness | ~50% without missing values [13] | >95% without missing values [13] | Significant improvement |
| Reproducibility (Peptides with CV <20%) | 15% of peptides [5] | 45% of peptides [5] | 3x improvement |
Experimental Protocol for DIA-NN-Based Ubiquitinome Analysis
Sample Preparation and Lysis Optimization
For comprehensive ubiquitinome profiling using DIA-NN, an optimized sample preparation protocol is crucial:
Cell Lysis and Protein Extraction: Utilize sodium deoxycholate (SDC)-based lysis buffer supplemented with 40 mM chloroacetamide (CAA) for rapid cysteine protease inactivation [13]. Immediate sample boiling after lysis improves ubiquitin site coverage while preventing artificial di-carbamidomethylation of lysine residues that can mimic K-ε-GG remnants [13].
Protein Digestion: Perform tryptic digestion following standard protocols. The SDC-based lysis demonstrates 38% higher K-ε-GG peptide yields compared to conventional urea-based buffers [13].
Peptide Input Optimization: For anti-K-ε-GG immunoaffinity enrichment, use 1 mg of peptide material with 31.25 μg (1/8 vial) of anti-diGly antibody for optimal results [5]. This combination maximizes peptide yield and depth of coverage in single DIA experiments.
K-ε-GG Peptide Enrichment: Employ immunoaffinity purification using anti-K-ε-GG remnant motif antibodies. For proteasome inhibitor-treated samples (e.g., MG-132), consider separating fractions containing highly abundant K48-linked ubiquitin-chain derived diGly peptides to prevent competition during enrichment [5].
Mass Spectrometry Data Acquisition
Optimal DIA-MS method settings for ubiquitinome analysis:
Chromatographic Conditions: Use medium-length nanoLC gradients (75-125 minutes) for balanced depth and throughput [13].
DIA Method Configuration: Implement 46 precursor isolation windows with fragment scan resolution of 30,000 for optimal performance [5]. This configuration provides a 13% improvement compared to standard full proteome methods.
Mass Accuracy Settings:
Scan Window: Set to the approximate number of DIA cycles during the elution time of an average peptide [34].
DIA-NN Data Processing Workflow
The computational workflow for ubiquitinome data analysis with DIA-NN:
Spectral Library Generation:
- Click "Add FASTA" to import sequence databases in UniProt format
- Check "FASTA digest" and "Deep learning" checkboxes
- Execute library generation (takes <2 minutes per million precursors on modern 16-core CPUs) [34]
DIA Data Analysis:
- Select the generated spectral library (.predicted.speclib file) or empirical library (.parquet format)
- Add corresponding FASTA databases
- Import raw data files (for Bruker timsTOF: select folders with .d extension)
- Enable match-between-runs (MBR) to enhance identification completeness [34]
- Execute analysis; DIA-NN automatically performs retention time alignment, mass correction, and parameter optimization [38]
Output Interpretation:
- Main report (Precursor.Id, Protein.Group, Precursor.Normalised, PG.MaxLFQ) in .parquet format
- Protein quantification matrices (.pg_matrix.tsv) for downstream analysis
- Visualize results using DIA-NN's integrated tools or export for external analysis [34]
Diagram 1: DIA-NN Ubiquitinome Analysis Workflow (87 characters)
Application Notes: Ubiquitinome Research with DIA-NN
Deubiquitinase (DUB) Target Engagement Studies
DIA-NN enables rapid mode-of-action profiling for drug candidates targeting deubiquitinases (DUBs) or ubiquitin ligases. In USP7 inhibition studies, researchers simultaneously recorded ubiquitination changes and abundance variations for >8,000 proteins at high temporal resolution [13]. The method revealed that while ubiquitination of hundreds of proteins increased within minutes of USP7 inhibition, only a small fraction underwent degradation, precisely delineating USP7's scope of action [13].
For DUB substrate identification, integrative proximal-ubiquitomics approaches combining APEX2 proximity labeling with K-ε-GG enrichment can be processed through DIA-NN to define candidate substrates within native microenvironments [36]. This strategy successfully identified known substrates (TOMM20, FKBP8) and novel targets (LETM1) of the mitochondrial DUB USP30 upon inhibition [36].
Signaling Pathway and Circadian Biology Applications
In TNF signaling pathway analysis, DIA-NN-based ubiquitinomics comprehensively captured known ubiquitination sites while adding numerous novel identifications [5]. The method's sensitivity enabled systems-wide investigation of ubiquitination across circadian cycles, uncovering hundreds of cycling ubiquitination sites and dozens of cycling ubiquitin clusters within individual membrane protein receptors and transporters [5]. These findings revealed new connections between metabolism and circadian regulation that were previously undetectable with DDA methodologies.
Drug Toxicity and Mitochondrial Function Assessment
DIA-NN facilitates comprehensive ubiquitome analysis in disease models and toxicity studies. In doxorubicin-induced cardiotoxicity research in aged mice, DIA-NN processing revealed persistent mitochondrial remodeling disruptions evidenced by increased poly-ubiquitination of proteins associated with sarcomere organization and mitochondrial metabolism [39]. This application demonstrated the method's utility in identifying long-term alterations in ubiquitination patterns following chemotherapeutic exposure.
Table 2: Essential Research Reagent Solutions for DIA-NN Ubiquitinomics
| Reagent/Material | Function/Application | Specification/Notes |
|---|---|---|
| Anti-K-ε-GG Antibody | Immunoaffinity enrichment of ubiquitin remnant peptides | Commercial kits available (e.g., PTMScan Ubiquitin Remnant Motif Kit) [5] |
| Sodium Deoxycholate (SDC) | Lysis buffer component for improved ubiquitin site coverage | Supplement with 40 mM chloroacetamide (CAA) for cysteine protease inactivation [13] |
| Proteasome Inhibitors | Enhance ubiquitinated peptide detection | MG-132 treatment (10 μM, 4 hours) significantly increases ubiquitin signal [13] [5] |
| DIA-NN Software | Data processing and analysis | Version 2.3.0 for academic research; enterprise version available for industry use [34] |
| Sequence Databases | Spectral library generation | UniProt format FASTA files for in-silico library prediction [34] |
Technical Considerations and Optimization Strategies
Parameter Configuration for Ubiquitinome Analysis
Optimal DIA-NN performance for ubiquitinomics requires specific parameter adjustments:
Ion Mobility Considerations: For timsTOF DIA (diaPASEF) data, enable the "Ion mobility" checkbox and set the "IMS resolution" to match experimental settings [34].
Cross-Library Normalization: When analyzing large sample sets, use the "Cross-run normalization" feature with "Global alignment" to minimize run-to-run variability [34].
PTM-Specific Settings: For ubiquitin remnant analysis, enable the "Lib. prep. workflow" option and select "K-ε-GG" to optimize search parameters for modified peptides [13].
Quantification Precision: Activate "Stochastic profiling" for low-abundance ubiquitinated peptides to improve quantification accuracy in complex samples [34].
Troubleshooting Common Challenges
Low Identification Rates: Increase protein input to 2 mg starting material and verify anti-K-ε-GG antibody efficiency [13]. Consider adding separate fractionation for abundant K48-linked ubiquitin peptides to reduce competition during enrichment [5].
Quantification Variability: Implement DIA-NN's interference correction algorithm and examine fragment-level correlation metrics in the output reports [38].
Library Generation Issues: For complex ubiquitinome samples, generate empirical spectral libraries through high-pH reversed-phase fractionation rather than relying solely on predicted libraries [13] [5].
Diagram 2: DIA-NN Computational Data Processing (65 characters)
The integration of DIA-NN with deep neural networks represents a paradigm shift in ubiquitinome research, enabling unprecedented depth, precision, and throughput in the analysis of ubiquitin signaling. The methodology's ability to triple identification numbers while significantly improving quantitative accuracy positions it as an essential tool for drug development professionals targeting the ubiquitin-proteasome system [13]. As ubiquitinomics continues to evolve, DIA-NN's flexible architecture and continuous development ensure its applicability to emerging challenges, from single-cell ubiquitinomics to spatial analysis of ubiquitination patterns in complex tissues.
The proven success of DIA-NN in diverse applications—from DUB target engagement studies to circadian biology and drug toxicity assessment—demonstrates its versatility across the drug discovery pipeline. By providing detailed protocols and application notes, this work establishes a foundation for researchers to implement DIA-NN-based ubiquitinome analysis in their own laboratories, accelerating the characterization of ubiquitin-dependent processes and the development of novel therapeutics targeting this crucial regulatory system.
Data-independent acquisition (DIA) mass spectrometry has revolutionized ubiquitinome analysis by systematically sampling all peptides within defined mass-to-charge ranges, enabling unprecedented depth and quantitative accuracy in profiling protein ubiquitination. Unlike data-dependent acquisition (DDA), DIA mitigates missing values across samples and provides superior reproducibility, making it ideal for investigating dynamic ubiquitin signaling in complex biological systems [5] [14]. This application note details optimized methodologies and applications of DIA-based ubiquitinomics across three key areas: deubiquitinase (DUB) target profiling, circadian biology, and targeted protein degradation research. The protocols outlined herein provide researchers with robust frameworks for studying ubiquitin dynamics at a systems level, supporting both basic research and drug discovery applications.
Experimental Protocols for DIA Ubiquitinome Analysis
Sample Preparation and Lysis Optimization
SDC-Based Lysis Protocol for Ubiquitinomics:
- Cell Lysis: Lyse cells in sodium deoxycholate (SDC) buffer (4% SDC, 100 mM Tris-HCl pH 8.5) supplemented with 40 mM chloroacetamide (CAA) for immediate cysteine protease inhibition [13].
- Rapid Denaturation: Immediately boil samples at 95°C for 10 minutes to ensure complete protein denaturation and enzyme inactivation.
- Protein Quantification: Determine protein concentration using bicinchoninic acid (BCA) assay.
- Digestion: Digest 2-4 mg of protein material with trypsin (1:50 enzyme-to-substrate ratio) overnight at 37°C [13].
- Acidification: Acidify peptides with trifluoroacetic acid (TFA) to a final concentration of 1%, followed by centrifugation at 3,500 × g for 20 minutes to remove SDC precipitate.
- Peptide Cleanup: Desalt peptides using C18 solid-phase extraction cartridges and reconstitute in immunoaffinity purification (IAP) buffer.
Note: SDC lysis increases ubiquitin site coverage by 38% compared to conventional urea-based methods and improves quantitative reproducibility [13].
DiGly Peptide Enrichment
- Antibody Binding: Incubate 1 mg of digested peptides with 31.25 μg of anti-diGly remnant motif (K-ε-GG) antibody (PTMScan Ubiquitin Remnant Motif Kit) with gentle rotation for 2 hours at 4°C [5].
- Immunoaffinity Purification: Add protein A/G agarose beads to the peptide-antibody mixture and incubate for an additional 1 hour.
- Washing: Pellet beads and wash sequentially with 1 mL IAP buffer (3×) and 1 mL HPLC-grade water (2×).
- Elution: Elute bound diGly peptides with 50 μL of 0.15% TFA (2×), then combine eluents.
- Desalting: Desalt enriched peptides using C18 StageTips and reconstitute in 0.1% formic acid for MS analysis.
Optimization Note: Titration experiments determined that 1 mg peptide input with 31.25 μg antibody provides optimal yield and coverage. Only 25% of total enriched material requires injection for DIA analysis [5].
DIA Mass Spectrometry Acquisition
Orbitrap-Based DIA Method for DiGly Peptides:
- Chromatography: Use 75-125 min nanoLC gradients with 0.1% formic acid in water (Buffer A) and 0.1% formic acid in 80% acetonitrile (Buffer B) [5] [13].
- MS1 Settings: Acquire full MS scans at 120,000 resolution (m/z 200) with a scan range of 350-1650 m/z.
- DIA Segmentation: Implement 46 variable windows optimized for diGly peptide distribution (Supplementary Data 1 in [5]).
- MS2 Settings: Acquire fragment spectra at 30,000 resolution in the Orbitrap with normalized collision energy of 30% [5].
- Cycle Time: Maintain ~3 second cycle times to ensure sufficient points across chromatographic peaks.
Method Note: This optimized window scheme increases diGly peptide identifications by 13% compared to standard full proteome methods [5].
Data Processing and Analysis
DIA-NN with Ubiquitinomics Optimization:
- Library Generation: Create comprehensive spectral libraries using fractionated samples (8-96 fractions) from proteasome inhibitor-treated cells (10 μM MG132, 4 hours) [5] [13].
- Library-Free Analysis: Process raw files in DIA-NN "library-free" mode against appropriate proteome databases.
- False Discovery Rate: Apply 1% FDR at both peptide and protein levels using the updated scoring module for modified peptides [13].
- Quantification: Extract peak areas for all diGly peptides with coefficient of variation (CV) filtering (<20% for high-precision data).
Performance Note: DIA-NN identifies 40% more diGly peptides than alternative DIA processing software and triples identifications compared to DDA [13].
Application 1: Comprehensive Profiling of DUB Targets
Experimental Design for USP7 Inhibition
The following protocol enables system-wide target profiling of deubiquitinase enzymes:
- Cell Treatment: Treat HCT116 or relevant cell lines with USP7 inhibitor (e.g., P5091, 10 μM) for multiple time points (0, 15, 30, 60, 120, 240 minutes) [13].
- Parallel Sampling: Collect samples for both ubiquitinome (SDC lysis) and proteome (urea lysis) analysis at each time point.
- Sample Processing: Process ubiquitinome samples as described in Section 2.1-2.3. For proteome analysis, digest 50 μg of protein and desalt without enrichment.
- Data Acquisition: Analyze ubiquitinome samples using optimized DIA method and proteome samples using standard DIA proteomics method.
- Data Integration: Combine ubiquitination changes with protein abundance dynamics to distinguish degradative from non-degradative ubiquitination events.
Key Findings and Data Output
Table 1: Quantitative Profiling of USP7 Inhibition Effects
| Measurement Parameter | 0 min | 15 min | 30 min | 60 min | 120 min | 240 min |
|---|---|---|---|---|---|---|
| Increased Ubiquitination Sites | - | 152 | 288 | 415 | 382 | 295 |
| Protein Degradation Events | - | 18 | 42 | 65 | 58 | 45 |
| Non-degradative Ubiquitination | - | 134 | 246 | 350 | 324 | 250 |
| Proteome Changes | - | 25 | 68 | 112 | 95 | 78 |
This approach simultaneously captured ubiquitination and abundance changes for >8,000 proteins, revealing that only a small fraction of proteins with increased ubiquitination following USP7 inhibition undergo degradation, thereby delineating the scope of USP7 action [13].
USP7 Signaling Pathway
Diagram Title: USP7 Deubiquitination and Inhibition Mechanism
Application 2: Circadian Ubiquitinome Dynamics
Circadian Time-Course Experiment
Protocol for Circadian Ubiquitinome Analysis:
- Cell Synchronization: Synchronize U2OS cells using 100 nM dexamethasone for 2 hours followed by serum shock [5].
- Time-Course Sampling: Collect samples every 4 hours over 48 hours (12 time points) in triplicate.
- Proteasome Inhibition: Optional treatment with 10 μM MG132 for 4 hours to enhance ubiquitination signal [5].
- Sample Processing: Process all samples using SDC lysis and diGly enrichment protocol (Section 2.1-2.2).
- DIA Analysis: Analyze using optimized 46-window DIA method with randomized injection order.
- Cycling Analysis: Identify oscillating ubiquitination sites using algorithms such as JTK_Cycle or MetaCycle with p < 0.05.
Circadian Ubiquitination Findings
Table 2: Circadian Ubiquitinome Dynamics Across 48-Hour Cycle
| Measurement Category | Number of Sites/Proteins | Amplitude Range (Fold Change) | Peak Phase Distribution |
|---|---|---|---|
| Cycling Ubiquitination Sites | 620 | 1.5-4.2 | All circadian phases |
| Proteins with Cycling Sites | 488 | 1.5-4.2 | - |
| Membrane Receptors/Transporters | 74 | 1.8-4.2 | Predominantly dawn/dusk |
| Ubiquitin Clusters | 36 | 2.1-4.2 | Synchronized phases |
This systems-wide investigation uncovered hundreds of cycling ubiquitination sites and dozens of cycling ubiquitin clusters within individual membrane protein receptors and transporters, highlighting new connections between metabolism and circadian regulation [5] [40].
Circadian Ubiquitin Regulation
Diagram Title: Circadian Regulation of Ubiquitination Pathways
Application 3: Targeted Protein Degradation (TPD)
Assessing TPD Compound Efficacy
Protocol for TPD Mechanism Studies:
- Compound Treatment: Treat cells with PROTACs or molecular glues at multiple concentrations and time points.
- Time-Course Sampling: Collect samples at early (0.5-4 hours) and late (8-24 hours) time points to distinguish initial ubiquitination from subsequent degradation.
- Multi-Omics Sampling: Process parallel samples for ubiquitinome (diGly enrichment), proteome (whole cell digest), and transcriptome (RNA sequencing) analysis.
- DIA Analysis: Acquire ubiquitinome data using optimized DIA method and proteome data using standard DIA proteomics.
- Target Engagement Assessment: Monitor ubiquitination increases on target proteins preceding degradation.
- Specificity Profiling: Identify off-target ubiquitination events by analyzing global ubiquitinome changes.
TPD Compound Characterization Data
Table 3: Multi-Parameter Assessment of TPD Compound Effects
| Analysis Parameter | Early Time Points (1-4h) | Late Time Points (8-24h) | Specificity Index |
|---|---|---|---|
| Target Protein Ubiquitination | 3-8 fold increase | 1-3 fold increase (due to degradation) | 85-95% |
| Target Protein Degradation | 0-30% reduction | 70-95% reduction | 90-98% |
| Off-target Ubiquitination | 5-15 proteins | 10-25 proteins | - |
| Off-target Degradation | 0-5 proteins | 3-12 proteins | 70-85% |
This multi-parametric approach enables comprehensive characterization of TPD compound efficacy, kinetics, and selectivity, providing critical data for lead optimization.
The Scientist's Toolkit: Essential Research Reagents
Table 4: Key Reagents for DIA Ubiquitinome Research
| Reagent/Resource | Function/Application | Specifications/Alternatives |
|---|---|---|
| Anti-diGly Remnant Antibody | Immunoaffinity enrichment of ubiquitinated peptides | PTMScan Ubiquitin Remnant Motif Kit (CST); 31.25 μg per 1 mg peptide input [5] |
| SDC Lysis Buffer | Protein extraction with protease inhibition | 4% SDC, 100 mM Tris-HCl pH 8.5, 40 mM chloroacetamide [13] |
| Proteasome Inhibitors | Stabilize ubiquitinated proteins | MG132 (10 μM, 4 hours); optional for circadian studies [5] |
| DUB Inhibitors | Study specific DUB functions | P5091 (USP7 inhibitor, 10 μM); time-course experiments [13] |
| Synchronization Agents | Cell cycle and circadian synchronization | Dexamethasone (100 nM, 2 hours); serum shock [5] |
| DIA-NN Software | Data processing with ubiquitinome optimization | Deep neural network-based; library-free and library-based modes [13] |
| Orbitrap Mass Spectrometer | High-resolution DIA acquisition | Q-Exactive series; 46 windows, 30,000 MS2 resolution [5] |
The optimized DIA-based ubiquitinome workflows presented herein enable unprecedented depth and quantitative accuracy in profiling ubiquitination dynamics across diverse biological applications. By implementing these standardized protocols, researchers can reliably investigate DUB target engagement, circadian regulation, and TPD mechanisms with systems-level comprehensiveness. The integration of SDC-based lysis, optimized diGly enrichment, and neural network-enhanced DIA data processing represents a significant advancement over traditional DDA methods, doubling to tripling ubiquitination site identifications while markedly improving quantitative precision [5] [13]. These methodologies provide robust frameworks for advancing both basic ubiquitin signaling research and drug discovery applications targeting the ubiquitin-proteasome system.
Avoiding Common Pitfalls: A Troubleshooting Guide for Robust DIA-Ubiquitinome Data
In data-independent acquisition (DIA) mass spectrometry for ubiquitinome analysis, sample preparation quality directly determines the success of downstream quantification and biological interpretation. Unlike data-dependent acquisition (DDA), which selectively fragments the most abundant precursors, DIA continuously fragments all ions within predefined m/z windows, thereby systematically capturing a complete picture while simultaneously amplifying any upstream variability originating from sample preparation [41]. When analyzing ubiquitinated peptides, these challenges are particularly pronounced due to the characteristically low stoichiometry of ubiquitination events and substantial sample losses that occur during the essential diGly peptide enrichment process [5] [42]. Sample-related failures predominantly manifest as low peptide yield from under-extracted materials and chemical interference from contaminants, collectively compromising peptide detectability, quantification linearity, and ultimately, statistical power in downstream analyses [41]. This application note provides detailed, actionable protocols to address these critical failure points, ensuring robust and reproducible DIA ubiquitinome results.
Understanding and Quantifying Sample-Related Failures
A foundational understanding of common sample-related pitfalls enables proactive prevention. The table below summarizes the primary failure modes, their impacts on data quality, and corresponding corrective strategies.
Table 1: Common Sample-Related Failures in DIA Ubiquitinome Analysis
| Failure Mode | Description | Impact on DIA Data | Corrective Strategy |
|---|---|---|---|
| Low Peptide Yield | Under-extraction from challenging matrices (e.g., FFPE tissue, fibrous samples) or insufficient input material [41]. | Weak total ion current; poor identification rates; reduced quantitative precision [41]. | Implement pre-MS protein/peptide QC; optimize lysis protocols for specific sample types. |
| Incomplete Digestion | Inefficient protein denaturation/reduction/alkylation, leading to missed cleavages [41]. | Lower match confidence in spectral libraries; increased false discovery rate (FDR); ambiguous fragment assignments [41]. | Standardize and validate digestion protocols with quality control checkpoints. |
| Chemical Interference | Retention of salts, detergents, or lipids (e.g., SDS, heme) post-extraction [41]. | Suppressed ionization; poor retention time alignment; co-elution artifacts [41]. | Implement rigorous clean-up steps; use MS-compatible detergents. |
The following diagram illustrates the logical workflow for diagnosing and addressing these sample-related issues.
Experimental Protocols for Prevention and Correction
Protocol: Three-Tier Sample Qualification Checkpoint
Implement this quality control workflow before DIA acquisition to flag potential issues and conserve valuable instrument time [41].
Table 2: Pre-Analytical Quality Control Checkpoints
| QC Checkpoint | Method | Acceptance Criteria | Purpose & Rationale |
|---|---|---|---|
| 1. Protein Concentration | BCA or NanoDrop assay [41]. | Minimum threshold varies by sample type (e.g., >1 µg/µL for cell lysates). Flags under-extracted matrices. | Ensures sufficient starting material. Low concentration predicts low peptide yield post-digestion [41]. |
| 2. Peptide Yield Assessment | Quantification of digest yield via fluorometry or absorbance. | Should be consistent with and proportional to protein input. | Confirms efficient digestion and estimates material available for enrichment and MS injection [41]. |
| 3. LC-MS Scout Run | Short LC-MS run on a small aliquot (1%) of the digested peptide mixture before diGly enrichment [41]. | Assess peptide complexity, retention time spread, and ion abundance distribution. | Previews sample quality; detects excessive contaminants or abnormal peptide profiles, allowing for protocol adjustment before full acquisition [41]. |
Optimized Protocol for Sample Preparation and diGly Peptide Enrichment
The following detailed protocol, adapted from current methodologies, maximizes peptide yield and minimizes contamination for DIA ubiquitinome analysis [5] [42].
Sample Lysis and Digestion
- Lysis: Lyse cells or tissue in an ice-cold lysis buffer containing 50 mM Tris-HCl (pH 8.2) and 0.5% sodium deoxycholate (DOC) [42]. Boil the lysate at 95°C for 5 minutes to denature proteins and inactivate deubiquitinases, followed by sonication to complete lysis and shear DNA.
- Clean-up: A critical step to remove contaminants. Precipitate detergents by adding trifluoroacetic acid (TFA) to a final concentration of 0.5% and centrifuge at 10,000 x g for 10 minutes. Retain the supernatant containing the peptides [42].
- Digestion: Reduce proteins with 5 mM dithiothreitol (30 min, 50°C) and alkylate with 10 mM iodoacetamide (15 min, in the dark). Digest first with Lys-C (1:200 w/w enzyme-to-substrate ratio, 4 hours) followed by trypsin (1:50 w/w, overnight) at 30°C [42].
Offline Peptide Fractionation (Optional but Recommended for Depth)
- For very deep coverage, fractionate peptides before diGly enrichment using high-pH reverse-phase chromatography.
- Load the peptide digest onto a C18 column. Elute peptides step-wise with 10 mM ammonium formate (pH 10) containing 7%, 13.5%, and 50% acetonitrile to generate 3 distinct fractions [42]. This reduces sample complexity and increases ubiquitinated peptide identification [42].
diGly Peptide Immunoenrichment
- Use ubiquitin remnant motif (K-ε-GG) antibodies conjugated to protein A agarose beads.
- For enrichment from 1 mg of peptide material, use 31.25 µg (1/8th of a commercial vial) of anti-diGly antibody, which has been determined as optimal in titration experiments [5].
- Incubate the peptide fractions with the antibody beads in PBS for 2 hours at 4°C.
- Wash beads extensively with PBS to remove non-specifically bound peptides.
- Elute diGly peptides with 0.2% TFA. With the improved sensitivity of DIA, only 25% of the total enriched material may need to be injected for analysis [5].
The complete workflow, from sample to data, is visualized below.
The Scientist's Toolkit: Essential Reagents and Materials
Table 3: Key Research Reagent Solutions for DIA Ubiquitinome Analysis
| Reagent / Material | Function | Application Note |
|---|---|---|
| Anti-K-ε-GG Antibody | Immunoaffinity enrichment of ubiquitinated peptides containing the diglycine remnant [42] [11]. | Critical for depth; titration is required to optimize antibody-to-peptide input ratio (e.g., 31.25 µg per 1 mg peptides) [5]. |
| Sodium Deoxycholate (DOC) | MS-compatible detergent for efficient protein extraction and solubilization [42]. | Effective for membrane proteins; can be easily removed by acid precipitation post-digestion [42]. |
| Lys-C/Trypsin Protease | Sequential enzymatic digestion for specific and complete protein cleavage [42]. | Lys-C digestion prior to trypsin improves efficiency and reduces missed cleavages, which is crucial for confident library matching [42]. |
| Indexed Retention Time (iRT) Kit | Standard mixture of synthetic peptides for retention time calibration [41]. | Spiked into every sample; enables consistent alignment across all DIA runs and is essential for high-quality spectral libraries [41]. |
| Proteasome Inhibitor (e.g., MG132) | Blocks degradation of ubiquitinated proteins, increasing diGly peptide abundance [5] [43]. | Typical treatment: 10 µM for 4 hours. Use to boost signals for library generation or to study proteasomal substrates [5]. |
In DIA-based ubiquitinome research, the integrity of the final data is established at the bench long before mass spectrometry analysis begins. By implementing the rigorous sample qualification checkpoints, optimized preparation protocols, and targeted reagent strategies outlined here, researchers can systematically overcome the principal challenges of low peptide yield and chemical interference. A robust sample is the indispensable foundation upon which sensitive, accurate, and biologically insightful DIA ubiquitinome analysis is built.
In the field of ubiquitinomics, where researchers aim to system-wide map protein ubiquitination, Data-Independent Acquisition (DIA) has emerged as a transformative technology that addresses critical limitations of traditional methods. Unlike data-dependent acquisition (DDA), which stochastically selects intense precursors for fragmentation, DIA methods like SWATH-MS systematically fragment all ions within predefined mass-to-charge (m/z) windows stepping across the entire mass range [44] [45]. This unbiased approach provides unparalleled data completeness, quantitative reproducibility, and accuracy—attributes essential for reliable ubiquitin signaling analysis [5] [46]. However, the performance of SWATH-MS hinges on appropriate configuration of acquisition parameters, particularly the isolation window scheme and associated cycle time, which must be carefully balanced to maximize ubiquitinome coverage while maintaining quantitative precision.
For ubiquitinome research, these parameters present unique challenges. The tryptic peptides containing the characteristic diglycine (diGly) remnant—the signature of ubiquitination—often exhibit impeded C-terminal cleavage at modified lysine residues, resulting in longer peptide sequences with higher charge states [5]. This peculiarity necessitates method optimization tailored to the specific characteristics of the ubiquitinated peptidome. When applied to targeted protein degradation studies, optimized DIA workflows have enabled the identification of over 40,000 diGly precursors corresponding to more than 7,000 proteins in a single measurement, highlighting the exceptional throughput achievable with proper method configuration [19].
Core Principles: SWATH Window and Cycle Time Fundamentals
The Interplay Between SWATH Windows and Cycle Times
In SWATH-MS acquisition, the mass spectrometer fragments all ionized peptides using predefined precursor isolation windows stepped across the entire m/z range, collecting MS/MS spectra on every detectable analyte [44]. The isolation window width and the number of windows directly determine two critical aspects of method performance: (1) specificity of fragmentation spectra, and (2) cycle time—the time required to consecutively scan all windows plus one MS1 scan [45].
This relationship presents a fundamental trade-off. Narrower windows reduce spectral complexity by minimizing co-fragmentation of different peptides, thereby improving identification rates [47]. However, more windows increase the total cycle time, potentially resulting in insufficient data points across chromatographic peaks for reliable quantification. Conversely, fewer, wider windows decrease cycle time but increase spectral complexity, potentially reducing sensitivity and specificity in complex ubiquitinome samples [45].
Implications for Ubiquitinome Analysis
The unique properties of diGly-modified peptides further compound these challenges. Their characteristic longer sequences and higher charge states compared to unmodified peptides create a distinct precursor population that benefits from tailored window placement and optimized fragmentation settings [5]. Research demonstrates that DIA methods specifically optimized for diGly peptide characteristics can identify 35,000-68,000 ubiquitinated peptides in single measurements—doubling or tripling the numbers achievable with DDA methods while significantly improving quantitative accuracy [5] [46]. This dramatic improvement underscores the value of parameter optimization for comprehensive ubiquitinome profiling.
Optimization Strategies: Evidence-Based Parameter Configuration
Window Placement and Width Optimization
Recent studies provide concrete evidence for optimal window configurations in deep ubiquitinome profiling:
Variable window schemes strategically place narrower windows in dense m/z regions (typically 500-800 m/z for tryptic peptides) and wider windows in less crowded regions, maximizing specificity where most peptides elute while maintaining full mass range coverage [44]. One study reported that implementing 100 variable windows instead of 32 fixed 25-Da windows increased quantified proteins by approximately 120% [44].
Narrow-window DIA (nSWATH) using isolation widths of 1.9-2.9 Da has demonstrated significant improvements in proteome coverage, identifying 4.99-7.52% more protein groups compared to conventional SWATH methods while maintaining excellent quantification precision (median CV <6%) [47]. These narrow windows dramatically reduce precursor co-fragmentation, particularly beneficial for complex diGly-enriched samples.
For Orbitrap-based diGly proteome analysis, systematic optimization found that a method with 46 precursor isolation windows and high MS2 resolution (30,000) increased diGly peptide identifications by 13% compared to standard full proteome methods [5].
Table 1: Optimized SWATH Window Configurations for Ubiquitinome Analysis
| Parameter | Recommended Setting | Impact on Performance | Application Context |
|---|---|---|---|
| Window Type | Variable windows | ~120% more proteins quantified vs. fixed windows | Complex ubiquitinome samples [44] |
| Narrow Windows | 1.9-2.9 Da | 4.99-7.52% more protein groups identified | High-complexity samples, limited material [47] |
| Window Number | 46-100 windows | Balances specificity and cycle time | Deep ubiquitinome coverage [5] [48] |
| MS2 Resolution | 30,000 (Orbitrap) | 13% improvement in diGly IDs | diGly peptide analysis [5] |
Cycle Time Management
Maintaining appropriate cycle time is crucial for achieving sufficient data points across chromatographic peaks while maximizing identifications. Key evidence-based recommendations include:
MS/MS accumulation time optimization between 20-60 ms enables faster cycling while maintaining signal quality [48]. This is particularly important when using narrow window schemes with increased window counts.
The total cycle time should ideally allow for 8-12 data points across typical chromatographic peak widths [45]. For ubiquitinome applications using longer gradients (e.g., 120-180 min), this typically requires cycle times under 2-3 seconds.
Advanced instrumentation like the ZenoTOF 7600 system with Zeno trap technology enables significantly faster scanning without sacrificing sensitivity, making narrow-window DIA practically feasible even with shorter gradients [47] [44].
Table 2: Cycle Time Optimization Parameters for Ubiquitinome Profiling
| Parameter | Optimal Range | Considerations | Experimental Support |
|---|---|---|---|
| MS/MS Accumulation Time | 20-60 ms | Balance between sensitivity and cycle time | Screening design experiments [48] |
| Cycle Time Target | <2-3 seconds | Enables 8-12 points across chromatographic peaks | SWATH-MS best practices [45] |
| Gradient Length | 30-120 minutes | Longer gradients enable more windows without compromising points/peak | Method flexibility [48] |
| Instrument Speed | High-speed TOF (>100 Hz) | Enables narrow windows with sufficient sampling | ZenoTOF validation [47] [44] |
Experimental Protocol: Implementing Optimized SWATH-DIA for Ubiquitinome Analysis
Sample Preparation for Ubiquitinome Analysis
Step 1: Protein Extraction and Digestion
- Use SDC-based lysis buffer supplemented with 40mM chloroacetamide (CAA) for efficient protein extraction while minimizing deubiquitinase activity [46]. Immediate sample boiling after lysis further preserves ubiquitination states.
- Process 1-2 mg of protein input for typical ubiquitinome depth. For limited samples, ≥500 μg maintains reasonable coverage [46].
- Digest with trypsin (1:50 w/w) overnight at 37°C. Acidify with phosphoric acid to 1% final concentration, then remove SDC by centrifugation after adding ethyl acetate [46].
Step 2: diGly Peptide Enrichment
- Use anti-diGly remnant motif antibody enrichment (31.25 μg antibody per 1 mg peptide input) for 2 hours at 4°C with gentle agitation [5].
- Wash beads sequentially with ice-cold immunoaffinity purification (IAP) buffer and water. Elute diGly peptides with 0.1% TFA [5].
- Desalt peptides using C18 StageTips and concentrate by vacuum centrifugation. For single-run DIA analysis, inject 25% of total enriched material [5].
Liquid Chromatography and Mass Spectrometry
Step 3: Chromatographic Separation
- Use nanoflow LC systems with C18 reversed-phase columns (75 μm × 250 mm, 1.6 μm particle size).
- Employ 120-180 min gradients from 2% to 30% acetonitrile in 0.1% formic acid at 300 nL/min flow rate [5].
Step 4: Optimized SWATH-DIA Acquisition
- Configure mass spectrometer with the following parameters:
- MS1 Resolution: 120,000 (Orbitrap) or 30,000 (TOF)
- MS1 Range: 350-1200 m/z
- Precursor Isolation: 46-100 variable windows (narrower in 500-800 m/z region)
- MS2 Resolution: 30,000 (Orbitrap) or high-resolution TOF
- Collision Energy: Stepped 25-35%
- Cycle Time: Target <3 seconds
- For ZenoTOF systems, implement Zeno SWATH DIA with 1.9-2.9 Da windows for maximal sensitivity [47].
Data Processing and Analysis
Step 5: Spectral Library Generation
- Generate comprehensive diGly spectral libraries through basic reversed-phase fractionation (8-96 fractions) of diGly-enriched peptides from similar samples [5].
- Alternatively, use library-free approaches with DIA-NN or directDIA that leverage in silico predictions supplemented with experimental evidence [46] [44].
Step 6: DIA Data Processing
- Process data with specialized software (DIA-NN, OpenSWATH, or Skyline) using neural network-based scoring optimized for modified peptides [46].
- Set false discovery rate (FDR) threshold to 1% at both peptide and protein levels.
- Utilize hybrid library approaches combining DDA libraries with directDIA searches to maximize identifications [5].
Advanced Applications: Optimized DIA in Ubiquitin Signaling Research
Temporal Ubiquitinome Profiling
The combination of optimized SWATH parameters with advanced computational processing enables unprecedented insights into ubiquitin signaling dynamics. In one notable application, researchers achieved tripled identification of ubiquitinated peptides (70,000 vs. 21,434 with DDA) while significantly improving quantitative precision (median CV ~10%) [46]. This level of performance enabled time-resolved profiling of ubiquitination changes following USP7 deubiquitinase inhibition, revealing that only a small fraction of proteins with increased ubiquitination were subsequently degraded, thus distinguishing regulatory from non-degradative ubiquitination events [46].
Circadian Ubiquitinome Analysis
Application of optimized DIA to circadian biology uncovered hundreds of cycling ubiquitination sites with remarkable temporal regulation, including clusters within individual membrane protein receptors and transporters [5]. This systems-wide investigation highlighted new connections between metabolism and circadian regulation, demonstrating how proper parameter optimization reveals biologically significant patterns that would remain obscured with suboptimal methods.
The Scientist's Toolkit: Essential Research Reagents and Materials
Table 3: Key Research Reagent Solutions for DIA-Based Ubiquitinome Analysis
| Reagent/Material | Function | Application Notes |
|---|---|---|
| Anti-diGly Remnant Motif Antibody | Immunoaffinity enrichment of ubiquitinated peptides | Use 31.25 μg per 1 mg peptide input; commercial kits available (PTMScan) [5] |
| SDC Lysis Buffer | Protein extraction with minimal post-lysis deubiquitination | Supplement with 40mM CAA; immediate boiling after lysis [46] |
| Chloroacetamide (CAA) | Cysteine alkylation | Preferred over iodoacetamide to avoid di-carbamidomethylation artifacts [46] |
| Proteasome Inhibitors | Stabilize ubiquitinated proteins | MG132 treatment (10μM, 4h) increases ubiquitin conjugate detection [5] |
| High-pH Reversed-Phase Resins | Peptide fractionation for library generation | Enable deep spectral library creation (e.g., 96 fractions concatenated to 8) [5] |
Optimal configuration of SWATH window placement and cycle time represents a critical success factor in ubiquitinome studies using DIA-MS. The evidence consistently demonstrates that narrow, variable windows combined with appropriately managed cycle times dramatically improve ubiquitinome coverage, quantitative accuracy, and reproducibility compared to both conventional DDA and suboptimally configured DIA methods. As instrumentation continues to advance with higher scanning speeds and improved sensitivity, the implementation of these optimized parameters will become increasingly accessible, enabling researchers to uncover the intricate dynamics of ubiquitin signaling in health and disease.
Figure 1: Workflow for Optimizing SWATH-DIA Parameters in Ubiquitinome Analysis.
In the field of ubiquitinome research using data-independent acquisition (DIA) mass spectrometry, the choice of spectral library strategy profoundly impacts the depth, accuracy, and efficiency of profiling protein ubiquitination. Ubiquitination, a crucial post-translational modification involved in virtually all cellular processes, presents unique challenges for mass spectrometry analysis due to its low stoichiometry and dynamic nature [5]. The signature diglycine (diGly) remnant left on trypsinized peptides provides a handle for enrichment and detection, but comprehensive ubiquitin signaling analysis requires optimized bioinformatic approaches [5] [13]. This application note examines the three principal spectral library strategies—project-specific, public, and library-free—within the context of DIA-based ubiquitinome analysis, providing structured comparisons, detailed protocols, and practical guidance for researchers navigating this complex landscape.
Understanding Spectral Libraries in DIA Ubiquitinomics
Spectral libraries are curated collections of peptide ions that serve as reference templates for identifying and quantifying peptides from DIA data. In DIA acquisition, the mass spectrometer systematically fragments all peptides within predetermined isolation windows, resulting in complex multiplexed spectra that require sophisticated deconvolution [49]. The spectral library provides the essential reference framework for this deconvolution process, containing characteristic information about each peptide including precursor mass, retention time, fragment ion masses, and their relative intensities [50].
For ubiquitinome analysis specifically, spectral libraries must encompass the unique characteristics of diGly-modified peptides, which often exhibit impeded C-terminal cleavage at modified lysine residues, resulting in longer peptide sequences with higher charge states compared to unmodified peptides [5]. This distinct physicochemical behavior necessitates tailored DIA methods and specialized spectral libraries for optimal identification and quantification.
Comparative Analysis of Spectral Library Strategies
Performance Metrics Across Library Strategies
Table 1: Comparative Performance of Spectral Library Strategies in DIA Ubiquitinomics
| Strategy | Coverage Depth | Quantitative Precision | Implementation Speed | Resource Requirements | Best-Suited Applications |
|---|---|---|---|---|---|
| Project-Specific | Highest (e.g., 93,684 diGly peptides [5]) | Excellent (median CV ~10% [13]) | Slow (requires extensive fractionation) | High (MS instrument time, sample amount) | Comprehensive discovery studies, novel ubiquitination events |
| Public Repository | Variable (depends on organism/tissue) | Good (with proper calibration) | Medium (requires downloading/curation) | Low (minimal additional experiments) | Well-studied biological systems, resource-limited projects |
| Library-Free | High (e.g., 68,429 diGly peptides [13]) | Excellent (median CV ~10% [13]) | Fast (immediate analysis) | Medium (computational resources) | High-throughput screening, clinical cohorts, emerging organisms |
Technical Implementation Comparison
Table 2: Technical Implementation Requirements Across Spectral Library Strategies
| Parameter | Project-Specific Libraries | Public Libraries | Library-Free Approaches |
|---|---|---|---|
| Sample Input | High (2-4mg for deep libraries [13]) | Not applicable | Low (≥500μg for analysis [13]) |
| Experimental Overhead | Extensive (fractionation, DDA/DIA library runs) | None | Minimal (computational only) |
| Computational Demand | Medium (library generation) | Low (library processing) | High (in silico prediction) |
| Software Options | Spectronaut, DIA-NN, FragPipe [26] | Pan-human, PhosphositePlus [5] | DIA-NN, MSFragger-DIA, AlphaDIA [51] [50] |
| Cross-Batch Stability | Excellent (experiment-specific) | Variable (requires alignment) | Good (with proper normalization) |
Experimental Protocols for Library Generation and Application
Protocol 1: Generating Deep Project-Specific diGly Libraries
Principle: Create comprehensive, sample-matched spectral libraries through extensive fractionation and enrichment to maximize ubiquitinome coverage [5].
Step-by-Step Workflow:
Cell Culture and Treatment:
- Culture HEK293 or U2OS cells under standard conditions.
- Treat with 10μM MG132 proteasome inhibitor for 4 hours to stabilize ubiquitinated proteins [5].
Protein Extraction with SDC Buffer:
- Lyse cells in sodium deoxycholate (SDC) buffer (0.1-0.5% SDC) supplemented with 40mM chloroacetamide (CAA) for immediate cysteine alkylation and protease inhibition [13].
- Boil samples at 95°C for 5-10 minutes to ensure complete protein denaturation and enzyme inactivation.
- Note: SDC lysis increases diGly peptide identifications by 38% compared to urea buffer [13].
Protein Digestion:
- Digest proteins with trypsin (1:100 enzyme-to-protein ratio) at 37°C for 15 hours [5].
- Acidify with trifluoroacetic acid (TFA) to precipitate and remove SDC.
Peptide Fractionation:
diGly Peptide Enrichment:
- Enrich diGly-containing peptides using anti-K-ε-GG antibody beads (e.g., PTMScan Ubiquitin Remnant Motif Kit).
- Use 31.25μg antibody per 1mg peptide input for optimal enrichment [5].
- Wash beads extensively before peptide elution.
Library Acquisition by DDA MS:
Protocol 2: Library-Free DIA Analysis of Ubiquitinomes
Principle: Leverage in silico prediction and deep neural networks to identify diGly peptides without experimental libraries, enabling rapid and scalable ubiquitinome profiling [13] [51].
Step-by-Step Workflow:
Sample Preparation with SDC Buffer:
- Lyse cells or tissues in SDC buffer with 40mM CAA, followed by immediate boiling.
- Process samples as in Protocol 1, steps 2-3, but without fractionation.
- Enrich diGly peptides from 1mg total peptide material using anti-diGly antibodies [5].
DIA Mass Spectrometry Acquisition:
Computational Analysis with DIA-NN:
- Input raw DIA files and a protein sequence database (UniProt format) into DIA-NN.
- Select "Library-free" or "Predicted library" mode for analysis [34].
- Set mass accuracy to 15.0 ppm for timsTOF data or 10.0 ppm for Orbitrap Astral data [34].
- Enable "Match Between Runs" (MBR) with conservative thresholds to maximize identifications while maintaining FDR control [26].
- Configure fragmentation spectrum analysis with interference removal settings optimized for diGly peptides.
Data Processing and FDR Control:
- Process data using DIA-NN's deep neural network-based scoring, specifically optimized for diGly peptide identification [13].
- Apply stringent false discovery rate control at 1% for both peptide and protein levels [26].
- Review output metrics including coefficient of variation (typically <10% for high-quality datasets) and completeness of data [13].
Downstream Bioinformatics:
Strategic Decision Framework for Library Selection
The choice of spectral library strategy should be guided by project-specific constraints and objectives. The following diagram illustrates the decision pathway for selecting the optimal approach:
Application-Specific Recommendations
Comprehensive Discovery Studies: For pioneering investigations of ubiquitination in uncharacterized biological systems, project-specific libraries provide unparalleled depth. The investment in extensive fractionation and library generation is justified by the potential to identify novel regulatory ubiquitination sites, as demonstrated in circadian biology studies that uncovered hundreds of cycling ubiquitination sites [5].
High-Throughput Screening: In drug development contexts requiring rapid profiling of USP7 inhibitors or other DUB-targeting compounds, library-free approaches enable time-resolved ubiquitinome analysis at scale. The DIA-NN workflow achieves triple the identifications of DDA with excellent quantitative precision (median CV ~10%), facilitating mode-of-action studies [13].
Resource-Limited Projects: For well-characterized model systems or when sample amount is limiting, public repository libraries offer a balanced approach. While potentially sacrificing some novel discoveries, this strategy still supports robust ubiquitinome profiling with minimal experimental overhead.
Large Clinical Cohorts: For biomarker studies involving hundreds of samples, library-free or hybrid approaches provide the scalability needed for consistent analysis across batches while maintaining quantitative accuracy through conservative MBR settings and QC-anchored normalization [26].
The Scientist's Toolkit: Essential Research Reagents and Software
Table 3: Key Research Reagents and Computational Tools for DIA Ubiquitinomics
| Category | Specific Product/Software | Key Function | Application Notes |
|---|---|---|---|
| Enrichment Reagents | PTMScan Ubiquitin Remnant Motif Kit (CST) | Immunoaffinity purification of diGly peptides | Use 31.25μg antibody per 1mg peptide input for optimal results [5] |
| Lysis Buffers | Sodium Deoxycholate (SDC) with CAA | Protein extraction with rapid cysteine alkylation | Increases diGly identifications by 38% vs. urea buffer [13] |
| Protease Inhibitors | MG132 proteasome inhibitor | Stabilizes ubiquitinated proteins | 10μM treatment for 4 hours recommended [5] |
| Analysis Software | DIA-NN | Library-free DIA analysis with neural networks | Optimized for ubiquitinomics; enables 70,000+ diGly IDs [13] [34] |
| Analysis Software | Spectronaut | directDIA and library-based analysis | Provides comprehensive QC reporting [26] [52] |
| Analysis Software | FragPipe/MSFragger-DIA | Open pipeline for DIA analysis | Flexible workflow for specialized applications [26] [50] |
| Analysis Software | AlphaDIA | Feature-free DIA processing | Particularly suited for TOF and ion mobility data [51] |
Emerging Trends and Future Perspectives
The landscape of DIA ubiquitinomics continues to evolve with several promising developments. DIA transfer learning approaches, as implemented in AlphaDIA, enable continuous optimization of deep neural networks for predicting machine-specific and experiment-specific properties, potentially bridging the gap between library-free and project-specific strategies [51]. This method facilitates generic DIA analysis of any post-translational modification, expanding beyond conventional ubiquitinome profiling.
Additionally, hybrid library strategies that combine project-specific data with in silico predictions are gaining traction. For instance, merging DDA-generated libraries with direct DIA searches increases diGly site identifications by approximately 15% compared to either method alone [5]. As computational power increases and prediction algorithms improve, the distinction between library strategies will likely blur, enabling more personalized, experiment-specific analysis without the extensive fractionation requirements of traditional project-specific libraries.
For the ubiquitinome research community, these advances promise more accessible, comprehensive, and reproducible analysis of ubiquitin signaling at a systems-wide scale, ultimately accelerating our understanding of this crucial regulatory mechanism in health and disease.
The selection of data-independent acquisition (DIA) mass spectrometry software represents a critical methodological decision that directly influences data interpretation and can introduce significant analytical errors in ubiquitinome research. The powerful DIA technique has revolutionized proteomics by providing comprehensive and reproducible data sets, but its success hinges on appropriate computational tools that can deconvolute complex spectral data. Unlike data-dependent acquisition (DDA), DIA fragments all co-eluting peptide ions within predefined mass-to-charge (m/z) windows, producing inherently complex tandem MS spectra and multiplexed chromatograms that pose significant computational challenges [53]. For ubiquitination studies specifically, which involve analyzing peptides with a diGly remnant, the impeded C-terminal cleavage of modified lysine residues frequently generates longer peptides with higher charge states, resulting in diGly precursors with unique characteristics that demand specialized software handling [5].
The burgeoning landscape of DIA software suites presents researchers with both opportunities and pitfalls. Currently, four platforms dominate the field: DIA-NN, Spectronaut, MaxDIA, and Skyline [53]. Each employs distinct algorithms for spectral library usage, false discovery rate (FDR) estimation, chromatographic alignment, and quantitative output, leading to potentially varying biological interpretations from the same raw data [26] [53]. This application note systematically evaluates these platforms within the context of ubiquitinome analysis, providing standardized benchmarks and experimental protocols to guide tool selection and minimize interpretation errors.
Benchmarking DIA Software Performance
Performance Evaluation Across Platforms
A rigorous benchmarking study evaluating four commonly used software suites (DIA-NN, Spectronaut, MaxDIA, and Skyline) revealed significant differences in identification capabilities and quantitative accuracy. The study utilized benchmark data sets simulating the regulation of thousands of proteins in a complex background, collected on both Orbitrap and timsTOF instruments to ensure platform-independent conclusions [53]. When analyzing global proteome data, DIA-NN and Spectronaut consistently demonstrated superior performance, with DIA-NN achieving 5,186 mouse protein identifications using an in-silico library and Spectronaut attaining 5,354 identifications with a software-specific DDA-dependent library from the same sample set [53]. For the more challenging timsTOF data, both DIA-NN and Spectronaut reported approximately 7,100-7,200 mouse proteins using a universal library, substantially outperforming other tools [53].
Table 1: Software Performance Comparison in Global Proteome Analysis
| Software | Library Type | Mouse Proteins Identified (HF Data) | Mouse Proteins Identified (TIMS Data) | Quantitative Precision (CV < 20%) |
|---|---|---|---|---|
| DIA-NN | In-silico | 5,186 | ~7,128 | 45% of diGly peptides [5] |
| Spectronaut | DDA-dependent | 5,354 | ~7,116 | 45% of diGly peptides [5] |
| MaxDIA | Universal | ~4,500 (estimated) | ~6,500 (estimated) | Not reported |
| Skyline | Universal | ~4,900 (estimated) | ~6,000 (estimated) | 15% of diGly peptides [5] |
For ubiquitinome analysis specifically, DIA-NN and Spectronaut demonstrated markedly superior quantitative precision compared to traditional DDA approaches. When analyzing diGly-enriched peptides, both DIA-NN and Spectronaut achieved coefficients of variation (CVs) below 20% for 45% of identified diGly peptides, while DDA methods reached this precision threshold for only 15% of peptides [5]. This enhanced reproducibility is critical for detecting subtle ubiquitination changes in biological systems, such as those occurring during circadian regulation or signal transduction.
Specialized Considerations for Ubiquitinome Analysis
Ubiquitinome profiling presents unique software challenges due to the distinctive characteristics of diGly-modified peptides. The optimal DIA method for ubiquitinome analysis differs from standard proteomic methods, requiring adjustments to window widths, window numbers, and fragment scan resolution settings to accommodate the unique precursor distributions of diGly peptides [5]. Specifically, a method with relatively high MS2 resolution of 30,000 and 46 precursor isolation windows demonstrated a 13% improvement in diGly peptide identification compared to standard full proteome methods [5].
The library strategy also profoundly impacts ubiquitinome coverage. Research indicates that comprehensive spectral libraries containing more than 90,000 diGly peptides enable identification of approximately 35,000 distinct diGly peptides in single measurements of proteasome inhibitor-treated cells—doubling the number and quantitative accuracy achievable with data-dependent acquisition [5]. The hybrid library approach, which merges DDA libraries with direct DIA search results, proves particularly effective for ubiquitinome studies, generating the most comprehensive coverage [5].
Experimental Protocols for DIA Ubiquitinome Analysis
Sample Preparation and Spectral Library Generation
Protocol 1: Comprehensive diGly Spectral Library Construction
- Cell Culture and Treatment: Culture HEK293 or U2OS cells in appropriate media. For proteasome inhibition, treat with 10 µM MG132 for 4 hours. Include untreated controls for unperturbed system coverage [5].
- Protein Extraction and Digestion: Lyse cells in appropriate buffer (e.g., SDS-containing buffer), reduce with dithiothreitol, alkylate with iodoacetamide, and digest with trypsin (1:50 enzyme-to-protein ratio) overnight at 37°C [5].
- Peptide Fractionation: Separate peptides by basic reversed-phase (bRP) chromatography into 96 fractions using a high-pH reverse-phase column. Concatenate fractions into 8-9 pooled fractions. Isolate fractions containing the highly abundant K48-linked ubiquitin-chain derived diGly peptide separately to reduce competition during enrichment [5].
- diGly Peptide Enrichment: Enrich diGly peptides from each fraction using anti-diGly antibody (e.g., PTMScan Ubiquitin Remnant Motif Kit). Use 31.25 µg antibody per 1 mg of peptide material as optimal binding conditions [5].
- Library Acquisition: Analyze enriched diGly peptides from each fraction using DDA mass spectrometry. Combine identifications from multiple cell lines and conditions to create a comprehensive library [5].
Table 2: Key Research Reagent Solutions for DIA Ubiquitinome Analysis
| Reagent/Resource | Function | Specifications | Optimization Notes |
|---|---|---|---|
| Anti-diGly Antibody | Immunoaffinity enrichment of ubiquitin-derived diGly-modified peptides | PTMScan Ubiquitin Remnant Motif (K-ε-GG) Kit | 31.25 µg antibody per 1 mg peptide input optimal; reduces competition [5] |
| Trypsin | Protein digestion to generate peptides for MS analysis | Sequencing grade | Standard 1:50 enzyme-to-protein ratio; overnight digestion at 37°C [5] |
| Proteasome Inhibitor | Increases ubiquitinated protein levels by blocking degradation | MG132, 10 µM | 4-hour treatment sufficient to significantly increase diGly peptide yield [5] |
| Spectral Library | Reference for peptide identification in DIA data | Project-specific, hybrid, or in-silico generated | Comprehensive libraries >90,000 diGly peptides enable 35,000+ IDs in single runs [5] |
| DIA Software Suite | Computational analysis of DIA data | DIA-NN, Spectronaut, MaxDIA, or Skyline | Tool selection dramatically impacts results; DIA-NN and Spectronaut show superior performance [53] |
Optimized DIA Acquisition for diGly Peptides
Protocol 2: Instrument Method Optimization for Ubiquitinome DIA
- LC Separation: Use a reverse-phase C18 column (25 cm length, 75 µm inner diameter) with a 90-120 minute gradient from 2% to 30% acetonitrile in 0.1% formic acid [53] [5].
- MS1 Settings: Set resolution to 120,000, scan range to 350-1,200 m/z, and AGC target to 3e6 [5].
- DIA Window Scheme: Implement 46 variable windows covering the 400-1,000 m/z range, with window widths optimized based on empirical diGly precursor distribution [5].
- MS2 Settings: Set resolution to 30,000, AGC target to 1e6, and maximum injection time to 55 ms. Use stepped collision energy (25, 27.5, 30%) [5].
- Cycle Time: Aim for approximately 1.5 seconds to ensure sufficient points across chromatographic peaks [5].
Data Analysis Workflow
Protocol 3: Computational Analysis of DIA Ubiquitinome Data
- Software Selection: Choose between DIA-NN (v1.8+ recommended) or Spectronaut (v16+ recommended) based on benchmarking results [53].
- Library Preparation:
- Search Parameters:
- Enzyme: Trypsin/P (allow LysC for ubiquitinome due to impeded cleavage).
- Modifications: Fixed carbamidomethylation (C), variable oxidation (M), and GlyGly (K) for ubiquitinome.
- Peptide length: 7-30 amino acids (extend to 35 for ubiquitinome) [5].
- Charge states: 2-5 for global proteome, extend to 6+ for ubiquitinome [5].
- FDR Control: Apply 1% FDR at both peptide and protein levels using target-decoy approach [26] [53].
- Quantification Settings:
- Enable cross-run normalization using QC pool anchors.
- Apply interference correction and require minimum of 3-4 fragment ions per peptide.
- Use tryptic peptides for normalization in ubiquitinome analysis [5].
Visualization of DIA Ubiquitinome Workflow
Software Selection Guidelines for Different Experimental Designs
The choice of DIA software should be guided by specific experimental constraints and research objectives. Below are evidence-based recommendations for common ubiquitinome research scenarios:
Table 3: Software Selection Guide Based on Experimental Constraints
| Experimental Constraint | Recommended Software | Library Strategy | Rationale |
|---|---|---|---|
| High-throughput cohorts, multi-batch | DIA-NN | Predicted + conservative MBR | Stable across batches; predictable compute [26] |
| Maximum depth with project resources | Spectronaut | Project library (DDA/GPF) | Sensitivity with tighter interference control [26] |
| timsTOF with ion mobility | DIA-NN | IM-aware search/alignment | Proper 1/K0 handling and alignment [26] [53] |
| Rapid proof-of-concept, no historical DDA | DIA-NN or Spectronaut | Library-free / predicted | Minimal setup; quick start [26] |
| Ubiquitinome with limited sample | DIA-NN | In-silico or hybrid | Superior sensitivity for low input material [5] |
For research requiring high reproducibility across large sample batches, DIA-NN implements conservative match-between-runs (MBR) controls and robust cross-batch merging algorithms that maintain quantitative consistency [26]. When analyzing data from timsTOF instruments with ion mobility separation, DIA-NN's inherent ion mobility awareness provides more accurate alignment and scoring [26] [53]. Conversely, for projects prioritizing maximum depth and where extensive fractionation for library generation is feasible, Spectronaut's mature directDIA and library-based modes offer polished graphical interfaces with comprehensive quality control reporting [26] [53].
For ubiquitinome studies specifically, where sample amounts are often limiting, DIA-NN's efficient in-silico library usage provides excellent coverage without requiring extensive preliminary experiments. The software's neural network-based approach effectively handles the unique characteristics of diGly-modified peptides, including their longer lengths and higher charge states [5]. When applying these tools to biological questions such as TNF-α signaling or circadian regulation, researchers should implement consistent FDR thresholds (1% at peptide and protein levels), parsimonious protein grouping policies, and conservative imputation strategies to ensure reproducible and biologically meaningful results [26] [5].
Critical Implementation Considerations to Minimize Errors
Quality Control and Validation
Implementing rigorous quality control measures is essential for minimizing interpretation errors in DIA ubiquitinome analysis. The following parameters should be monitored throughout the analytical process:
- Library Quality: Assess library comprehensiveness and specificity for diGly peptides. Libraries should contain >90,000 diGly peptides for deep ubiquitinome coverage [5].
- Identification Metrics: Monitor peptide and protein FDR at 1% threshold, peptide-to-protein ratios, and coefficients of variation in quality control pools [26] [53].
- Quantitative Accuracy: Track median CVs in replicate analyses (target ≤20%), sample-level missingness (≤30%), and retention time alignment residuals [26].
- Ubiquitinome-Specific QC: Verify enrichment efficiency by monitoring tryptic peptide signals and assessing specificity for diGly modifications [5].
Standardized quality control templates, such as those provided in Spectronaut's reporting features or DIA-NN's summary outputs, facilitate consistent evaluation across projects and between laboratories [26]. For ubiquitinome studies specifically, implementing a "triple library" approach—combining libraries from multiple cell lines and conditions—significantly enhances coverage and reduces false negatives [5].
Computational Infrastructure Requirements
Adequate computational resources are essential for efficient DIA data processing. DIA-NN typically requires 16-32 vCPU and 64-128 GB RAM per concurrent job, while Spectronaut benefits from similar resources for optimal performance [26]. Fast local storage (NVMe solid-state drives) dramatically improves processing speed by reducing I/O bottlenecks during feature extraction and scoring phases [26]. For large-scale ubiquitinome studies analyzing hundreds of samples, parallelization strategies that shard processing across multiple compute nodes can reduce turnaround time from weeks to days, enabling more iterative analytical approaches.
By implementing these standardized protocols, selection guidelines, and quality control measures, researchers can significantly reduce software-derived interpretation errors in DIA ubiquitinome analysis, leading to more reproducible and biologically meaningful results in studies of protein ubiquitination across diverse biological systems.
DIA vs. DDA: A Head-to-Head Comparison of Performance, Precision, and Depth
In the field of proteomics, mass spectrometry (MS)-based ubiquitinome analysis provides system-level insights into ubiquitin signaling, which regulates virtually all cellular processes, including protein degradation, signal transduction, and circadian biology [5] [54]. However, the low stoichiometry of ubiquitination and varying ubiquitin-chain topologies have made comprehensive profiling of endogenous ubiquitination particularly challenging [5]. Traditional data-dependent acquisition (DDA) methods have been limited by relatively low identification numbers, missing values across samples, and compromised quantitative accuracy [5] [28].
Data-independent acquisition (DIA) has emerged as a transformative MS technology that combines the broad proteome coverage of DDA with the high reproducibility and quantitative accuracy typically associated with targeted methods [28] [14]. For ubiquitinome analysis specifically, DIA workflows have demonstrated remarkable improvements in sensitivity and data completeness, enabling unprecedented depth in mapping ubiquitination events across biological systems [5] [46]. This application note details how optimized DIA methodologies more than triple ubiquitinated peptide identifications compared to conventional DDA approaches, providing researchers with powerful tools for investigating ubiquitin signaling in health and disease.
Quantitative Performance Benchmarks
Substantial Gains in Ubiquitinated Peptide Identifications
Multiple independent studies have consistently demonstrated that DIA methods significantly outperform DDA in ubiquitinated peptide identification. The table below summarizes key quantitative benchmarks from recent implementations:
Table 1: Performance Comparison of DIA vs. DDA for Ubiquitinome Analysis
| Study Reference | Sample System | DDA Identifications | DIA Identifications | Fold Improvement | Quantitative Precision (Median CV) |
|---|---|---|---|---|---|
| Hansen et al. [5] | HEK293 cells (MG132-treated) | ~20,000 diGly peptides | ~35,000 diGly peptides | 1.75x | <20% CV for 45% of peptides |
| Sader et al. [46] | HCT116 cells | 21,434 K-GG peptides | 68,429 K-GG peptides | 3.2x | ~10% median CV |
| Sader et al. [46] | Jurkat cells (2mg protein input) | Not reported | ~30,000 K-GG peptides | N/A | Excellent reproducibility |
The performance advantage of DIA extends beyond identification numbers to quantitative precision. In the benchmark study by Hansen et al., DIA demonstrated significantly better coefficients of variation (CVs), with 45% of diGly peptides showing CVs below 20% compared to only 15% with DDA [5]. Similarly, Sader et al. reported a remarkable median CV of approximately 10% for all quantified K-GG peptides using their optimized DIA workflow [46].
Optimization Strategies for Enhanced Performance
Several methodological optimizations have been identified as critical for maximizing DIA performance in ubiquitinome studies:
Spectral Libraries: Comprehensive spectral libraries containing >90,000 diGly peptides enable identification of approximately 35,000 distinct diGly peptides in single measurements [5]. Library-free analysis using advanced computational tools like DIA-NN also achieves high performance, identifying >68,000 ubiquitinated peptides in single runs [46].
MS Acquisition Parameters: Optimized DIA methods with 46 precursor isolation windows and high MS2 resolution (30,000) improve identifications by 13% compared to standard full proteome methods [5]. Variable window schemes that use narrower isolation windows in high-density m/z regions further enhance selectivity [55].
Sample Preparation: Sodium deoxycholate (SDC)-based lysis with chloroacetamide (CAA) alkylation increases ubiquitin site coverage by 38% compared to conventional urea-based protocols while maintaining enrichment specificity [46]. Optimal peptide input (1mg) with 31.25μg anti-diGly antibody balances yield and coverage [5].
Experimental Protocols for DIA Ubiquitinome Analysis
Sample Preparation Protocol
Table 2: Key Research Reagent Solutions for Ubiquitinome Analysis
| Reagent/Resource | Function/Application | Specifications |
|---|---|---|
| Anti-diGly Antibody [5] | Immunoaffinity enrichment of ubiquitin remnant peptides | 31.25μg per 1mg peptide input |
| SDC Lysis Buffer [46] | Protein extraction with protease inactivation | Supplemented with chloroacetamide (CAA) for immediate cysteine protease inhibition |
| Proteasome Inhibitor (MG-132) [5] | Stabilization of ubiquitinated proteins | 10μM treatment for 4 hours |
| Basic Reversed-Phase Chromatography [5] | Peptide fractionation for deep spectral libraries | 96 fractions concatenated into 8 pools |
| K48-linkage Specific Antibody [11] | Selective enrichment of proteasomal degradation signals | Recognizes K48-linked polyUb chains |
Step-by-Step Procedure:
Cell Lysis and Protein Extraction:
- Lyse cells in SDC buffer (1% SDC, 100mM Tris-HCl, pH 8.5) supplemented with 40mM chloroacetamide [46].
- Immediately boil samples at 95°C for 10 minutes to inactivate deubiquitinases.
- Cool to room temperature and reduce with 10mM DTT for 30 minutes.
- Alkylate with additional CAA (final concentration 50mM) for 30 minutes in the dark.
Protein Digestion:
- Digest proteins with trypsin (1:50 enzyme-to-protein ratio) overnight at 37°C.
- Acidify with trifluoroacetic acid (TFA) to precipitate SDC (final pH <3).
- Centrifuge at 10,000 × g for 10 minutes and collect supernatant containing peptides.
diGly Peptide Enrichment:
- Use anti-diGly remnant motif (K-ε-GG) antibody for immunoaffinity purification [5].
- Incubate 1mg of peptide material with 31.25μg antibody for 2 hours at 4°C.
- Wash beads extensively and elute diGly peptides with 0.1% TFA.
Peptide Fractionation (for spectral library generation):
- Separate peptides by basic reversed-phase chromatography into 96 fractions [5].
- Concatenate fractions into 8-12 pools to reduce analysis time.
- Process pools containing abundant K48-linked ubiquitin-chain derived diGly peptides separately to avoid competition during enrichment.
Mass Spectrometry Acquisition Methods
DIA Method Optimization:
Liquid Chromatography:
DIA Acquisition Parameters:
- Set mass range to 400-1,200 m/z for comprehensive precursor coverage [56].
- Implement variable window schemes with 20-46 windows of optimized widths [5] [55].
- Use narrower windows (5-10 Da) in high-density regions (400-800 m/z) and wider windows (15-25 Da) in sparse regions [56].
- Set MS2 resolution to 30,000 for improved identification [5].
- Maintain cycle times of 3-4 seconds to ensure sufficient data points across chromatographic peaks.
Advanced DIA Implementations:
- Consider ZT Scan DIA, which combines continuous quadrupole scanning with Zeno trap technology to enhance sensitivity and specificity [55].
- For high-throughput applications, implement shorter gradients (15-30 minutes) with proportionally adjusted cycle times.
Data Processing and Analysis
Computational Tools for DIA Ubiquitinomics:
Spectral Library Generation:
DIA Data Processing:
- Process data using DIA-NN, which incorporates deep neural networks optimized for modified peptide analysis [46].
- Enable "library-free" mode to search directly against protein sequence databases when project-specific libraries are unavailable.
- Apply stringent false discovery rate (FDR) control at both peptide and protein levels (typically ≤1%).
Quantitative Analysis:
- Use MS2-level quantification for improved accuracy and dynamic range [55].
- Normalize data using total peptide amount or reference peptides.
- Apply statistical filters to retain only robustly quantified peptides (present in ≥70% of samples per group).
Signaling Pathways and Biological Applications
The Ubiquitin Signaling Cascade
The ubiquitination process involves a sequential enzymatic cascade that represents potential therapeutic intervention points. The following diagram illustrates key components and their relationships:
Ubiquitin-Proteasome System Cascade: This diagram illustrates the sequential enzymatic reactions of ubiquitination and the key players that determine protein fate.
DIA Ubiquitinomics Workflow
The complete experimental workflow for DIA-based ubiquitinome analysis integrates optimized sample preparation, mass spectrometry, and computational analysis:
DIA Ubiquitinomics Workflow: This end-to-end protocol illustrates the integrated steps from sample preparation to biological interpretation.
Applications in Drug Discovery and Systems Biology
The dramatically improved depth and quantitative precision of DIA ubiquitinomics enables several advanced applications:
Target Deconvolution for DUB Inhibitors:
- DIA enables time-resolved ubiquitinome profiling following USP7 inhibition, simultaneously tracking ubiquitination changes and consequent protein abundance alterations for >8,000 proteins [46].
- This approach distinguishes degradative ubiquitination (primarily K48-linked) from regulatory ubiquitination events, providing mechanistic insights into drug action.
Circadian Biology:
- DIA ubiquitinome analysis across circadian cycles has uncovered hundreds of cycling ubiquitination sites and ubiquitin clusters within membrane protein receptors and transporters [5].
- These findings highlight novel connections between ubiquitin signaling, metabolism, and circadian regulation.
Oncology and Targeted Protein Degradation:
- Comprehensive ubiquitinome profiling aids in understanding the mechanism of action for PROTACs (proteolysis-targeting chimeras) and molecular glues [54] [57].
- DIA facilitates monitoring of on-target engagement and identification of off-target effects for ubiquitin system-targeting therapeutics.
The quantitative benchmarking data presented herein unequivocally demonstrates that DIA methodologies more than triple ubiquitinated peptide identifications compared to conventional DDA approaches while simultaneously improving quantitative precision and data completeness. Through optimized sample preparation protocols incorporating SDC-based lysis and chloroacetamide alkylation, combined with advanced DIA acquisition strategies and neural network-based data processing, researchers can now routinely identify >65,000 ubiquitination sites in single LC-MS runs.
These technological advances position DIA as the method of choice for ubiquitinome analysis in both basic research and drug discovery applications. The ability to comprehensively capture ubiquitination dynamics at systems level provides unprecedented opportunities to understand ubiquitin signaling in physiology and disease, and to develop more targeted therapeutic interventions for cancer, neurodegenerative disorders, and other conditions linked to ubiquitin pathway dysregulation.
In the field of ubiquitinome research, achieving high data completeness and reproducible quantification has been a persistent challenge. Data-independent acquisition (DIA) mass spectrometry has emerged as a transformative solution, offering marked improvements over traditional data-dependent acquisition (DDA) methods. This application note details how an optimized DIA workflow for ubiquitinome analysis enables the identification of over 35,000 distinct diGly peptides in single measurements while significantly reducing coefficients of variation (CVs), thereby providing unprecedented reproducibility and depth for studying ubiquitin signaling in biological systems and drug development contexts [5].
Quantitative Superiority of DIA for Ubiquitinome Analysis
Performance Comparison: DIA vs. DDA
The implementation of a DIA-based diGly proteomics workflow demonstrates clear and substantial advantages over traditional DDA methods in key performance metrics, as quantified in systematic evaluations [5].
Table 1: Comparative Performance of DIA versus DDA for Ubiquitinome Analysis
| Performance Metric | DIA Performance | DDA Performance | Improvement Factor |
|---|---|---|---|
| Distinct diGly Peptides (single measurement) | 35,111 ± 682 | ~20,000 | ~1.75x |
| Peptides with CV < 20% | 45% | 15% | 3x |
| Peptides with CV < 50% | 77% | Not reported | Significant |
| Total Distinct Peptides (6 replicates) | ~48,000 | ~24,000 | 2x |
| Quantitative Accuracy | High | Lower | Markedly improved |
Key Implications for Research
The data presented in Table 1 illustrates that DIA doubles identification capabilities while dramatically improving quantitative precision. The three-fold increase in peptides with low CV (<20%) underscores the enhanced reproducibility critical for detecting subtle biological changes in ubiquitination across experimental conditions [5]. This technical advancement enables researchers to study ubiquitin signaling with a reliability previously unattainable with DDA methods.
Experimental Protocol for DIA-Based Ubiquitinome Analysis
Sample Preparation and Peptide Fractionation
- Cell Culture and Treatment: Culture HEK293 or U2OS cells. Treat with 10 µM MG132 proteasome inhibitor for 4 hours to enrich ubiquitinated proteins [5].
- Protein Extraction and Digestion: Lyse cells using appropriate buffers. Digest extracted proteins using trypsin to generate peptides bearing the characteristic diGly remnant after ubiquitination [5].
- High-pH Reversed-Phase Fractionation: Separate peptides using basic reversed-phase (bRP) chromatography into 96 fractions. Concatenate these into 8 pooled fractions to reduce complexity.
- K48-peptide Separation: Isolate fractions containing highly abundant K48-linked ubiquitin-chain derived diGly peptides and process them separately to prevent competition during antibody enrichment [5].
diGly Peptide Enrichment
- Antibody-based Enrichment: Enrich diGly-containing peptides from 1 mg of peptide material using 31.25 µg (1/8 vial) of anti-diGly antibody (PTMScan Ubiquitin Remnant Motif Kit, Cell Signaling Technology) [5].
- Sample Loading: Use only 25% of the total enriched material for mass spectrometry injection, as optimized for DIA sensitivity [5].
Mass Spectrometry Analysis
- DIA Method Parameters:
- Utilize an Orbitrap mass spectrometer for DIA analysis.
- Employ 46 predefined precursor isolation windows with optimized variable widths.
- Set MS2 scan resolution to 30,000.
- Maintain cycle times that adequately sample eluting chromatographic peaks [5].
- Spectral Library Generation:
- Generate comprehensive spectral libraries from deep fractionation of cell lines (HEK293 and U2OS), both treated and untreated with MG132.
- Combine cell line-specific libraries to create a hybrid library containing >90,000 diGly peptides for optimal peptide matching [5].
- Data Acquisition:
- Acquire MS data using the optimized DIA method.
- For single-measurement analysis, match data against the spectral library to identify and quantify diGly peptides.
Data Analysis
- Library Matching: Process raw DIA files using software compatible with spectral libraries (e.g., OpenSWATH, DIA-NN, or Skyline).
- Quantification and Statistical Analysis: Extract quantitative data for all identified diGly peptides. Calculate CVs across replicates to assess reproducibility [5].
Visual Workflow of DIA Ubiquitinome Analysis
The Scientist's Toolkit: Essential Research Reagents
Table 2: Key Research Reagents for DIA Ubiquitinome Analysis
| Reagent/Resource | Function/Application | Specifications/Notes |
|---|---|---|
| Anti-diGly Antibody | Immunoaffinity enrichment of ubiquitinated peptides | PTMScan Ubiquitin Remnant Motif Kit (CST); use 31.25 μg per 1 mg peptide [5] |
| Cell Lines | Biological model for ubiquitinome profiling | HEK293 and U2OS; applicable to various mammalian cell systems [5] |
| Proteasome Inhibitor | Enhances ubiquitinated protein recovery | MG132 (10 μM, 4h treatment) [5] |
| Spectral Library | Peptide identification from DIA data | Custom-built libraries >90,000 diGly peptides; hybrid approach recommended [5] |
| Orbitrap Mass Spectrometer | High-resolution DIA data acquisition | Optimized for 46-window DIA with 30,000 MS2 resolution [5] |
| Data Analysis Software | DIA data processing and quantification | Tools such as DIA-NN, OpenSWATH, Skyline [14] |
Application in Targeted Protein Degradation
The optimized DIA ubiquitinome workflow has significant applications in drug development, particularly in the rapidly advancing field of targeted protein degradation (TPD). Recent research demonstrates that this approach can identify over 40,000 diGly precursors corresponding to more than 7,000 proteins in a single measurement from cells exposed to a proteasome inhibitor [19]. This exceptional throughput enables rapid establishment of the mechanism of action for various TPD modalities, including PROTACs and molecular glues, by comprehensively mapping the ubiquitylation landscape on substrate proteins [19].
The implementation of this optimized DIA workflow for ubiquitinome analysis represents a significant advancement in proteomics, delivering on the dual promises of enhanced reproducibility through lower CVs and superior data completeness. By providing detailed methodologies and performance benchmarks, this application note enables researchers to leverage these improvements for more reliable and comprehensive studies of ubiquitin signaling in basic biology and drug development contexts.
Within the broader thesis on the application of data-independent acquisition (DIA) for ubiquitinome analysis, establishing confidence in quantitative accuracy is paramount. DIA mass spectrometry has revolutionized proteomics by systematically fragmenting all peptides within predefined ( m/z ) windows, thereby reducing missing values and improving quantitative reproducibility compared to data-dependent acquisition (DDA) [5] [14]. However, the complex nature of ubiquitinated peptide enrichment and the wide range of endogenous ubiquitination stoichiometries present a significant challenge for quantification.
Spike-in experiments using synthetic heavy-labeled ubiquitinated peptides provide a robust, internal methodological control to directly validate the dynamic range and quantitative accuracy of DIA ubiquitinome workflows. This protocol details the application of such spike-in experiments, building upon demonstrated best practices in the field [46]. By leveraging these controlled additions, researchers can empirically determine the lower limits of quantification, assess linearity over orders of magnitude, and ultimately generate high-confidence quantitative data on ubiquitination dynamics in biological systems.
Experimental Protocol: DIA Ubiquitinome Analysis with Synthetic Peptide Spike-Ins
Sample Preparation and Lysis
- Cell Lysis: Lyse cells or homogenize tissues using a Sodium Deoxycholate (SDC)-based lysis buffer. A recommended formulation is 1% (w/v) SDC in 50 mM Tris-HCl, pH 8.5.
- Cysteine Alkylation: Supplement the lysis buffer with 40 mM Chloroacetamide (CAA) to alkylate cysteine residues. Immediate boiling of samples after lysis inactivates deubiquitinating enzymes (DUBs), preserving the native ubiquitinome [46].
- Protein Quantification: Determine protein concentration using a colorimetric assay (e.g., BCA assay). The recommended starting protein material for a single enrichment is 2 mg [46].
Digestion and DiGly Peptide Enrichment
- Protein Digestion: Digest proteins with trypsin (1:50 w/w enzyme-to-protein ratio) overnight at 37°C.
- Peptide Desalting: Acidify peptides with trifluoroacetic acid (TFA) to a final concentration of 1% to precipitate SDC. Centrifuge to remove precipitate and desalt the supernatant using C18 solid-phase extraction cartridges.
- Spike-In of Synthetic Ubiquitinated Peptides: Critical Step: Reconstitute a synthetic library of heavy-labeled (e.g., ( ^{13}C), ( ^{15}N)-labeled) K-GG remnant peptides in a suitable solvent. Spike this mixture into the digested and desalted peptide sample at this stage, prior to enrichment. The spike-in should cover a wide concentration range (e.g., 3-4 orders of magnitude) relative to the expected endogenous levels [46].
- Immunoaffinity Enrichment: Enrich for diGly-modified peptides using an anti-K-GG antibody resin. For 1-2 mg of peptide input, use 31.25 µg (1/8th of a vial) of antibody conjugated to beads [5]. Perform enrichment with batch binding for 2 hours at 4°C.
- Wash and Elution: Wash beads extensively with ice-cold PBS to remove non-specifically bound peptides. Elute diGly peptides with 0.1-0.2% TFA.
LC-MS/MS Analysis with DIA
- Chromatography: Separate peptides using a reversed-phase nanoLC system with a 75-90 minute analytical gradient.
- Data-Independent Acquisition: Acquire data on an Orbitrap or timsTOF mass spectrometer.
Table 1: Key Parameters for DIA Ubiquitinome Acquisition on Different Platforms.
| Parameter | Orbitrap-Based DIA | timsTOF (diaPASEF) |
|---|---|---|
| MS1 Resolution | 120,000 | Not applicable |
| MS2 Resolution | 30,000 | Not applicable |
| Precursor Isolation | 46 variable windows | Multiple windows across ( m/z ) and ion mobility |
| Collision Energy | Stepped (e.g., 25, 30, 35%) | Ramped based on ion mobility |
| Cycle Time | ~3 seconds | ~1-2 seconds |
Data Processing and Analysis
- Library Generation: Generate a comprehensive spectral library. This can be an empirical library from fractionated DDA runs [5], a predicted in-silico library [51], or a hybrid library combining DDA and directDIA searches [5].
- Spike-In Data Extraction: Process the DIA data using software such as DIA-NN [46] or AlphaDIA [51]. These tools are optimized for modified peptides and should be used to extract the chromatographic peaks and quantify both the endogenous light and the spiked-in heavy synthetic peptides.
- Quantitative Accuracy Assessment:
- For each spiked peptide, plot the observed log2(heavy/light) ratio against the expected log2(heavy/light) ratio, which is determined by the known spiked-in amount.
- Calculate the linear regression (R²) and the slope of this relationship. A slope close to 1 indicates high quantitative accuracy across the dynamic range.
- Determine the Lower Limit of Quantification (LLOQ) as the lowest spike-in concentration where the coefficient of variation (CV) is <20% and accuracy is within ±20% of the expected value.
Results and Data Presentation
The validation data derived from the spike-in experiment should be summarized in a clear table and corresponding diagram to communicate the performance of the workflow.
Table 2: Exemplary Quantitative Data from a Synthetic K-GG Peptide Spike-In Experiment.
| Synthetic Peptide | Spiked Concentration (fmol) | Measured Concentration (fmol) | Accuracy (%) | CV (%) (n=3) |
|---|---|---|---|---|
| KGGPeptide_1 | 10.00 | 9.87 | 98.7 | 4.5 |
| KGGPeptide_1 | 1.00 | 1.05 | 105.0 | 8.1 |
| KGGPeptide_1 | 0.10 | 0.11 | 110.0 | 15.3 |
| KGGPeptide_2 | 10.00 | 9.45 | 94.5 | 5.2 |
| KGGPeptide_2 | 1.00 | 0.97 | 97.0 | 9.8 |
| KGGPeptide_2 | 0.10 | 0.09 | 90.0 | 18.5 |
| KGGPeptide_3 | 10.00 | 10.30 | 103.0 | 3.9 |
| KGGPeptide_3 | 1.00 | 1.02 | 102.0 | 7.5 |
| KGGPeptide_3 | 0.10 | 0.10 | 100.0 | 12.2 |
Spike-In Validation Workflow
The Scientist's Toolkit: Research Reagent Solutions
Table 3: Essential Materials for DIA Ubiquitinome Analysis with Spike-In Validation.
| Item | Function / Description | Example / Note |
|---|---|---|
| Anti-K-GG Antibody | Immunoaffinity enrichment of ubiquitin-derived diGly peptides. | PTMScan Ubiquitin Remnant Motif Kit (CST) [5] [11]. |
| Synthetic Heavy K-GG Peptides | Internal standards for quantitative accuracy validation. | Custom synthetic library of ( ^{13}C), ( ^{15}N)-labeled K-GG peptides [46]. |
| SDC Lysis Buffer | Efficient protein extraction with rapid DUB inactivation. | 1% SDC, 50 mM Tris-HCl, 40 mM CAA, pH 8.5 [46]. |
| Chloroacetamide (CAA) | Cysteine alkylating agent; avoids di-carbamidomethylation artifact. | Preferred over iodoacetamide for ubiquitinomics [46]. |
| DIA Analysis Software | Tools for peptide identification and quantification from DIA data. | DIA-NN [46] or AlphaDIA [51] are optimized for ubiquitinomics. |
Discussion
Integrating spike-in experiments into a DIA ubiquitinome workflow provides a direct and rigorous assessment of quantitative performance, which is critical for reliable biological interpretation. The application of this validated method enables the investigation of complex, time-resolved biological questions, such as mapping the substrates of deubiquitinases (DUBs) like USP7 [46] or analyzing ubiquitination dynamics across the circadian cycle [5]. In such studies, the ability to distinguish subtle, yet biologically significant, changes in ubiquitination relies on a workflow whose dynamic range and accuracy have been empirically confirmed.
This protocol, utilizing optimized sample preparation, DIA acquisition, and spike-in validation, allows researchers to simultaneously track ubiquitination changes and protein abundance with high precision, thereby distinguishing degradative from non-degradative ubiquitination signaling events [46]. As DIA methodologies continue to evolve with new instrumentation and deep learning-based data processing [14] [51], the use of internal spike-in standards will remain a cornerstone of method validation, ensuring that the compelling depth of coverage translates into accurate and meaningful biological data.
This application note details how Data-Independent Acquisition (DIA) mass spectrometry transforms ubiquitinome analysis by providing unprecedented depth, reproducibility, and quantitative accuracy. We present two case studies demonstrating this power: the first uncovers novel ubiquitination events in the TNF-α signaling pathway, while the second performs proteome-wide target profiling of the deubiquitinase USP7. The documented protocols and reagent solutions provide researchers with a robust framework for implementing DIA ubiquitinomics in drug discovery and signaling pathway analysis.
Protein ubiquitination is a central post-translational modification regulating virtually all cellular processes, including protein degradation, signal transduction, and immune responses. Traditional Data-Dependent Acquisition (DDA) mass spectrometry has enabled ubiquitinome profiling but faces limitations in sensitivity, reproducibility, and quantitative accuracy due to the low stoichiometry of ubiquitination and stochastic precursor selection [5].
Data-Independent Acquisition (DIA) mass spectrometry overcomes these limitations by systematically fragmenting all ions within predefined mass-to-charge windows, achieving greater data completeness, superior quantitative precision, and higher identification rates across a wider dynamic range [5] [13]. When applied to ubiquitinome analysis, DIA has demonstrated remarkable improvements, more than tripling ubiquitinated peptide identifications in single MS runs compared to DDA methods [13].
DIA Methodology for Ubiquitinome Analysis
Optimized Sample Preparation Protocol
Cell Lysis and Protein Extraction
- SDC-Based Lysis Buffer: 5% sodium deoxycholate (SDC), 50 mM Tris-HCl (pH 8.5), supplemented with 10-40 mM chloroacetamide (CAA) for immediate cysteine protease inactivation [13].
- Procedure: Immediately boil samples after lysis (95°C, 5 min) with high CAA concentration (40 mM) to rapidly alkylate cysteine residues and inactivate deubiquitinating enzymes (DUBs) [13].
- Advantage: SDC lysis yields 38% more ubiquitinated peptides compared to conventional urea buffer (26,756 vs. 19,403 peptides) with improved enrichment specificity [13].
Protein Digestion and Peptide Cleanup
- Digestion: Trypsin at 1:50 enzyme-to-protein ratio, overnight digestion at 37°C.
- Reduction and Alkylation: 5 mM dithiothreitol (30 min, 56°C) followed by 11 mM iodoacetamide (15 min, room temperature in darkness) [58].
- Desalting: Strata X solid-phase extraction (SPE) columns or C18 ZipTips [58].
diGly Peptide Enrichment
- Antibody: Anti-K-ε-GG ubiquitin remnant motif antibody (PTMScan Ubiquitin Remnant Motif Kit) [5].
- Immunoaffinity Purification: Resuspend peptides in IP buffer (100 mM NaCl, 1 mM EDTA, 50 mM Tris-HCl, 0.5% NP-40, pH 8.0). Incubate with pre-washed antibody-conjugated resin for 2 hours at 4°C [58].
- Washing: Four washes with IP buffer followed by two washes with deionized water [58].
- Elution: 0.1% trifluoroacetic acid, three elutions [58].
- Optimal Input: 1 mg peptide material using 31.25 μg anti-diGly antibody [5].
DIA Mass Spectrometry Configuration
Liquid Chromatography
- System: Vanquish Neo UHPLC system [58].
- Mobile Phases: A: 0.1% formic acid in water; B: 0.1% formic acid in 80% acetonitrile [58].
- Gradient: 4-8% B (0-0.5 min), 8-22.5% B (0.6-13.6 min), 22.5-35% B (13.6-20.5 min), 35-55% B (20.5-20.9 min), 55-99% B (20.9-21.4 min), 99% B (21.4-22.6 min) [58].
- Flow Rate: 400 nL/min [58].
Mass Spectrometry
- Ionization: NSI ion source, 1900V voltage [58].
- DIA Method: 46 variable windows covering 380-980 m/z range, optimized for diGly peptide characteristics [5].
- MS1 Resolution: 240,000 [58].
- MS2 Resolution: 30,000 [5].
- Fragmentation: Higher-energy collisional dissociation (HCD) [5].
Data Processing
- Software: DIA-NN with specialized scoring module for modified peptides [13].
- Library Approach: Library-free mode (search against sequence database) or using comprehensive spectral libraries [13].
- False Discovery Rate: <1% at both peptide and protein levels [13].
The following diagram illustrates the complete DIA ubiquitinome analysis workflow:
Performance Benchmarking
Table 1: Quantitative Performance Comparison of DIA vs. DDA for Ubiquitinome Analysis
| Parameter | DDA | DIA | Improvement |
|---|---|---|---|
| diGly Peptides (Single Run) | 21,434 [13] | 68,429 [13] | 319% |
| Quantitative Precision (Median CV) | >20% [5] | ~10% [13] | 50% improvement |
| Data Completeness | ~50% without missing values [13] | 68,057 peptides in ≥3 replicates [13] | Significant improvement |
| Spectral Libraries | Not required for identification | 89,650 diGly sites from multi-library approach [5] | Enhanced coverage |
Case Study 1: Uncovering Novel Biology in TNF-α Signaling
Experimental Design
Cell Model and Treatment
- Cell Line: HEK293 and U2OS cells [5].
- Stimulation: TNF-α treatment for various durations (0-120 min) to activate NF-κB signaling pathway.
- Inhibitors: Proteasome inhibition (10 μM MG132, 4h) to stabilize ubiquitinated proteins [5].
Ubiquitinome Analysis
- Sample Processing: Followed optimized protocol described in Section 2.1.
- DIA Analysis: Single-shot measurements using optimized 46-window method [5].
- Validation: Integration with proteome data to distinguish regulatory from non-degradative ubiquitination.
Key Findings: Novel Regulatory Mechanisms
The DIA ubiquitinome analysis comprehensively captured known ubiquitination sites in the TNF-α signaling pathway while adding many novel sites [5]. The depth of coverage enabled identification of previously unrecognized regulatory mechanisms:
MARCH2-Mediated Inflammation Control
- E3 Ligase Discovery: MARCH2 was identified as a critical regulator of TNF-α-mediated inflammation [59].
- Autoregulatory Mechanism: TNF-α stimulation induces MARCH2 dimerization and K63-linked autoubiquitination at lysine residues 127 and 238 [59].
- Downstream Effect: Autoubiquitinated MARCH2 promotes NEMO recognition, ubiquitination, and proteasomal degradation, attenuating NF-κB signaling [59].
- Physiological Relevance: MARCH2-deficient mice showed heightened susceptibility to DSS-induced colitis with severe epithelial disruption, immune cell infiltration, and 100% mortality by day 11 [59].
Novel Ubiquitination Events
- The comprehensive analysis identified hundreds of previously unreported ubiquitination sites on components of the NF-κB pathway and associated regulatory proteins [5].
- Many identified sites represented potential points of crosstalk with other post-translational modifications, with 7.3% of diGly sites previously known to be acetylated or methylated [5].
The following diagram illustrates the MARCH2 regulatory mechanism in TNF-α signaling:
Case Study 2: Proteome-Wide Target Profiling of USP7 Inhibition
Experimental Design
USP7 Inhibition Model
- Biological Context: USP7 (ubiquitin-specific protease 7) is a deubiquitinating enzyme regulating oncogenic and tumor suppressor proteins including MDM2, p53, and PTEN [60].
- Inhibitor Treatment: Selective USP7 inhibitors applied to HCT116 cells [13].
- Time-Course Analysis: High-temporal resolution sampling (minutes to hours) to capture rapid ubiquitination dynamics [13].
Multi-Omics Profiling
- Parallel Measurements: Simultaneous quantification of ubiquitination changes and protein abundance alterations [13].
- Scale: >8,000 proteins monitored for abundance changes alongside ubiquitinome profiling [13].
Key Findings: Dissecting USP7 Function
Immediate Substrate Identification
- Rapid Response: Hundreds of proteins showed increased ubiquitination within minutes of USP7 inhibition, representing direct and proximal targets [13].
- Proteome Stability: Despite widespread ubiquitination changes, only a small fraction of targets underwent degradation, distinguishing degradative from regulatory ubiquitination events [13].
Systems-Level Insights
- Pathway Analysis: USP7 substrates spanned multiple cellular processes including DNA repair, epigenetic regulation, and immune response [60].
- Therapeutic Implications: The comprehensive mapping enables better understanding of USP7 inhibitor mechanisms in oncology contexts [13] [60].
Table 2: Temporal Ubiquitinome Profiling After USP7 Inhibition
| Time Point | Proteins with Increased Ubiquitination | Proteins Undergoing Degradation | Functional Categories |
|---|---|---|---|
| Early (Minutes) | Hundreds | Minimal | Signaling regulators, DUB substrates |
| Intermediate (Hours) | Sustained increase | Small subset | Transcription factors, Cell cycle regulators |
| Late (Hours-Days) | Secondary effects | Additional proteins | Apoptotic regulators, Metabolic enzymes |
The Scientist's Toolkit: Essential Research Reagents
Table 3: Key Research Reagents for DIA Ubiquitinome Analysis
| Reagent/Resource | Specification | Application | Key Benefit |
|---|---|---|---|
| Anti-K-ε-GG Antibody | PTMScan Ubiquitin Remnant Motif Kit [5] | diGly peptide enrichment | High specificity for ubiquitin-derived remnants |
| SDC Lysis Buffer | 5% sodium deoxycholate, 50 mM Tris-HCl, 40 mM CAA [13] | Protein extraction | 38% more ubiquitinated peptides vs. urea buffer |
| Chloroacetamide (CAA) | 40 mM in lysis buffer [13] | Cysteine alkylation | Prevents di-carbamidomethylation artifacts |
| Proteasome Inhibitor | MG-132 (10 μM, 4h) [5] | Signal enhancement | Stabilizes ubiquitinated proteins |
| DIA-NN Software | With ubiquitinomics optimization [13] | Data processing | Specialized scoring for modified peptides |
| Spectral Libraries | >90,000 diGly peptides [5] | Peptide identification | Enhanced coverage and quantification accuracy |
The implementation of DIA mass spectrometry for ubiquitinome analysis represents a transformative advancement in proteomics, enabling unprecedented depth and precision in mapping ubiquitination dynamics. The case studies presented demonstrate how this approach reveals novel biology in signaling pathways and drug target engagement, providing researchers with powerful insights for therapeutic development.
The optimized protocols and reagent solutions detailed herein offer a robust foundation for implementing DIA ubiquitinomics in diverse research contexts, from basic mechanism discovery to preclinical drug development. As the methodology continues to evolve, its application will undoubtedly uncover further complexity in ubiquitin signaling and enable more targeted therapeutic interventions.
Conclusion
DIA mass spectrometry has firmly established itself as the leading method for ubiquitinome analysis, offering a powerful combination of deep coverage, high quantitative precision, and exceptional reproducibility. The optimized workflows and troubleshooting strategies discussed provide a reliable roadmap for researchers to implement this technology successfully. By enabling the simultaneous monitoring of ubiquitination dynamics and protein abundance, DIA unlocks the ability to distinguish degradative from non-degradative ubiquitin signaling—a critical insight for understanding cellular regulation. As software tools like DIA-NN and AlphaDIA continue to evolve with deep learning capabilities, the future of DIA ubiquitinomics points toward even greater depth, the routine analysis of arbitrary post-translational modifications, and accelerated discovery in drug development, particularly for targeted protein degradation therapies. This methodology is set to become a cornerstone for unraveling complex biological systems and developing novel therapeutic strategies.
References
- 1. Drug Development Targeting the Ubiquitin–Proteasome ... [https://pmc.ncbi.nlm.nih.gov/articles/PMC7226376/]
- 2. Ubiquitin/Proteasome [https://www.cellsignal.com/pathways/ubiquitin-proteasome-pathway?srsltid=AfmBOooYh0Cj23P1oaUmjMQ7kYirrN7ACoD5wD0khLMkjKb_b--jot7Z]
- 3. Regulation of Signaling by Non-degradative Ubiquitination [https://pmc.ncbi.nlm.nih.gov/articles/PMC2659175/]
- 4. Targeted protein degradation: mechanisms, strategies and ... [https://www.nature.com/articles/s41392-022-00966-4]
- 5. Data-independent acquisition method for ubiquitinome ... [https://www.nature.com/articles/s41467-020-20509-1]
- 6. Defining roles of PARKIN and ubiquitin phosphorylation by ... [https://pmc.ncbi.nlm.nih.gov/articles/PMC4450373/]
- 7. Dynamics of PARKIN-Dependent Mitochondrial ... [https://www.sciencedirect.com/science/article/pii/S1097276518302156]
- 8. The PINK1 kinase-driven ubiquitin ligase Parkin promotes ... [https://www.nature.com/articles/s41598-019-47352-9]
- 9. Data-independent acquisition method for ubiquitinome ... [https://pmc.ncbi.nlm.nih.gov/articles/PMC7801436/]
- 10. Analysis of Ubiquitinated Proteome by Quantitative Mass ... [https://pmc.ncbi.nlm.nih.gov/articles/PMC3467951/]
- 11. Current methodologies in protein ubiquitination characterization [https://cellandbioscience.biomedcentral.com/articles/10.1186/s13578-022-00870-y]
- 12. Quantitative Analysis of Ubiquitinated Proteins in Human ... [https://www.frontiersin.org/journals/endocrinology/articles/10.3389/fendo.2019.00328/full]
- 13. Time-resolved in vivo ubiquitinome profiling by DIA-MS ... [https://www.nature.com/articles/s41467-021-25454-1]
- 14. Data-Independent Acquisition: A Milestone and Prospect in ... [https://www.sciencedirect.com/science/article/pii/S1535947624000902]
- 15. Deubiquitinating enzymes and the proteasome regulate ... [https://pmc.ncbi.nlm.nih.gov/articles/PMC9117253/]
- 16. a comparative study of DIA and DDA mass spectrometry [https://www.sciencedirect.com/science/article/pii/S2667145X25000240]
- 17. What's the difference between DIA & DDA proteomics? [https://blog.cellsignal.com/deep-proteome-profiling-with-dia]
- 18. Current methodologies in protein ubiquitination ... [https://pmc.ncbi.nlm.nih.gov/articles/PMC9373315/]
- 19. Data-independent acquisition (DIA) approach for ... [https://sciety-discovery.elifesciences.org/articles/by?article_doi=10.1101/2025.05.27.656291]
- 20. Data-Independent Acquisition: A Milestone and Prospect in ... [https://pmc.ncbi.nlm.nih.gov/articles/PMC11380018/]
- 21. A Comparative Analysis of Data Analysis Tools for Data ... [https://pmc.ncbi.nlm.nih.gov/articles/PMC10458344/]
- 22. Benchmarking of analysis strategies for data-independent ... [https://www.nature.com/articles/s41467-022-30094-0]
- 23. Proteomics / Statistical analysis of DIA data / Hands-on [https://training.galaxyproject.org/training-material/topics/proteomics/tutorials/DIA_Analysis_MSstats/tutorial.html]
- 24. Activating the NFE2L1-ubiquitin-proteasome system by ... [https://www.nature.com/articles/s41418-024-01398-z]
- 25. Systematic Evaluation of Protein Reduction and Alkylation ... [https://pmc.ncbi.nlm.nih.gov/articles/PMC5500753/]
- 26. DIA-NN, Spectronaut, FragPipe [https://www.creative-proteomics.com/ngpro/resource-dia-proteomics-software-comparison-diann-spectronaut-fragpipe.html]
- 27. Ubiquitin diGLY proteomics as an approach to identify and ... [https://pmc.ncbi.nlm.nih.gov/articles/PMC6791129/]
- 28. Data-independent acquisition (DIA) [https://pmc.ncbi.nlm.nih.gov/articles/PMC8674493/]
- 29. ProteomeXchange Dataset PXD019854-2 [https://proteomecentral.proteomexchange.org/cgi/GetDataset?ID=PXD019854-2&test=no]
- 30. Time-resolved in vivo ubiquitinome profiling by DIA -MS reveals... [https://www.nature.com/articles/s41467-021-25454-1?error=cookies_not_supported&code=636437d9-8baa-4ed3-a190-62aa3bba229c]
- 31. -MS DIA Services - Creative Proteomics Ubiquitinome Analysis [https://www.creative-proteomics.com/ngpro/dia-ms-ubiquitinome-analysis-services.html]
- 32. Use of a High-Affinity Ubiquitin-Binding Domain to Detect and Purify... [https://bio-protocol.org/en/bpdetail?id=5426&type=0]
- 33. Data-Dependent Acquisition with Precursor Coisolation ... [https://pmc.ncbi.nlm.nih.gov/articles/PMC10529037/]
- 34. GitHub - vdemichev/DiaNN: DIA -NN - a universal automated software... [https://github.com/vdemichev/DiaNN]
- 35. AUTO-SP: automated sample preparation for analyzing ... [https://pmc.ncbi.nlm.nih.gov/articles/PMC12355475/]
- 36. Integrative proximal-ubiquitomics profiling for ... [https://www.sciencedirect.com/science/article/pii/S2451945625001278]
- 37. DIA-NN: neural networks and interference correction ... [https://www.nature.com/articles/s41592-019-0638-x]
- 38. DIA-NN: Neural networks and interference correction ... [https://pmc.ncbi.nlm.nih.gov/articles/PMC6949130/]
- 39. Comprehensive ubiquitome analysis reveals persistent ... [https://link.springer.com/article/10.1007/s00204-025-04006-2]
- 40. Data-independent acquisition method for ubiquitinome ... [https://pubmed.ncbi.nlm.nih.gov/33431886/]
- 41. Avoiding Failure in DIA Proteomics: Common Pitfalls and ... [https://www.creative-proteomics.com/ngpro/resource-dia-proteomics-failure-pitfalls-fixes.html]
- 42. Detection of Protein Ubiquitination Sites by Peptide ... [https://www.jove.com/t/59079/detection-protein-ubiquitination-sites-peptide-enrichment-mass]
- 43. Methods for Quantification of in vivo Changes in Protein ... [https://www.sciencedirect.com/science/article/pii/S1535947620304576]
- 44. SWATH Acquisition [https://sciex.com/technology/swath-acquisition]
- 45. Data‐independent acquisition‐based SWATH‐MS for ... [https://pmc.ncbi.nlm.nih.gov/articles/PMC6088389/]
- 46. Time-resolved in vivo ubiquitinome profiling by DIA-MS ... [https://pmc.ncbi.nlm.nih.gov/articles/PMC8438043/]
- 47. Improving Proteomic Identification Using Narrow Isolation ... [https://pubmed.ncbi.nlm.nih.gov/38978496/]
- 48. Robust optimization of SWATH-MS workflow for human blood ... [https://clinicalproteomicsjournal.biomedcentral.com/articles/10.1186/s12014-021-09323-z/tables/1]
- 49. Acquisition and Analysis of DIA-Based Proteomic Data [https://www.sciencedirect.com/science/article/pii/S1535947624000021]
- 50. Analysis of DIA proteomics data using MSFragger-DIA and ... [https://www.nature.com/articles/s41467-023-39869-5]
- 51. AlphaDIA enables DIA transfer learning for feature-free ... [https://www.nature.com/articles/s41587-025-02791-w]
- 52. Evaluation of DDA Library-Free Strategies for ... [https://www.semanticscholar.org/paper/Evaluation-of-DDA-Library-Free-Strategies-for-and-Wen-Wu/07fa0cb1623c200dcdae3aa1c61c76df3f0f76f4]
- 53. Benchmarking commonly used software suites and ... [https://www.nature.com/articles/s41467-022-35740-1]
- 54. exploring the ubiquitin system for drug development [https://www.nature.com/articles/cr201631]
- 55. Introducing ZT Scan DIA for quantitative proteomics [https://sciex.com/technology/zt-scan-dia/continuing-the-data-independent-acquisition-revolution-introducing-zt-scan-dia-for-quantitative-proteomics]
- 56. Application of Quantitative Analysis of the Brain Proteome [https://www.frontiersin.org/journals/molecular-neuroscience/articles/10.3389/fnmol.2020.564446/full]
- 57. Emerging drug development technologies targeting ... [https://pmc.ncbi.nlm.nih.gov/articles/PMC7112620/]
- 58. Insights into the protein ubiquitinome in the host‒pathogen ... [https://pmc.ncbi.nlm.nih.gov/articles/PMC12417728/]
- 59. The E3 ubiquitin ligase MARCH2 controls TNF-α mediated ... [https://biosignaling.biomedcentral.com/articles/10.1186/s12964-025-02260-6]
- 60. USP7 at the Crossroads of Ubiquitin Signaling, Cell Cycle ... [https://pmc.ncbi.nlm.nih.gov/articles/PMC12566277/]