DIA vs DDA Mass Spectrometry: A Comprehensive Guide for Advanced Ubiquitinome Analysis
This article provides a detailed comparison of Data-Independent Acquisition (DIA) and Data-Dependent Acquisition (DDA) mass spectrometry for ubiquitinome analysis, tailored for researchers and drug development professionals.
DIA vs DDA Mass Spectrometry: A Comprehensive Guide for Advanced Ubiquitinome Analysis
Abstract
This article provides a detailed comparison of Data-Independent Acquisition (DIA) and Data-Dependent Acquisition (DDA) mass spectrometry for ubiquitinome analysis, tailored for researchers and drug development professionals. It covers foundational principles, leveraging recent studies that demonstrate DIA's superior performance in ubiquitinome coverage, quantification accuracy, and reproducibility. The content explores methodological workflows for profiling ubiquitin signaling, troubleshooting for complex data analysis, and validation data from benchmark studies. By synthesizing the latest research, this guide serves as a critical resource for selecting and optimizing mass spectrometry methods to uncover novel ubiquitin-related biology and drug targets.
Ubiquitinome Fundamentals: Why Mass Spectrometry Revolutionized Ubiquitin Signaling Research
The Ubiquitin-Proteasome System (UPS) is the primary, selective intracellular protein degradation pathway in eukaryotic cells, responsible for the controlled elimination of damaged, misfolded, or short-lived regulatory proteins [1]. This system is integral to virtually all aspects of cell function, including cell cycle progression, signal transduction, gene expression, and immune responses [1] [2]. The UPS operates through a coordinated two-step process: first, target proteins are tagged with a ubiquitin chain through an enzymatic cascade; second, these tagged proteins are recognized and degraded by the proteasome, a large multi-subunit protease complex [1]. The critical importance of the UPS is particularly visible in immune cells, which undergo rapid and profound functional remodeling upon pathogen recognition, a process tightly regulated by ubiquitin signaling [1]. Dysregulation of the UPS is implicated in the pathogenesis of numerous diseases, including cancer, neurodegenerative disorders, and inflammatory diseases, making it a focal point for therapeutic development [3] [2].
The Ubiquitin–Proteasome System: Components and Mechanisms
The Ubiquitin Conjugation Cascade
Protein ubiquitination is mediated by a sequential enzyme cascade that transfers the 76-amino-acid ubiquitin polypeptide to specific protein substrates [1] [4].
- E1 (Ubiquitin-Activating Enzyme): This initial enzyme activates ubiquitin in an ATP-dependent reaction, forming a high-energy thioester bond [1].
- E2 (Ubiquitin-Conjugating Enzyme): The activated ubiquitin is then transferred to the catalytic cysteine residue of an E2 enzyme [1].
- E3 (Ubiquitin Ligase): Finally, an E3 enzyme facilitates the transfer of ubiquitin from the E2 to a lysine residue on the target protein, forming an isopeptide bond [1]. The human genome encodes approximately 500-1000 E3 ligases, which provide the system with its remarkable substrate specificity [1].
This process can be repeated to form polyubiquitin chains, where additional ubiquitin molecules are attached to one of the eight potential ubiquitination sites (M1, K6, K11, K27, K29, K33, K48, and K63) on the previously attached ubiquitin molecule [1]. The topology of these chains determines the fate of the modified protein. For instance, K48-linked polyubiquitin chains represent the canonical signal for proteasomal degradation, while K63-linked chains are primarily involved in non-proteolytic processes such as DNA repair, kinase activation, and protein trafficking [1] [4].
The Proteasome: The Proteolytic Machinery
Proteins marked with K48-linked polyubiquitin chains are typically degraded by the 26S proteasome, a 2.5 MDa complex consisting of two main sub-complexes [1]:
- 20S Core Particle (CP): This barrel-shaped structure contains the proteolytic active sites within its inner chamber. It is composed of four stacked heptameric rings (α7β7β7α7) [1].
- 19S Regulatory Particle (RP): This cap structure recognizes ubiquitinated proteins, deubiquitinates them, and unfolds them before translocation into the 20S core for degradation [1].
The catalytic activity of the 20S core particle is ensured by three subunits (β1, β2, and β5) which exhibit caspase-, trypsin-, and chymotrypsin-like activities, respectively [1]. Under certain conditions, such as immune activation, alternative catalytic subunits (β1i, β2i, and β5i) can assemble into immunoproteasomes, which exhibit higher proteolytic activity and are particularly important for antigen processing [1]. Further complexity arises from alternative regulatory particles, including the 11S complex (PA28αβ), which can activate the proteasome and enhance peptide hydrolysis [1].
Figure 1: The Ubiquitin-Proteasome System Pathway. This diagram illustrates the sequential process of ubiquitin conjugation followed by proteasomal recognition and degradation.
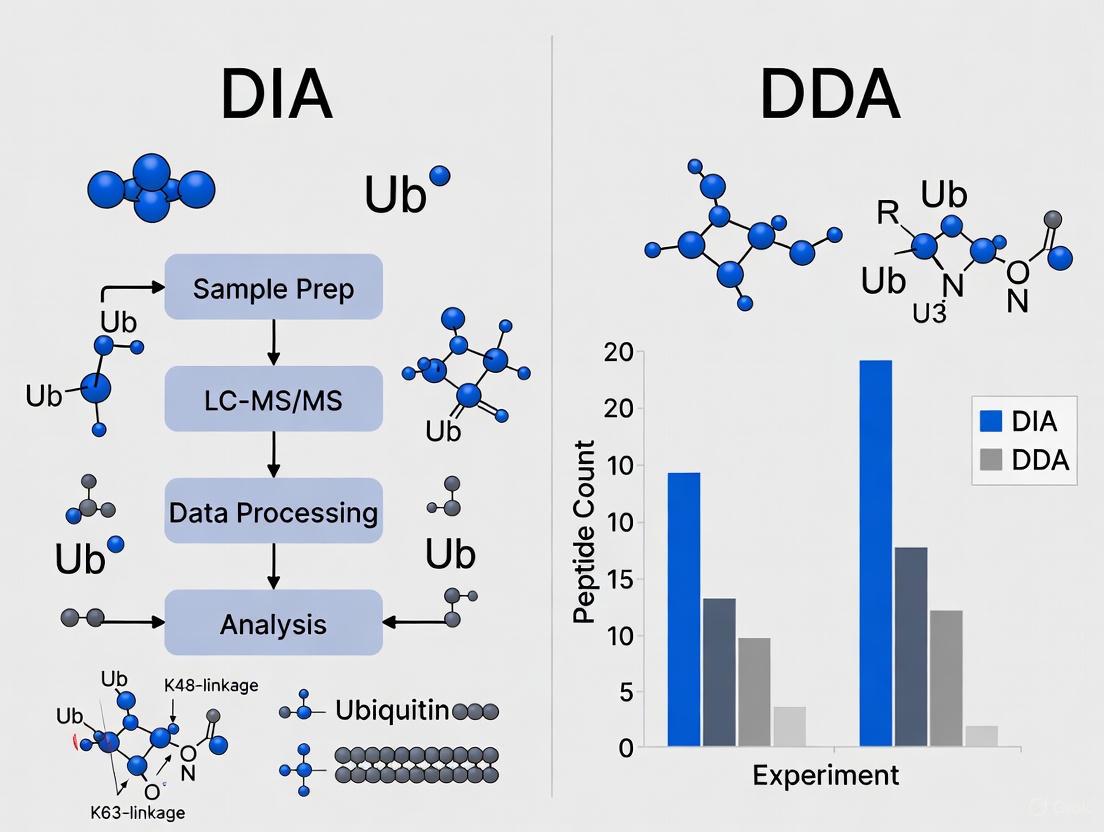
Analytical Approaches: DIA vs. DDA Mass Spectrometry for Ubiquitinome Analysis
The comprehensive study of protein ubiquitination, known as ubiquitinome analysis, presents significant challenges due to the low stoichiometry of ubiquitination, varying chain topologies, and dynamic nature of this modification [5]. Mass spectrometry (MS)-based proteomics has become the primary technology for global ubiquitin signaling profiling, with two prominent acquisition strategies emerging: Data-Dependent Acquisition (DDA) and Data-Independent Acquisition (DIA) [6].
Fundamental Technical Differences
The core difference between DDA and DIA lies in how they select peptides for fragmentation [7] [6]:
Data-Dependent Acquisition (DDA): This traditional method alternates between a full-range survey scan (MS1) and a series of narrow-range fragmentation scans (MS2). The instrument selects only the most abundant co-eluting peptides for fragmentation in real-time, based on signal intensity. This intensity-based selection provides pure fragmentation spectra but comes at the cost of incomplete sampling, particularly for lower-abundance peptides [7] [6].
Data-InDependent Acquisition (DIA): This method also begins with a full-range survey scan but then uses wider isolation windows to systematically fragment all detectable peptides within predefined mass-to-charge (m/z) ranges. Rather than selectively analyzing intense peaks, DIA fragments and acquires data for all ions simultaneously, generating highly complex, chimeric fragmentation spectra that contain multiple peptides [7] [6]. This comprehensive approach requires sophisticated computational algorithms for deconvolution but provides more complete data acquisition.
Performance Comparison in Ubiquitinome Analysis
Recent advancements in DIA methodology have demonstrated significant improvements for ubiquitinome analysis compared to traditional DDA approaches. The table below summarizes key performance metrics based on recent experimental studies:
Table 1: Performance Comparison of DIA vs. DDA in Ubiquitinome Analysis
| Performance Metric | Data-Dependent Acquisition (DDA) | Data-Independent Acquisition (DIA) | Experimental Context |
|---|---|---|---|
| Identified Ubiquitinated Peptides | ~21,434 peptides [8] | ~68,429 peptides [8] | Single MS runs of proteasome inhibitor-treated HCT116 cells [8] |
| Quantitative Reproducibility | ~69% data completeness [6] | ~93% data completeness [6] | Analysis of mouse liver samples (n=3) [6] |
| Quantitative Precision (Median CV) | Higher variability [5] | ~10% CV [8] | Benchmarking using proteasome inhibitor-treated cells [8] |
| Sensitivity for Low-Abundance Proteins | Limited coverage [7] [6] | 2-fold increase in quantified peptides [6] | Mouse liver tissue analysis [6] |
| Dynamic Range | Limited for low-abundance peptides [7] | Extended by at least an order of magnitude [6] | Analysis of protein abundance distributions [6] |
Experimental Protocols for DIA-Based Ubiquitinome Analysis
Optimized protocols for DIA ubiquitinomics have been developed to maximize coverage, reproducibility, and quantitative accuracy. Key methodological considerations include:
Sample Preparation and Lysis:
- SDC-Based Lysis Buffer: Supplementing sodium deoxycholate (SDC) lysis buffer with chloroacetamide (CAA) and immediate boiling after lysis significantly improves ubiquitin site coverage compared to traditional urea-based buffers. This approach increases K-GG peptide identifications by approximately 38% while maintaining enrichment specificity [8].
- Protein Input: Optimal results typically require 1-2 mg of protein input, with identification numbers dropping significantly below 500 μg inputs [8].
diGly Peptide Enrichment:
- After tryptic digestion, ubiquitinated peptides are enriched using antibodies specific for the diGly remnant left after trypsin cleavage of ubiquitinated proteins [5] [8].
- For proteasome inhibitor-treated samples (e.g., MG132), separating fractions containing the highly abundant K48-linked ubiquitin-chain derived diGly peptide improves enrichment efficiency by reducing competition for antibody binding sites [5].
Mass Spectrometry Acquisition:
- DIA Method Optimization: Tailored DIA methods with 46 precursor isolation windows and high MS2 resolution (30,000) have been shown to improve diGly peptide identifications by 13% compared to standard proteome methods [5].
- Chromatographic Gradients: Both medium-length (75 min) and longer nanoLC gradients have been successfully implemented, with longer gradients typically providing deeper coverage [8].
Data Analysis:
- Spectral Libraries: Comprehensive spectral libraries containing >90,000 diGly peptides enable identification of approximately 35,000 distinct diGly sites in single measurements [5].
- Advanced Algorithms: Neural network-based software like DIA-NN significantly enhance ubiquitinome coverage and quantitative accuracy, particularly when used in "library-free" mode that searches against sequence databases without experimentally-generated spectral libraries [8].
Figure 2: Optimized DIA Workflow for Ubiquitinome Analysis. This diagram outlines the key steps in a comprehensive DIA-based ubiquitinomics protocol.
Biological Applications: USP7 Target Profiling by DIA Ubiquitinomics
The power of DIA ubiquitinomics is well illustrated by its application to map substrates of the deubiquitinase USP7, an important anticancer drug target [8]. In a landmark study, researchers combined DIA-MS with temporal profiling to simultaneously monitor ubiquitination changes and corresponding protein abundance changes following USP7 inhibition.
Key Experimental Findings
- Comprehensive Substrate Mapping: DIA ubiquitinomics enabled the identification of hundreds of proteins with increased ubiquitination within minutes of USP7 inhibition, providing an unprecedented system-wide view of USP7 function [8].
- Discrimination of Degradative vs. Non-degradative Ubiquitination: By correlating ubiquitination changes with protein abundance changes over time, researchers could distinguish regulatory ubiquitination leading to protein degradation from non-degradative ubiquitination events [8].
- High Temporal Resolution: The method supported rapid mode-of-action profiling of USP7-targeted drugs at high precision and throughput, revealing that only a small fraction of proteins with increased ubiquitination were subsequently degraded [8].
This application demonstrates how DIA ubiquitinomics can provide fundamental biological insights that extend beyond simple cataloging of ubiquitination sites to dynamic functional characterization of ubiquitin signaling pathways.
Table 2: Key Research Reagent Solutions for Ubiquitinome Analysis
| Reagent/Resource | Function | Application Notes |
|---|---|---|
| Anti-diGly Remnant Antibody | Immunoaffinity enrichment of ubiquitinated peptides after tryptic digestion | Commercial kits available (e.g., PTMScan Ubiquitin Remnant Motif Kit); critical for specificity [5] |
| Proteasome Inhibitors (MG132) | Blocks proteasomal degradation, increasing detection of ubiquitinated proteins | Typically used at 10-20 μM for 4-6 hours; significantly boosts ubiquitin signal [5] [8] |
| SDC Lysis Buffer | Protein extraction while preserving ubiquitination | Superior to urea-based buffers for ubiquitinomics; should be supplemented with CAA [8] |
| Chloroacetamide (CAA) | Cysteine alkylation; rapid DUB inhibition | Preferred over iodoacetamide to avoid di-carbamidomethylation artifacts [8] |
| Spectral Libraries | Reference for peptide identification in DIA analysis | Comprehensive libraries (>90,000 diGly peptides) enable deeper coverage [5] |
| DIA Analysis Software (DIA-NN) | Deconvolution and quantification of DIA data | Neural network-based tools significantly improve performance [8] |
The Ubiquitin-Proteasome System represents a fundamental regulatory pathway with broad implications for cellular function and disease pathogenesis. The emergence of Data-Independent Acquisition mass spectrometry has revolutionized the study of ubiquitin signaling, enabling researchers to overcome traditional limitations of data completeness, reproducibility, and sensitivity associated with Data-Dependent Acquisition methods. Through optimized sample preparation protocols, advanced instrumentation, and sophisticated computational algorithms, DIA ubiquitinomics provides unprecedented capabilities for comprehensive, system-wide profiling of ubiquitination dynamics. As this methodology continues to evolve and become more accessible, it promises to accelerate both fundamental understanding of ubiquitin biology and the development of therapeutics targeting the UPS for cancer, neurodegenerative disorders, and other human diseases.
Protein ubiquitination, the process by which a small protein called ubiquitin is covalently attached to substrate proteins, represents one of the most versatile post-translational modifications (PTMs) in eukaryotic cells [9] [10]. This modification exerts control over virtually every cellular process, from protein degradation by the proteasome to modulation of protein-protein interactions, signaling assemblies, and subcellular localization [11] [10]. The versatility of ubiquitin signaling arises from the ability of ubiquitin itself to form polymeric chains through its seven lysine residues and N-terminus, with different chain topologies encoding distinct biological functions [10]. For instance, K48-linked polyubiquitin chains primarily target proteins for proteasomal degradation, while K63-linked chains often serve non-proteolytic roles in signaling and trafficking [11] [10].
Central to profiling the ubiquitinated proteome (ubiquitinome) is a characteristic signature generated during sample preparation for mass spectrometry (MS) analysis. When trypsin digests ubiquitin-modified proteins, it cleaves after arginine and lysine residues but leaves a diagnostic di-glycine (diGLY) remnant attached to the modified lysine ε-amine group on substrate peptides [9] [12]. This signature arises because trypsin cleaves after the C-terminal glycine-76 of ubiquitin, leaving a Gly-Gly motif linked to the substrate lysine. The resulting K-ε-GG peptides serve as detectable surrogates for ubiquitination sites, enabling their enrichment and identification by MS [9]. While similar remnants can theoretically be generated by ubiquitin-like proteins such as NEDD8 and ISG15, studies indicate that approximately 95% of diGLY peptides identified using this approach originate from genuine ubiquitination events [9]. This trypsin-derived diGLY remnant has become the cornerstone of modern ubiquitinomics, enabling systematic, site-specific investigation of ubiquitination across diverse biological systems.
Analytical Foundations: DIA versus DDA Mass Spectrometry
Mass spectrometry-based proteomics employs primarily two data acquisition strategies for ubiquitinome analysis: data-dependent acquisition (DDA) and data-independent acquisition (DIA). These approaches differ fundamentally in how they select ions for fragmentation, with significant implications for depth, reproducibility, and quantitative accuracy in ubiquitinomics.
Data-Dependent Acquisition (DDA), the traditional approach, operates through a cyclic process where the mass spectrometer first performs a full MS1 scan to identify the most abundant precursor ions, then selectively isolates and fragments these top ions for MS2 analysis [7]. This intensity-based selection inherently favors highly abundant peptides, often at the expense of lower-abundance species. In ubiquitinomics, this presents a particular challenge due to the generally low stoichiometry of ubiquitination events [12]. Consequently, DDA analyses typically yield incomplete sampling of the ubiquitinome across replicate runs, with significant missing data and variable identification rates [12] [13].
Data-Independent Acquisition (DIA) represents a paradigm shift by systematically fragmenting all ions within predetermined, sequential m/z windows throughout the chromatographic separation [12] [7]. Instead of selectively targeting specific precursors, DIA collects fragment ion spectra for all eluting peptides simultaneously, creating comprehensive datasets where every detectable analyte is recorded in every run [7]. This acquisition strategy eliminates the stochastic sampling limitation of DDA, resulting in dramatically improved reproducibility, more complete data across sample series, and enhanced detection of low-abundance ubiquitination events [12] [13]. The complex DIA datasets require specialized computational tools for deconvolution, typically using project-specific or general spectral libraries to extract meaningful peptide identifications and quantifications [13].
Table 1: Fundamental Differences Between DDA and DIA Acquisition Methods
| Feature | Data-Dependent Acquisition (DDA) | Data-Independent Acquisition (DIA) |
|---|---|---|
| Acquisition Principle | Selects most abundant precursors for fragmentation | Fragments all precursors in predefined m/z windows |
| Stochastic Sampling | Yes, leads to missing values across runs | No, provides complete data matrix |
| Reproducibility | Lower between technical replicates | Higher between technical replicates |
| Dynamic Range | Biased toward abundant peptides | Better coverage of low-abundance peptides |
| Data Complexity | Simpler, directly interpretable | Complex, requires specialized software |
| Ideal Application | Targeted studies, PTM validation | Comprehensive profiling, large cohorts |
Experimental Workflows in diGLY Ubiquitinomics
The standard workflow for diGLY ubiquitinome profiling begins with cell culture and treatment, typically using SILAC (Stable Isotope Labeling with Amino Acids in Cell Culture) or label-free approaches for quantification [9]. Following experimental perturbations, cells are lysed using denaturing buffers—typically containing 8M urea or sodium deoxycholate (SDC)—to preserve ubiquitination states while inactivating endogenous deubiquitinases [9] [13]. Critical to this step is the inclusion of N-ethylmaleimide (NEM) or chloroacetamide (CAA) to alkylate cysteine residues and prevent disulfide bond formation or protease activity [9] [13].
Protein extracts are then digested with trypsin, which generates the characteristic diGLY remnant on previously ubiquitinated lysines [9]. The resulting peptides are subjected to immunoaffinity enrichment using monoclonal antibodies specifically raised against the K-ε-GG motif [9] [12]. This enrichment is crucial due to the low abundance of ubiquitinated peptides relative to their unmodified counterparts. Following enrichment and cleanup, peptides are separated by nano-liquid chromatography and analyzed by either DDA or DIA MS approaches [12] [13].
Table 2: Key Research Reagent Solutions for diGLY Ubiquitinomics
| Reagent/Category | Specific Examples | Function in Workflow |
|---|---|---|
| Cell Lysis Reagents | 8M Urea buffer; SDC buffer with CAA [9] [13] | Protein denaturation, enzyme inactivation |
| Protease Inhibitors | Complete Protease Inhibitor Cocktail [9] | Prevents protein degradation during preparation |
| Cysteine Alkylators | N-Ethylmaleimide (NEM); Chloroacetamide (CAA) [9] [13] | Blocks disulfide bonds; inactivates DUBs |
| Digestion Enzymes | Trypsin (TPCK-treated); LysC [9] | Generates diGLY remnant peptides |
| Enrichment Antibodies | PTMScan Ubiquitin Remnant Motif (K-ε-GG) Kit [9] | Immunoaffinity purification of diGLY peptides |
| MS Acquisition Modes | DDA (e.g., TopN); DIA (optimized windows) [12] [13] | Peptide identification and quantification |
Recent methodological advances have substantially improved this workflow. The introduction of SDC-based lysis with immediate boiling and high concentrations of CAA has demonstrated a 38% increase in identified diGLY peptides compared to traditional urea buffers [13]. This improvement stems from more effective protease inhibition and reduced chemical artifacts. Additionally, pre-fractionation strategies addressing the overabundance of specific ubiquitin-derived peptides (particularly the K48-linked chain signature peptide) have improved coverage by reducing signal suppression during enrichment and MS analysis [12].
Comparative Performance: DIA Outperforms DDA in Ubiquitinome Analysis
Recent systematic comparisons demonstrate clear advantages of DIA over DDA for comprehensive ubiquitinome profiling. In a landmark study, DIA more than tripled the number of identified diGLY peptides compared to DDA from the same sample material—68,429 versus 21,434 peptides on average [13]. This dramatic improvement in coverage directly addresses the fundamental challenge of low ubiquitination stoichiometry, enabling researchers to probe deeper into the regulatory ubiquitinome.
Beyond identification numbers, DIA exhibits superior quantitative precision and reproducibility. Benchmarking experiments revealed that DIA achieves median coefficients of variation (CVs) of approximately 10% for diGLY peptide quantification, with 68,057 peptides robustly quantified across at least three replicates [13]. In contrast, DDA analyses showed substantially higher variability, with fewer than 50% of identifications consistently reproduced across replicates [12] [13]. This reproducibility advantage is particularly valuable for time-course experiments and large cohort studies where technical variance can obscure biological signals.
Table 3: Quantitative Performance Comparison Between DDA and DIA in Ubiquitinomics
| Performance Metric | DDA (Standard Workflow) | DIA (Optimized Workflow) | Experimental Context |
|---|---|---|---|
| diGLY Peptides ID (single run) | 21,434 [13] | 68,429 [13] | Proteasome-inhibited HCT116 cells |
| diGLY Peptides ID (single run) | ~20,000 [12] | 35,111 [12] | MG132-treated cells, hybrid library |
| Quantitative Precision (Median CV) | >20% [12] [13] | ~10% [13] | Multiple replicate analyses |
| Data Completeness (% in 3/3 replicates) | ~50% [13] | >95% [12] [13] | Technical replicate analysis |
| Spectral Library Requirements | Not applicable | 90,000+ diGLY peptides [12] | Deep library for comprehensive coverage |
The implementation of deep spectral libraries containing over 90,000 diGLY peptides has been instrumental in harnessing DIA's potential for ubiquitinomics [12]. These libraries enable confident identification of low-abundance regulatory ubiquitination events that would otherwise remain undetected. Furthermore, advanced computational approaches like DIA-NN with specialized scoring modules for modified peptides have enhanced the sensitivity and accuracy of DIA data processing for ubiquitinome applications [13]. When applied to biological systems with well-characterized ubiquitination dynamics, such as TNFα signaling, DIA-based workflows not only recapitulate known regulatory events but also uncover novel ubiquitination sites, providing more complete pictures of pathway regulation [12].
Advanced Applications and Biological Insights
The technical advances in diGLY-based ubiquitinome profiling have enabled unprecedented insights into dynamic biological systems. When applied to circadian biology, DIA-based ubiquitinomics uncovered hundreds of cycling ubiquitination sites across the circadian cycle, with clusters of regulated sites on individual membrane receptors and transporters [12]. These findings revealed previously unappreciated connections between metabolic regulation and circadian timing at the post-translational level, demonstrating how comprehensive ubiquitinome profiling can illuminate complex regulatory networks.
In drug discovery applications, DIA ubiquitinomics has proven valuable for characterizing the mechanism of action of compounds targeting the ubiquitin-proteasome system. Following inhibition of the deubiquitinase USP7, a promising oncology target, time-resolved DIA analysis simultaneously captured ubiquitination changes and corresponding protein abundance alterations for over 8,000 proteins [13]. This approach revealed that while hundreds of proteins showed increased ubiquitination within minutes of USP7 inhibition, only a small subset underwent degradation, effectively distinguishing degradative from non-degradative ubiquitination events [13]. Such functional discrimination is crucial for understanding the therapeutic potential and possible side effects of DUB inhibitors.
These advanced applications highlight how DIA-based diGLY proteomics has evolved from a cataloging tool to a powerful method for dynamic systems biology. The ability to capture ubiquitination changes at high temporal resolution across thousands of sites provides unprecedented insight into the kinetics and functional consequences of ubiquitin signaling. Furthermore, the integration of ubiquitinome data with parallel proteome measurements enables direct correlation of ubiquitination changes with protein abundance, facilitating distinction between ubiquitination events that target proteins for degradation versus those that modulate protein function or interactions [13].
The synergy between trypsin-generated diGLY remnants and advanced DIA mass spectrometry has established a powerful technological platform for ubiquitinome profiling. The trypsin digestion step creates a consistent, antibody-recognizable epitope that enables specific enrichment of ubiquitinated peptides from complex proteomic backgrounds. When coupled with DIA methodology, this approach delivers unprecedented depth, reproducibility, and quantitative accuracy in mapping ubiquitination events across diverse biological systems.
For researchers and drug development professionals, the implications are substantial. The technical advantages of DIA—including tripled identification rates, superior quantitative precision, and minimal missing data—provide a more complete and reliable view of ubiquitin signaling networks [12] [13]. These capabilities are particularly valuable for profiling the mechanism of action of UPS-targeting therapeutics, mapping dynamic ubiquitination changes in signaling pathways, and identifying novel regulatory ubiquitination events in disease models [11] [13].
As ubiquitinomics continues to mature, further refinements in sample preparation, MS instrumentation, and computational analysis will undoubtedly enhance the sensitivity and scope of diGLY-based profiling. The continued application of this powerful methodology promises to unravel the complexity of ubiquitin signaling in health and disease, potentially revealing new therapeutic opportunities for conditions ranging from cancer to neurodegenerative disorders.
In the field of proteomics, mass spectrometry (MS) has emerged as a powerful, unbiased technology for the identification and characterization of peptides and proteins. The most common approaches apply shotgun proteomics, utilizing one of two primary data acquisition strategies: data-dependent acquisition (DDA) and data-independent acquisition (DIA). Both methods are discovery-based approaches in bottom-up proteomics where proteins are enzymatically digested into smaller peptides, with information extracted from these peptides to infer conclusions at the protein level [14].
Understanding the fundamental differences between these acquisition methods is particularly crucial for specialized applications such as ubiquitinome analysis, which involves system-wide profiling of protein ubiquitination—a post-translational modification (PTM) critical for regulating diverse cellular processes including protein degradation, signal transduction, and DNA repair [15] [12]. The choice between DDA and DIA significantly impacts the depth, reproducibility, and quantitative accuracy of ubiquitinome profiling, directly influencing the biological insights that can be gained from such studies.
This guide provides an objective comparison of DDA and DIA performance, with supporting experimental data specifically contextualized for ubiquitinome analysis research, offering drug development professionals and scientists a foundation for selecting appropriate methodologies for their investigative needs.
Fundamental Principles of DDA and DIA
Data-Dependent Acquisition (DDA)
Data-Dependent Acquisition (DDA) operates on a selective fragmentation principle where the mass spectrometer cherry-picks ions for fragmentation based on their intensity or abundance [7] [16]. In a typical DDA workflow, the instrument first performs a full scan (MS1) to identify peptide ions present at a given moment. It then isolates the most abundant ions from this survey scan for fragmentation, generating MS2 spectra for peptide identification [14]. This process iteratively repeats throughout the liquid chromatography (LC) separation, focusing on the most intense ions at each point in time.
The fundamental characteristic of DDA is its targeted nature toward high-abundance precursors, which can lead to semi-stochastic sampling and variable results across replicate runs [15]. While DDA generates relatively pure, easily interpretable MS2 spectra that are ideal for database searching and spectral library generation, its selective nature may result in incomplete data for low-abundance peptides that fail to trigger fragmentation events [7].
Data-Independent Acquisition (DIA)
Data-Independent Acquisition (DIA) takes a fundamentally different approach by systematically fragmenting all ions within predefined mass-to-charge (m/z) windows, without regard to their intensity [7] [16] [17]. Instead of selecting individual precursors, DIA methods divide the entire m/z range into consecutive isolation windows, sequentially fragmenting and analyzing all peptide ions within each window throughout the LC separation [14] [18].
This comprehensive fragmentation strategy ensures that all detectable analytes are captured within a predetermined m/z range, providing a more complete and unbiased representation of the sample composition [16]. The principal challenge of DIA is the increased spectral complexity, as multiple peptides fragment together, leading to convoluted spectra that require sophisticated computational algorithms for deconvolution and peptide identification [18]. However, this approach results in more complete data with fewer missing values across sample replicates.
Table 1: Core Conceptual Differences Between DDA and DIA
| Feature | Data-Dependent Acquisition (DDA) | Data-Independent Acquisition (DIA) |
|---|---|---|
| Selection Principle | Intensity-based precursor selection | Systematic, sequential window acquisition |
| Fragmentation Approach | Selective fragmentation of most abundant ions | Comprehensive fragmentation of all ions in m/z windows |
| Data Completeness | Semi-stochastic; can miss low-abundance species | Systematic; captures all detectable analytes |
| Spectral Complexity | Relatively pure MS2 spectra | Highly complex, convoluted MS2 spectra |
| Data Analysis | More straightforward database searching | Requires advanced bioinformatics tools |
Direct Performance Comparison in Ubiquitinome Analysis
Coverage and Sensitivity
Multiple studies have directly compared the performance of DDA and DIA for ubiquitinome analysis, with DIA consistently demonstrating superior identification capabilities. In a landmark study focused on ubiquitinome profiling, researchers found that while DDA quantified 21,434 K-ε-GG (diglycine remnant) peptides on average from proteasome inhibitor-treated HCT116 cells, DIA more than tripled this number to 68,429 K-ε-GG peptides [15]. This dramatic increase in coverage provides a more comprehensive view of the ubiquitinome, enabling researchers to detect a wider array of ubiquitination events.
Similarly, research on circadian biology ubiquitinome analysis demonstrated that DIA could identify approximately 35,000 distinct diGly peptides in single measurements of proteasome inhibitor-treated cells—nearly double the number achievable with DDA methods [12]. The same study also highlighted that DIA enabled this deep coverage with significantly less sample material, quantifying about 30,000 K-ε-GG peptides from just 2 mg of protein input, whereas identification numbers dropped below 20,000 for inputs of 500 μg or less with conventional methods [15].
Quantitative Accuracy and Reproducibility
Quantitative performance is another area where DIA demonstrates significant advantages for ubiquitinome studies. The comprehensive data acquisition strategy of DIA results in excellent quantitative precision and reproducibility, with median coefficients of variation (CVs) for quantified K-ε-GG peptides of approximately 10% compared to significantly higher variability in DDA datasets [15].
In direct comparisons, DIA-based ubiquitinome analysis showed that 68,057 ubiquitinated peptides could be quantified in at least three replicates, with 88% of ubiquitinated peptides detected by DDA also being identified by DIA [15]. Another study reported that 45% of diGly peptides identified by DIA had CVs below 20%, compared to only 15% with DDA, demonstrating substantially improved quantitative reproducibility [12]. This enhanced reproducibility is particularly valuable for time-course experiments and clinical studies where precise quantification across multiple samples is essential for drawing meaningful biological conclusions.
Table 2: Performance Comparison of DDA and DIA in Ubiquitinome Studies
| Performance Metric | DDA Performance | DIA Performance | Experimental Context |
|---|---|---|---|
| Peptide Identifications | 21,434 K-ε-GG peptides | 68,429 K-ε-GG peptides | HCT116 cells, proteasome inhibitor treatment [15] |
| Single-Run Coverage | ~20,000 diGly peptides | 35,000 diGly peptides | HEK293 cells, proteasome inhibitor treatment [12] |
| Quantitative Precision (CV) | >20% CV for majority of peptides | Median CV of ~10% for K-ε-GG peptides | HCT116 cells, replicate analysis [15] |
| Data Completeness | ~50% without missing values in replicates | 68,057 peptides in ≥3 replicates | Multiple replicate samples [15] |
| Low-Abundance Detection | Limited by stochastic sampling | Enhanced detection of low-abundance ubiquitination events | Complex biological samples [7] [16] |
Experimental Protocols for Ubiquitinome Analysis
Sample Preparation Workflow
Robust ubiquitinome analysis requires specialized sample preparation to enrich for ubiquitinated peptides prior to mass spectrometry analysis. The following optimized protocol has been demonstrated to yield high coverage and reproducibility:
Cell Lysis and Protein Extraction: Utilize sodium deoxycholate (SDC)-based lysis buffer supplemented with chloroacetamide (CAA) for rapid cysteine alkylation and immediate boiling to inactivate deubiquitinases. This protocol has been shown to yield 38% more K-ε-GG peptides compared to conventional urea-based buffers [15].
Protein Digestion: Perform tryptic digestion to generate peptides containing the characteristic K-ε-GG remnant (diglycine signature) at sites of ubiquitination.
Peptide Enrichment: Employ immunoaffinity purification using anti-K-ε-GG antibodies specifically targeting the diglycine remnant. Optimization experiments indicate that enrichment from 1 mg of peptide material using 31.25 μg of anti-diGly antibody provides optimal results [12].
Fractionation (Optional): For maximum depth of coverage, basic reversed-phase chromatography can be used to fractionate peptides prior to enrichment, particularly effective when separating highly abundant K48-linked ubiquitin-chain derived diGly peptides that might otherwise compete for antibody binding sites [12].
Mass Spectrometry Acquisition Parameters
For DIA Analysis:
- LC Gradient: Medium-length nanoLC gradients (75-125 minutes) provide a balance between throughput and depth [15].
- DIA Method: Use optimized window schemes tailored to the characteristics of diGly peptides, which often generate longer peptides with higher charge states due to impeded C-terminal cleavage of modified lysine residues. A method with 46 precursor isolation windows and MS2 resolution of 30,000 has demonstrated excellent performance [12].
- Data Processing: Utilize advanced software tools such as DIA-NN, Spectronaut, or alphaDIA capable of handling the complex DIA data. Library-free analysis or using comprehensive spectral libraries containing >90,000 diGly peptides both yield excellent results [15] [12] [18].
For DDA Analysis:
- LC-MS/MS: Use standard DDA methods with dynamic exclusion to maximize peptide identifications.
- Data Processing: Process data with search engines like MaxQuant with match-between-runs (MBR) enabled to increase data completeness [15].
Essential Research Reagents and Tools
Successful ubiquitinome profiling requires specific reagents and computational tools optimized for the unique challenges of ubiquitinated peptide analysis. The following resources represent essential components of a robust ubiquitinome workflow:
Table 3: Essential Research Reagents and Tools for Ubiquitinome Analysis
| Category | Specific Product/Software | Function | Key Features |
|---|---|---|---|
| Enrichment Reagents | Anti-K-ε-GG Antibody (CST) | Immunoaffinity purification of ubiquitinated peptides | Specific recognition of diglycine remnant on lysine [12] |
| Lysis Buffers | SDC-Based Lysis Buffer | Protein extraction with protease inhibition | Immediate boiling with CAA inactivates deubiquitinases [15] |
| Data Analysis Software | DIA-NN | DIA data processing | Neural network-based analysis optimized for ubiquitinomics [15] |
| Data Analysis Software | Spectronaut | DIA data analysis | Advanced algorithms for deep proteome coverage [14] |
| Data Analysis Software | AlphaDIA | DIA search framework | Feature-free identification for complex data [18] |
| Data Analysis Software | MaxQuant | DDA data processing | Match-between-runs increases data completeness [15] |
Application to Biological Research
The technical advantages of DIA for ubiquitinome analysis translate into tangible benefits for biological discovery. In one application, researchers employed DIA-based ubiquitinome profiling to comprehensively map substrates of the deubiquitinase USP7, an important anticancer drug target [15]. The method simultaneously recorded ubiquitination and consequent changes in abundance of more than 8,000 proteins at high temporal resolution following USP7 inhibition, revealing that while ubiquitination of hundreds of proteins increased within minutes, only a small fraction of those were subsequently degraded [15]. This finding helped dissect the scope of USP7 action, distinguishing regulatory ubiquitination leading to protein degradation from non-degradative events.
In another study, DIA-based ubiquitinome analysis enabled an in-depth, systems-wide investigation of ubiquitination across the circadian cycle, uncovering hundreds of cycling ubiquitination sites and dozens of cycling ubiquitin clusters within individual membrane protein receptors and transporters [12]. This research highlighted new connections between metabolism and circadian regulation that would have been difficult to detect with less comprehensive methods.
Furthermore, DIA has proven valuable for investigating ubiquitination in neurological contexts, such as profiling cold exposure effects on hippocampal neurodevelopment in adolescent mice, where ubiquitinome analysis revealed changes in ubiquitination levels of various synaptic-associated proteins and abnormalities in energy homeostasis within the hippocampus [19].
The fundamental differences between DDA and DIA mass spectrometry acquisition methods have significant implications for ubiquitinome analysis research. While DDA remains valuable for targeted studies, spectral library generation, and applications requiring high sensitivity for specific post-translational modifications, DIA demonstrates clear advantages for comprehensive system-wide ubiquitinome profiling, offering substantially increased coverage, superior quantitative accuracy, and enhanced reproducibility across sample replicates [15] [12].
For drug development professionals and researchers investigating complex ubiquitination dynamics in biological systems and disease contexts, DIA provides a more powerful approach for capturing the full complexity of ubiquitin signaling. The method's ability to simultaneously monitor ubiquitination changes and corresponding protein abundance alterations at high temporal resolution enables unprecedented insights into the dynamics and functional consequences of ubiquitination events in cellular regulation and drug response [15].
As mass spectrometry technology and computational tools continue to advance, DIA methodologies are poised to become increasingly accessible and powerful, potentially opening new frontiers in our understanding of ubiquitin signaling networks and their roles in health and disease [17] [18].
Protein ubiquitination represents one of the most versatile and complex post-translational modifications in eukaryotic cells, governing virtually all cellular processes including protein degradation, DNA repair, cell signaling, and immune response [12] [20]. The term "ubiquitinome" refers to the complete set of protein ubiquitination events within a biological system, characterized by two primary analytical challenges: the characteristically low stoichiometry of ubiquitinated species amidst unmodified proteins, and the tremendous complexity of ubiquitin chain topologies [21] [20]. Unlike other modifications, ubiquitin can form polymers through eight different linkage types (linear and via Lys6, Lys11, Lys27, Lys29, Lys33, Lys48, Lys63), creating homotypic, heterotypic, and even branched chains that encode specific biological functions [21]. Conventional data-dependent acquisition (DDA) mass spectrometry struggles with these challenges due to stochastic precursor selection and substantial missing values across samples. This comparison guide examines how data-independent acquisition (DIA) mass spectrometry addresses these limitations to provide more comprehensive ubiquitinome analysis.
Methodological Comparison: DDA versus DIA for Ubiquitinomics
Fundamental Acquisition Differences
In data-dependent acquisition (DDA), the mass spectrometer sequentially selects the most abundant precursor ions from an MS1 survey scan for fragmentation, inherently biasing detection toward high-abundance species while frequently missing lower-abundance ubiquitinated peptides [7]. This approach generates substantial missing values across sample series and offers limited quantitative precision for low-stoichiometry modifications.
In contrast, data-independent acquisition (DIA) systematically fragments all ions within sequential, predefined isolation windows across the full m/z range, capturing all analytes present in a sample without abundance-based bias [8] [17]. This acquisition strategy produces comprehensive, permanent digital maps of the ubiquitinome with minimal missing values, significantly improving detection of low-stoichiometry ubiquitination events and quantitative reproducibility [8] [12].
Experimental Workflows for Ubiquitinome Analysis
The standard workflow for mass spectrometry-based ubiquitinome analysis involves multiple critical steps from sample preparation to data processing, with key differences between DDA and DIA approaches.
Performance Comparison: Quantitative Experimental Data
Identification Depth and Quantitative Precision
Recent advancements in DIA methodologies have demonstrated substantial improvements in ubiquitinome coverage and data quality compared to conventional DDA approaches.
Table 1: Performance Comparison of DIA vs. DDA in Ubiquitinome Analysis
| Performance Metric | DDA (Standard Approach) | DIA (Improved Approach) | Experimental Context |
|---|---|---|---|
| Identified K-ε-GG Peptides | 21,434 | 68,429 (219% increase) | HCT116 cells, 75-min gradient [8] |
| Precisely Quantified Peptides (CV<20%) | ~15% | ~45% | HEK293 cells, replicate analysis [12] |
| Data Completeness (Missing Values) | ~50% peptides without missing values | 68,057 peptides in ≥3 replicates | HCT116 replicate analysis [8] |
| Spectral Library Coverage | N/A | 93,684 unique diGly peptides | Combined HEK293/U2OS libraries [12] |
| Single-Run Coverage | ~20,000 diGly peptides | 35,000+ diGly peptides | HEK293 cells, MG-132 treatment [12] |
Specialized DIA Workflows and Their Output
Researchers have developed optimized DIA workflows specifically for ubiquitinome analysis that incorporate specialized sample preparation and data processing techniques.
Table 2: Specialized DIA Ubiquitinomics Workflows and Their Performance
| Workflow Component | SDC-Based Lysis Protocol [8] | Fractionation-Based Library [12] | Direct DIA Analysis [12] |
|---|---|---|---|
| Key Innovation | Sodium deoxycholate lysis with chloroacetamide | Deep spectral library via high-pH fractionation | Library-free analysis without prior fractionation |
| Protein Input | 2 mg | 1 mg | 1 mg |
| Identification Performance | 70,000+ ubiquitinated peptides | 93,684 unique diGly peptides in library | 26,780±59 diGly sites without library |
| Major Advantage | 38% more K-ε-GG peptides vs. urea protocol | Comprehensive reference resource | No extensive library generation required |
| Quantitative Precision | Median CV ~10% | 77% peptides with CV <50% | Good quantitative accuracy |
Technical Protocols for Ubiquitinome Analysis
Optimized Sample Preparation Protocol
The accuracy of ubiquitinome analysis depends critically on sample preparation techniques that preserve ubiquitination signatures while minimizing artifacts:
Lysis Buffer Optimization: Supplement sodium deoxycholate (SDC) lysis buffer with chloroacetamide (CAA) for immediate cysteine protease inactivation without di-carbamidomethylation artifacts that mimic K-ε-GG remnants [8]. SDC-based extraction increases ubiquitinated peptide identifications by 38% compared to conventional urea buffers.
Enrichment Specifications: Utilize 1 mg peptide material with 31.25 μg anti-K-ε-GG antibody for optimal enrichment efficiency. For proteasome inhibitor-treated samples, consider separating highly abundant K48-linked ubiquitin-chain derived diGly peptides to prevent competition during immunoprecipitation [12].
Protease Inhibition Strategy: Immediate sample boiling after lysis with high CAA concentrations rapidly inactivates deubiquitinases (DUBs) that would otherwise remove ubiquitin modifications during processing [8].
Mass Spectrometry Acquisition Parameters
Specialized instrument methods are required for high-quality ubiquitinomics data:
DIA Window Schemes: Implement optimized window widths based on empirical precursor distributions, typically employing 46 precursor isolation windows for comprehensive coverage [12].
Resolution Settings: Use fragment scan resolution of 30,000 for improved identification rates while maintaining reasonable cycle times for sufficient chromatographic sampling [12].
Liquid Chromatography: Employ 75-125 min nanoLC gradients with 1.5 μL/min flow rates on C18 columns (e.g., 200μm i.d. × 25cm) for optimal peptide separation [8] [21].
The Scientist's Toolkit: Essential Research Reagents
Table 3: Key Research Reagents for Ubiquitinome Analysis
| Reagent / Material | Function | Application Notes |
|---|---|---|
| Anti-K-ε-GG Antibody | Immunoaffinity enrichment of ubiquitinated peptides | Critical for low-stoichiometry ubiquitination site identification; use 31.25 μg per 1 mg peptide input [12] |
| Sodium Deoxycholate (SDC) | Protein extraction and solubilization | Superior to urea for ubiquitinomics; supplement with chloroacetamide for protease inhibition [8] |
| Chloroacetamide (CAA) | Cysteine alkylating agent | Preferred over iodoacetamide to avoid di-carbamidomethylation artifacts that mimic GG remnants [8] |
| Proteasome Inhibitors (MG-132) | Blocks degradation of ubiquitinated proteins | Increases ubiquitin signal but dramatically elevates K48-chain peptides; requires adjustment of enrichment strategy [12] |
| PNGase F | N-linked deglycosylating enzyme | Useful for distinguishing N-glycosylation from ubiquitination when analyzing diGly signatures [22] |
| DUB Inhibitors | Prevent deubiquitination during processing | Preserves endogenous ubiquitination states; often used in lysis buffers [20] |
Biological Application: USP7 Inhibition Study
The power of DIA ubiquitinomics is exemplified in a time-resolved study of USP7 deubiquitinase inhibition, which simultaneously monitored ubiquitination changes and corresponding protein abundance alterations for over 8,000 proteins [8]. This systems-level analysis revealed that while hundreds of proteins showed increased ubiquitination within minutes of USP7 inhibition, only a small subset underwent degradation, effectively distinguishing regulatory ubiquitination from degradation-targeting ubiquitination [8]. Such multidimensional analysis demonstrates how DIA enables comprehensive functional dissection of ubiquitin signaling pathways, providing critical insights for drug development targeting DUBs and ubiquitin ligases.
DIA mass spectrometry represents a transformative advancement for ubiquitinome research, directly addressing the core challenges of low stoichiometry and complex chain topologies that have limited previous methodologies. By providing tripled identification rates, significantly improved quantitative precision, and superior data completeness compared to DDA, DIA enables researchers to capture the full complexity of ubiquitin signaling networks [8] [12]. The experimental protocols and reagent specifications outlined herein provide a foundation for implementing robust ubiquitinomics workflows capable of generating comprehensive, reproducible datasets. As ubiquitin-targeting therapies continue to emerge in drug development, particularly in oncology, DIA-based ubiquitinome profiling offers an essential tool for target validation, mechanism-of-action studies, and biomarker discovery, ultimately accelerating the translation of ubiquitin biology into clinical applications.
In mass spectrometry-based proteomics, the choice of data acquisition strategy is a fundamental decision that directly dictates the depth, accuracy, and reproducibility of research findings. For years, Data-Dependent Acquisition (DDA) has been the cornerstone of discovery proteomics. However, the emergence of Data-Independent Acquisition (DIA) represents a paradigm shift, offering a powerful alternative that combines the breadth of discovery with the robustness of targeted methods. This is particularly critical in specialized fields like ubiquitinome analysis, where capturing low-abundance, transient modifications is essential for understanding complex cellular signaling. This guide provides an objective comparison of DIA and DDA, underpinned by experimental data, to inform method selection for researchers and drug development professionals.
How It Works: Fundamental Mechanisms of DDA and DIA
The core difference between these techniques lies in how they select peptide precursors for fragmentation.
Data-Dependent Acquisition (DDA): The Selective Approach
In a DDA workflow, the mass spectrometer performs a full MS1 scan to measure all intact peptide precursors. It then automatically selects the most abundant ions from that scan for subsequent isolation and fragmentation (MS2). This process is repeated throughout the entire liquid chromatography (LC) run [16] [6]. While effective, this "top-N" selection is inherently stochastic and biased towards high-abundance peptides, leading to inconsistent identification of low-abundance species across different runs [23] [24].
Data-Independent Acquisition (DIA): The Comprehensive Approach
In contrast, DIA systematically fragments all ions within pre-defined, sequential mass-to-charge (m/z) windows across the entire scanning range. Instead of selecting individual precursors, the instrument cycles through these windows, fragmentating every peptide that falls within them. This results in highly complex MS2 spectra containing fragment ions from multiple co-eluting peptides [18] [24]. Deconvoluting this data requires specialized software and often a spectral library, but it ensures a complete, unbiased recording of all detectable analytes in the sample [23] [7].
The following diagram illustrates the fundamental difference in their acquisition logic:
Head-to-Head Performance: A Quantitative Comparison
Extensive benchmarking studies across various sample types consistently demonstrate the performance advantages of DIA in quantification.
Table 1: Performance Comparison of DIA vs. DDA in General Proteomics
| Performance Metric | Data-Independent Acquisition (DIA) | Data-Dependent Acquisition (DDA) | Context & Citation |
|---|---|---|---|
| Proteome Depth | ~10,000 protein groups [6] | 2,500 - 3,600 protein groups [6] | Mouse liver tissue, 45-min gradient [6] |
| Identification in Biofluids | 701 proteins [25] | 396 proteins [25] | Tear fluid samples |
| Quantitative Reproducibility (CV) | Median CV 9.8% (protein) [25] | Median CV 17.3% (protein) [25] | Tear fluid replicates |
| Data Completeness | 78.7% - 93% [25] [6] | 42% - 69% [25] [6] | Percentage of valid values across replicates |
| Quantification Accuracy | Superior correlation with theoretical ratios [23] [26] | Lower quantitative accuracy [23] | Gold standard spike-in studies |
The superiority of DIA is even more pronounced in the analysis of post-translational modifications (PTMs), such as ubiquitination, where sensitivity and reproducibility are paramount.
Table 2: Performance in Ubiquitinome (diGly) Analysis [5]
| Performance Metric | DIA Workflow | Traditional DDA Workflow |
|---|---|---|
| diGly Peptides Identified | ~35,000 in single shots | Approximately half the number of DIA |
| Quantitative Reproducibility | 45% of peptides with CV < 20% | Lower reproducibility (specific CVs not provided) |
| Required Sample Input | Lower input required due to high sensitivity | Typically requires more material for similar coverage |
| Key Workflow Note | Relies on comprehensive spectral libraries (>90,000 diGly peptides) | Standard library generation |
A Closer Look: DIA in Ubiquitinome Analysis
The application of DIA to ubiquitinome research showcases its transformative potential. A seminal study developed an optimized DIA workflow for ubiquitination, creating extensive spectral libraries containing over 90,000 diGly peptides. This resource enabled the identification of 35,000 distinct ubiquitination sites in single measurements of proteasome-inhibited cells—doubling the coverage typically achievable with DDA [5].
The workflow involves several critical steps to handle the unique challenges of ubiquitinome analysis, such as the high abundance of specific ubiquitin-chain peptides that can interfere with detection.
Detailed Experimental Protocol for DIA Ubiquitinome Analysis [5]:
- Cell Treatment: Treat human cell lines (e.g., HEK293, U2OS) with a proteasome inhibitor like MG132 (10 µM for 4 hours) to stabilize ubiquitinated proteins.
- Sample Preparation: Extract proteins, digest with trypsin, and desalt the resulting peptides.
- Peptide Fractionation: To manage sample complexity and the overabundance of specific ubiquitin-derived peptides (e.g., K48-linked diGly peptide), separate peptides using basic reversed-phase (bRP) chromatography into 96 fractions. These are then concatenated into a smaller number of pools (e.g., 8). The fractions containing the highly abundant K48-peptide are processed separately to prevent them from dominating the subsequent enrichment step.
- diGly Peptide Enrichment: Enrich the pooled fractions for peptides containing the diGly remnant using an anti-K-ε-GG motif antibody. The optimized ratio is 1 mg of peptide material per 31.25 µg of antibody.
- Spectral Library Generation: Analyze the enriched fractions using a DDA method to build a comprehensive, project-specific spectral library.
- DIA Analysis: Analyze experimental samples using the optimized DIA method. Key parameters include:
- Isolation Windows: 46 windows.
- MS2 Resolution: 30,000.
- These settings were found to balance data quality and cycle time for optimal chromatographic sampling.
- Data Processing: Process the acquired DIA data against the deep spectral library using specialized software (e.g., Spectronaut, DIA-NN, or alphaDIA).
The Scientist's Toolkit: Essential Reagents and Materials
Table 3: Key Research Reagent Solutions for Ubiquitinome Analysis
| Item | Function in the Workflow | Example/Note |
|---|---|---|
| Anti-K-ε-GG Motif Antibody | Immunoaffinity enrichment of ubiquitinated peptides from complex digests. | PTMScan Ubiquitin Remnant Motif (K-ε-GG) Kit [5] |
| Spectral Library | Database of known peptide spectra used to identify and quantify peptides from DIA data. | Project-specific libraries generated via fractionated DDA are ideal. Pan-species libraries also exist. [23] [18] |
| Trypsin | Protease for digesting proteins into peptides for bottom-up proteomics. | Sequencing grade, to ensure specific cleavage. |
| Proteasome Inhibitor | Stabilizes the ubiquitinome by preventing the degradation of ubiquitinated proteins. | MG132 is commonly used. [5] |
| DIA Analysis Software | Deconvolutes complex DIA data, performs peptide identification, and quantifies abundance. | Spectronaut, DIA-NN, OpenSWATH, AlphaDIA [23] [18] [17] |
Making the Right Choice: DIA or DDA for Your Research?
The decision between DIA and DDA hinges on the specific research goals and constraints.
Choose DIA if:
- Your study demands high quantitative accuracy and reproducibility across many samples [23] [26].
- You are working with complex samples like whole cell lysates, tissues, or biofluids (e.g., plasma, tear fluid) [25] [16] [7].
- The research focus is on low-abundance proteins or PTMs like ubiquitination, phosphorylation, or analysis in precious clinical samples [6] [5].
- Your lab has access to bioinformatics tools and computational resources for DIA data processing.
Choose DDA if:
- The project is small-scale or exploratory.
- The sample is less complex (e.g., purified protein extracts).
- The goal is to rapidly identify proteins without the need for highly precise quantification.
- Spectral library generation is not feasible, and established, simpler DDA data analysis workflows are preferred [16] [7].
The evidence from rigorous comparative studies is clear: DIA offers profound advantages over DDA in quantification reproducibility, proteome coverage, and data completeness. For ubiquitinome analysis and other PTM studies, DIA's ability to consistently capture low-abundance events in a single-run format makes it the superior method. While DDA remains a viable tool for simpler, identification-focused projects, DIA is unequivocally the technique of choice for large-scale, quantitative profiling, biomarker discovery, and clinical research where accuracy and robustness are non-negotiable. As mass spectrometry technology and bioinformatics continue to evolve, the adoption of DIA is poised to become the standard for rigorous proteomic investigation.
Optimized DIA Workflows for Deep Ubiquitinome Profiling and Drug Target Discovery
In mass spectrometry-based ubiquitinome analysis, sample preparation is a critical determinant of data depth and quality. Traditional urea-based lysis buffers often impose limitations on ubiquitin site coverage, reproducibility, and quantitative accuracy. This guide objectively compares a novel sodium deoxycholate (SDC)-based lysis protocol against conventional methods, presenting experimental data that demonstrates its superior performance. Framed within the broader comparison of Data-Independent Acquisition (DIA) versus Data-Dependent Acquisition (DDA) mass spectrometry, this work illustrates how SDC-based preparation synergizes with advanced acquisition techniques to achieve unprecedented depth in ubiquitin signaling analysis, providing researchers and drug development professionals with a robust framework for method selection.
Protein ubiquitination, a fundamental post-translational modification regulating virtually all cellular processes, presents unique challenges for mass spectrometry-based analysis due to its low stoichiometry, transient nature, and complex chain topologies [5]. Traditional methodologies for ubiquitinome profiling have relied on urea-based protein extraction followed by immunoaffinity purification of tryptic peptides containing the characteristic diglycine (K-ε-GG) remnant left after ubiquitin modification [8] [5]. While enabling foundational discoveries, this approach suffers from limitations in ubiquitin site coverage, identification robustness, and quantitative precision, particularly in large sample series. These technical constraints have impeded system-level understanding of ubiquitin signaling dynamics in biological contexts ranging from cancer to circadian regulation. This comparison guide evaluates a transformative sample preparation breakthrough—sodium deoxycholate (SDC)-based lysis—that substantially enhances ubiquitin site coverage when integrated with modern mass spectrometry acquisition strategies.
Methodological Comparison: SDC vs. Urea Lysis Protocols
Conventional Urea-Based Lysis Protocol
Traditional ubiquitinome sample preparation utilizes urea-based lysis buffers (typically 8M urea in Tris-HCl, pH 8.0) for cell disruption and protein extraction. The standard workflow involves:
- Cell Lysis: Using ice-cold urea buffer supplemented with protease and deubiquitinase (DUB) inhibitors
- Protein Reduction and Alkylation: Dithiothreitol (DTT) treatment followed by iodoacetamide (IAA) alkylation
- Digestion: Trypsinization after urea dilution or buffer exchange
- Peptide Enrichment: Immunoaffinity purification of K-ε-GG peptides using specific antibodies
- Mass Spectrometry Analysis: Typically via Data-Dependent Acquisition (DDA)
This method, while widely adopted, presents limitations including incomplete protein extraction, reduced efficiency in disrupting protein complexes, and potential for carbamylation from urea degradation. Notably, iodoacetamide alkylation can cause di-carbamidomethylation of lysine residues, generating a mass tag (114.0249 Da) that mimics the ubiquitin remnant K-GG peptide mass and potentially leads to false identifications [8].
Innovative SDC-Based Lysis Protocol
The optimized SDC-based protocol introduces key modifications to address urea-based limitations:
- Enhanced Lysis Buffer: 5% SDC in 50mM Tris-HCl (pH 8.5) supplemented with 50mM chloroacetamide (CAA) for immediate cysteine alkylation and DUB inhibition
- Rapid Heat Inactivation: Immediate sample boiling after lysis (95°C for 10 minutes) to instantaneously denature proteins and inactivate enzymes
- Improved Alkylation Strategy: Chloroacetamide use prevents di-carbamidomethylation artifacts while rapidly alkylating cysteine ubiquitin proteases
- Digestion and Cleanup: Trypsinization followed by SDC removal via acidification and phase separation
- Peptide Enrichment and MS Analysis: Identical subsequent steps but with significantly improved input material quality
This protocol leverages SDC's superior protein solubilization capacity while exploiting immediate boiling and CAA alkylation to preserve ubiquitination states by instantaneously inactivating deubiquitinases that might otherwise remove ubiquitin signals during preparation [8].
Table 1: Direct Comparison of SDC vs. Urea Lysis Buffer Performance
| Parameter | SDC-Based Lysis | Conventional Urea Lysis |
|---|---|---|
| Average K-GG Peptide Identifications | 26,756 (HCT116 cells, n=4) | 19,403 (HCT116 cells, n=4) |
| Identification Increase | 38% more than urea | Baseline |
| Reproducibility (CV < 20%) | Significantly improved | Lower proportion of precisely quantified peptides |
| Sample Input Requirement | 20-fold less protein input for similar coverage | Requires higher input for equivalent coverage |
| Artifact Potential | No di-carbamidomethylation of lysine residues | Potential for di-carbamidomethylation with IAA |
| Enrichment Specificity | Maintained or improved relative enrichment specificity | Standard specificity |
| MS Acquisition Time | 1/10th required per sample | Typically requires extensive fractionation |
Table 2: Protein and Peptide Identification Metrics in Jurkat Cells with Varying Input
| Protein Input Amount | K-GG Peptides Identified | Notes |
|---|---|---|
| 4 mg | ~30,000 | Maximum identification but high material requirement |
| 2 mg | ~30,000 | Optimal balance for most applications |
| 500 µg | <20,000 | Significant drop in identifications |
| 31 µg | Minimal identifications | Insufficient for comprehensive analysis |
Experimental Data: Quantitative Performance Assessment
Direct Comparison Studies
In controlled experiments using HCT116 cells treated with the proteasome inhibitor MG-132 for 6 hours, SDC-based lysis yielded 26,756 K-GG peptides on average compared to 19,403 peptides with urea buffer (n=4 workflow replicates), representing a 38% improvement in ubiquitin site coverage without compromising enrichment specificity [8]. The method also increased both the number of precisely quantified K-GG peptides (those with coefficient of variation < 20%) and overall reproducibility across replicates [8].
When benchmarked against the UbiSite approach (which employs urea lysis and immunoaffinity purification of longer ubiquitin remnant peptides from Lys-C digests), the single-shot SDC workflow demonstrated superior performance in quantitative precision despite the UbiSite method identifying 30% more K-GG peptides in fractionated samples [8]. Critically, the SDC protocol achieved this with 20-fold less protein input and only one-tenth the MS acquisition time per sample, highlighting its dramatic efficiency improvements for most applications.
Synergy with DIA Mass Spectrometry
The true power of SDC-based sample preparation emerges when coupled with Data-Independent Acquisition (DIA) mass spectrometry. In comparative studies:
- DDA following SDC lysis identified approximately 30,000 ubiquitinated peptides but with approximately 50% missing values across replicate samples [8]
- DIA with SDC lysis more than tripled identification numbers to over 70,000 ubiquitinated peptides in single MS runs [8]
- DIA demonstrated excellent quantitative precision with median coefficient of variation (CV) of approximately 10% for all quantified K-GG peptides [8]
- 68,057 peptides were quantified in at least three replicates, demonstrating exceptional data completeness [8]
This combination enables rapid mode-of-action profiling of candidate drugs targeting deubiquitinases or ubiquitin ligases at high precision and throughput [8]. When applied to USP7 inhibition, researchers could simultaneously monitor ubiquitination changes and abundance alterations for more than 8,000 proteins at high temporal resolution [8].
Workflow and Performance Comparison
Technical Applications and Biological Insights
Systems-Level Ubiquitin Signaling Studies
The SDC-DIA workflow has enabled unprecedented insights into ubiquitin signaling dynamics. When applied to TNFα signaling, the method comprehensively captured known ubiquitination sites while adding many novel ones, expanding our understanding of this critical pathway [5]. In an extensive systems-wide investigation of ubiquitination across the circadian cycle, this approach uncovered hundreds of cycling ubiquitination sites and dozens of cycling ubiquitin clusters within individual membrane protein receptors and transporters [5]. These discoveries highlight new connections between metabolism and circadian regulation that were previously obscured by technical limitations.
Drug Target Validation and Deubiquitinase Profiling
SDC-based preparation combined with DIA has proven particularly valuable for characterizing deubiquitinase inhibitors, an emerging class of therapeutic agents. Following inhibition of the oncology target USP7, researchers simultaneously recorded ubiquitination changes and consequent abundance alterations for more than 8,000 proteins at high temporal resolution [8]. This approach revealed that while ubiquitination of hundreds of proteins increased within minutes of USP7 inhibition, only a small fraction underwent degradation, thereby precisely dissecting the scope of USP7 action beyond proteasomal targeting [8].
The Scientist's Toolkit: Essential Research Reagents
Table 3: Key Reagent Solutions for SDC-Based Ubiquitinomics
| Reagent/Resource | Function in Workflow | Specific Application Notes |
|---|---|---|
| Sodium Deoxycholate (SDC) | Powerful detergent for efficient protein extraction and solubilization | Superior to urea for membrane proteins and protein complexes; must be removed by acidification pre-MS |
| Chloroacetamide (CAA) | Rapid alkylating agent for cysteine residues | Prevents DUB activity during lysis; avoids di-carbamidomethylation artifacts seen with iodoacetamide |
| Anti-diGly (K-ε-GG) Antibody | Immunoaffinity enrichment of ubiquitin remnant peptides | Critical for specificity; commercial kits available (e.g., PTMScan Ubiquitin Remnant Motif Kit) |
| Proteasome Inhibitors (e.g., MG-132) | Blocks degradation of ubiquitinated proteins | Enhances ubiquitin signal; typically used 4-6 hours at 10-20µM concentration |
| DIA-NN Software | Deep neural network-based DIA data processing | Specifically optimized for ubiquitinomics; enables library-free analysis |
| High-pH Reversed-Phase Fractions | Spectral library generation | Creates comprehensive libraries containing >90,000 diGly peptides for targeted extraction |
The development of SDC-based lysis protocols represents a significant advancement in ubiquitinome analysis, substantially enhancing ubiquitin site coverage, quantitative reproducibility, and experimental efficiency compared to traditional urea-based methods. When integrated with DIA mass spectrometry and specialized data processing tools like DIA-NN, this sample preparation breakthrough enables unprecedented depth and precision in profiling ubiquitin signaling dynamics. For researchers and drug development professionals investigating targeted protein degradation, deubiquitinase inhibitors, or systems-level ubiquitin signaling, adopting this optimized workflow provides a compelling alternative to conventional approaches, particularly when studying limited sample material or requiring high temporal resolution. As mass spectrometry technologies continue evolving with instruments like the Orbitrap Astral further improving DIA performance [6], the synergies between optimized sample preparation and advanced acquisition strategies will undoubtedly drive the next wave of discoveries in ubiquitin biology and therapeutic development.
Protein ubiquitination is a fundamental post-translational modification (PTM) involved in virtually all cellular processes, from cell cycle regulation to protein degradation. Mass spectrometry (MS)-based proteomics has become the primary method for system-wide ubiquitinome profiling, primarily through the immunopurification of tryptic peptides containing a K-ε-diglycine (diGly) remnant—a signature of ubiquitination. The depth and accuracy of these analyses heavily depend on the acquisition method and the comprehensiveness of spectral libraries used for peptide identification [5] [8] [27].
The ongoing methodological evolution in this field centers on the comparison between data-dependent acquisition (DDA) and data-independent acquisition (DIA) mass spectrometry. While DDA has been widely used for ubiquitinome studies, it faces challenges with low stoichiometry of ubiquitination, requiring large sample amounts and extensive fractionation at the expense of throughput and quantitative accuracy [5]. DIA has emerged as a compelling alternative that promises greater data completeness across samples, more precise quantification, and higher identification rates over a larger dynamic range [5] [28]. This guide objectively compares these approaches within the specific context of building extensive diGly peptide spectral libraries, presenting experimental data and optimized protocols to inform researchers and drug development professionals.
DIA vs. DDA: A Paradigm Shift in Ubiquitinome Analysis
Fundamental Technical Differences
The core distinction between DDA and DIA lies in how they select peptides for fragmentation:
- Data-Dependent Acquisition (DDA): Operates through intensity-based precursor selection, where the mass spectrometer selects the most abundant peptide ions in real-time for fragmentation. This semi-stochastic sampling can lead to inconsistent identification of low-abundance peptides across replicate runs [28] [8].
- Data-Independent Acquisition (DIA): Systematically fragments all co-eluting peptide ions within predefined mass-to-charge (m/z) windows, acquiring them simultaneously. This creates comprehensive, reproducible fragmentation maps with significantly fewer missing values across samples [5].
Performance Comparison in Ubiquitinome Profiling
Recent benchmarking studies directly comparing DIA and DDA for ubiquitinome analysis reveal striking performance differences. When applied to proteasome inhibitor-treated cells, optimized DIA workflows more than triple identification numbers compared to state-of-the-art label-free DDA—increasing from approximately 21,434 to 68,429 diGly peptides in single MS runs [8]. This substantial improvement in coverage is coupled with enhanced quantitative precision, with DIA demonstrating median coefficients of variation (CVs) of about 10% for quantified diGly peptides [8].
The table below summarizes key performance metrics from direct comparative studies:
Table 1: Direct Performance Comparison of DIA vs. DDA for Ubiquitinome Analysis
| Performance Metric | Data-Dependent Acquisition (DDA) | Data-Independent Acquisition (DIA) | Improvement Factor |
|---|---|---|---|
| Typical diGly Peptide IDs (single shot) | ~21,400 peptides [8] | ~68,400 peptides [8] | >3x increase |
| Quantitative Precision (median CV) | Higher variability [5] [8] | ~10% CV [8] | Significantly improved |
| Data Completeness (across replicates) | ~50% without missing values [8] | >68,000 peptides in ≥3 replicates [8] | Dramatically enhanced |
| Coverage of DDA Identifications | Baseline (100%) | 88% of DDA IDs also detected [8] | Excellent overlap |
For building comprehensive spectral libraries, DIA's advantage extends beyond single-run analysis. When creating deep spectral libraries, DIA-based approaches have enabled the identification of 93,684 unique diGly peptides from multiple cell lines and conditions, representing one of the deepest diGly proteomes compiled to date [5].
Experimental Workflow: Building >90,000 diGly Peptide Spectral Libraries
Comprehensive Library Generation Strategy
Building spectral libraries containing >90,000 diGly peptides requires a multi-faceted approach that incorporates diverse biological samples and sophisticated fractionation techniques. The most successful strategy involves:
- Diverse Sample Preparation: Combining multiple cell lines (e.g., HEK293 and U2OS) treated with proteasome inhibitors (e.g., MG132) to enhance ubiquitinated peptide representation, along with unperturbed systems to capture endogenous ubiquitination events [5].
- Advanced Peptide Fractionation: Implementing basic reversed-phase (bRP) chromatography to separate peptides into 96 fractions, which are then concatenated into 8-9 pooled fractions to reduce complexity while maintaining depth [5].
- Specialized Handling of Abundant Peptides: Separate processing of fractions containing highly abundant K48-linked ubiquitin-chain derived diGly peptides to prevent competition for antibody binding sites during enrichment [5].
- diGly Peptide Enrichment: Using anti-diGly antibodies to specifically immunopurify ubiquitinated peptides from each fraction prior to MS analysis [5].
This comprehensive approach, when applied across multiple cell types and conditions, successfully identified 89,650 diGly sites corresponding to 93,684 unique diGly peptides, with 43,338 detected in at least two libraries—ensuring robust representation of ubiquitination events [5].
Optimized DIA Method for diGly Peptide Analysis
Implementing DIA for ubiquitinome analysis requires method optimization tailored to the unique characteristics of diGly peptides. Key optimizations include:
- Precursor Isolation Windows: Adjusting DIA window widths guided by empirical precursor distributions, resulting in a 6% improvement in diGly peptide identifications [5].
- Scan Settings: Employing relatively high MS2 resolution (30,000) with 46 precursor isolation windows to balance data quality with sufficient cycle time for chromatographic peak sampling [5].
- Sample Input Optimization: Determining that enrichment from 1 mg of peptide material using 31.25 μg of anti-diGly antibody provides optimal yield and coverage for endogenous cellular levels [5].
- Spectral Library Generation: Creating hybrid spectral libraries by merging DDA libraries with direct DIA search results, enabling identification of approximately 35,000 diGly sites in single measurements—doubling previous reports for single-run formats [5].
The complete workflow for building comprehensive spectral libraries and applying them to single-shot DIA analysis is illustrated below:
Diagram 1: Workflow for comprehensive spectral library generation and application. This integrated strategy combines deep fractionation for library building with optimized single-shot DIA analysis for high-throughput ubiquitinome profiling.
Comparative Analysis of DIA Data Processing Tools
Software Performance for Ubiquitinome DIA Data
The computational processing of DIA data significantly impacts the depth and quality of ubiquitinome analysis. Recent benchmarking studies evaluating four commonly used software suites (DIA-NN, Spectronaut, MaxDIA, and Skyline) reveal distinct performance characteristics:
Table 2: Performance Comparison of DIA Software Tools for Ubiquitinome Analysis
| Software Tool | Optimal Library Strategy | Typical Proteome Coverage | Key Strengths for Ubiquitinomics | Considerations |
|---|---|---|---|---|
| DIA-NN | In silico/library-free mode [28] [8] | ~5,186 mouse proteins (HF); ~7,128 (TIMS) [28] | Specialized scoring for modified peptides [8]; Excellent quantitative precision [8] | Open access; High performance with complex samples |
| Spectronaut | Software-specific DDA-dependent libraries [28] | ~5,354 mouse proteins (HF); ~7,116 (TIMS) [28] | Versatile options; Hybrid library construction [28] | Commercial license required; User-friendly interface |
| MaxDIA | Integrated into MaxQuant environment [28] | Lower coverage than DIA-NN/Spectronaut [28] | End-to-end workflow; Reliable FDR control [28] | Part of MaxQuant ecosystem |
| Skyline | Universal libraries [28] | Lowest coverage of the four tools [28] | Targeted data analysis; Flexible visualization [27] | Less suitable for discovery applications |
For ubiquitinome analysis specifically, DIA-NN demonstrates particular advantages due to its additional scoring module that ensures confident identification of modified peptides, including K-GG peptides [8]. When processing the same dataset, DIA-NN identified approximately 40% more diGly peptides compared to other software tools [8].
Spectral Library Types and Their Applications
The performance of DIA analysis is intrinsically linked to the spectral libraries used for peptide identification. Researchers can select from several library generation approaches:
- Project-Specific DDA Libraries: Built from DDA data acquired on pre-fractionated samples or repeated injections, offering high specificity but requiring substantial measurement time [28].
- Hybrid Libraries: Constructed by combining project-specific DDA libraries with directDIA libraries built from DIA data alone, balancing comprehensiveness and project-specificity [28].
- In Silico Libraries: Generated through predictions of fragment ion intensity and retention time using deep learning tools, eliminating the need for experimental DDA measurements and facilitating library-free analysis [28].
Notably, for global ubiquitinome profiling, DIA-NN using an in silico library covered 94.3% of proteins identified by itself with a universal library, demonstrating the power of computational approaches for comprehensive ubiquitinome analysis [28].
Advanced Applications in Drug Discovery and Development
Targeting Deubiquitinases (DUBs) for Therapeutic Intervention
The enhanced sensitivity and throughput of optimized DIA ubiquitinome workflows have enabled sophisticated applications in drug discovery, particularly for profiling compounds targeting deubiquitinases (DUBs). When applied to USP7 inhibition—an actively investigated anticancer drug target—high-temporal-resolution DIA ubiquitinome profiling simultaneously recorded ubiquitination changes and abundance changes for more than 8,000 proteins [8].
This approach revealed that while ubiquitination of hundreds of proteins increased within minutes of USP7 inhibition, only a small fraction of those targets underwent degradation, thereby distinguishing regulatory ubiquitination events leading to protein degradation from non-degradative events [8]. Such precise mode-of-action profiling provides critical insights for developing DUB-targeted therapeutics.
Supporting PROTAC Development and Target Engagement Studies
Proteolysis-Targeting Chimeras (PROTACs) represent a promising therapeutic modality that leverages the ubiquitin-proteasome system to degrade disease-causing proteins. Comprehensive ubiquitinome profiling using DIA-MS offers powerful capabilities for:
- Monitoring Target Engagement: Precisely quantifying ubiquitination and degradation of target proteins in response to PROTAC treatment [29] [30].
- Identifying Off-Target Effects: System-wide screening to detect unintended ubiquitination events or protein degradation [30].
- Kinetic Profiling: Tracking the dynamics of ubiquitination and subsequent protein degradation over time [8].
The robustness of optimized DIA workflows enables screening of hundreds of samples per day with full proteome coverage, making it suitable for the high-throughput screening requirements of drug development pipelines [30].
Essential Research Reagent Solutions
Successful implementation of deep ubiquitinome profiling requires specific reagents and tools. The following table summarizes key solutions used in the featured experiments:
Table 3: Essential Research Reagents for Comprehensive Ubiquitinome Studies
| Reagent/Tool | Specific Function | Application Notes | Representative Examples |
|---|---|---|---|
| Anti-diGly Antibodies | Immunoaffinity purification of ubiquitinated peptides | Critical for enrichment; Commercial kits available [5] | PTMScan Ubiquitin Remnant Motif Kit [5] |
| Proteasome Inhibitors | Enhance ubiquitinated peptide detection by blocking degradation | MG132 treatment commonly used [5] [8] | MG132 (10 µM, 4h treatment) [5] |
| Cell Lysis Buffers | Protein extraction while preserving ubiquitination states | SDC-based lysis with chloroacetamide improves coverage [8] | Sodium deoxycholate (SDC) buffer with CAA [8] |
| Chromatography Columns | Peptide fractionation for deep library generation | Basic reversed-phase separation into 96 fractions [5] | High pH reversed-phase columns [5] |
| DIA Software Suites | Data processing and ubiquitinated peptide identification | Varied performance characteristics [28] | DIA-NN, Spectronaut, MaxDIA, Skyline [28] |
| Ubiquitin Binding Domains | Alternative enrichment strategies for specific applications | ThUBD-coated plates for high-throughput screening [29] | Tandem Hybrid Ubiquitin Binding Domain (ThUBD) [29] |
The evolution of fractionation strategies and DIA-MS methodologies has dramatically advanced the scale and precision of ubiquitinome analysis. The implementation of comprehensive spectral libraries containing >90,000 diGly peptides, coupled with optimized DIA acquisition and processing methods, enables the routine identification of 35,000+ diGly sites in single measurements—doubling what was previously possible with DDA approaches [5].
For researchers and drug development professionals, these technological advances translate to tangible benefits: more robust quantification, higher throughput capability, and greater confidence in identifying biologically and therapeutically relevant ubiquitination events. As DIA methodologies continue to mature and computational tools become more sophisticated, we anticipate further improvements in ubiquitinome coverage, particularly for low-abundance regulatory events and complex ubiquitin chain architectures.
The strategic integration of deep spectral libraries with optimized DIA workflows represents the current state-of-the-art for system-wide ubiquitin signaling profiling, offering unprecedented insights into this complex post-translational regulatory system and accelerating the development of therapeutics targeting the ubiquitin-proteasome system.
Ubiquitination, a crucial post-translational modification, regulates virtually all cellular processes including protein degradation, activity, and localization. The ubiquitin-proteasome system (UPS) mediates 80%-85% of protein degradation in eukaryotic organisms, and dysregulation can lead to diseases such as cancer [31]. Traditional mass spectrometry approaches for ubiquitinome analysis, particularly data-dependent acquisition (DDA), have faced limitations in sensitivity, reproducibility, and coverage. Data-independent acquisition (DIA) has emerged as a transformative alternative, systematically fragmenting and analyzing all detectable peptides within predefined mass-to-charge (m/z) ranges rather than selecting only the most abundant ions [7]. This fundamental shift in acquisition strategy enables unprecedented depth and precision in ubiquitinome profiling, opening new avenues for biological discovery from circadian regulation to therapeutic target validation.
Technical Comparison: DIA Versus DDA for Ubiquitinome Analysis
Fundamental Acquisition Differences
The core distinction between DIA and DDA lies in their approach to peptide fragmentation. In DDA, the mass spectrometer alternates between full-range survey scans and narrow-range scans that isolate a limited subset of co-eluting peptides based on intensity, inherently biasing acquisition toward abundant species [6]. Conversely, DIA uses wider isolation windows to capture and fragment a broad range of co-eluting peptides simultaneously, generating comprehensive fragmentation data from all detectable analytes without intensity-based preselection [6]. This fundamental difference enables DIA to overcome the stochastic sampling limitations and missing value problems that plague DDA in large sample series [13].
Performance Benchmarking in Ubiquitinome Studies
Recent studies directly comparing DIA and DDA for ubiquitinome profiling demonstrate DIA's substantial advantages across multiple performance metrics, as summarized in Table 1.
Table 1: Performance Comparison of DIA vs. DDA in Ubiquitinome Analysis
| Performance Metric | Data-Dependent Acquisition (DDA) | Data-Independent Acquisition (DIA) | Improvement Factor | Citation |
|---|---|---|---|---|
| Identified diGly Peptides (single run) | 20,000 | 35,000-68,000 | 1.75x - 3.4x | [12] [13] |
| Quantitative Reproducibility (CV < 20%) | 15% of peptides | 45% of peptides | 3x | [12] |
| Data Completeness (across replicates) | 42% - 69% | 78.7% - 93% | 1.6x - 1.9x | [32] [6] |
| Protein Groups Quantified (mouse liver) | 2,500 - 3,600 | 10,000+ | ~3x | [6] |
DIA achieves significantly higher identification numbers, with one study reporting over 68,000 ubiquitinated peptides in single runs compared to 21,434 with DDA – more than a threefold increase [13]. Quantitative precision is markedly enhanced, with coefficients of variation (CVs) for DIA typically around 10% compared to 17-22% for DDA [32]. This reproducibility is crucial for detecting subtle biological changes in time-series experiments. Additionally, DIA provides superior data completeness with fewer missing values across sample replicates (93% vs. 69% in one direct comparison), enabling more robust statistical analysis [6].
Experimental Protocols for DIA-Based Ubiquitinome Profiling
Optimized Sample Preparation Workflow
Robust ubiquitinome profiling requires specialized sample preparation to address the low stoichiometry of ubiquitination. Key methodological advances include:
SDC-Based Lysis Protocol: Replacing conventional urea buffer with sodium deoxycholate (SDC) supplemented with chloroacetamide (CAA) increases ubiquitin site coverage by 38% while maintaining enrichment specificity. Immediate sample boiling after lysis with high CAA concentrations rapidly inactivates cysteine ubiquitin proteases, preserving ubiquitination states [13].
K48-Peptide Separation: For proteasome inhibitor-treated samples, separating fractions containing highly abundant K48-linked ubiquitin-chain derived diGly peptides reduces competition for antibody binding sites during enrichment, significantly improving detection of co-eluting peptides [12].
Input and Antibody Optimization: Titration experiments establish 1mg peptide material with 31.25μg anti-diGly antibody as optimal, with only 25% of enriched material required for injection due to DIA's enhanced sensitivity [12].
DIA Method Optimization for Ubiquitinome Analysis
Standard DIA methods require modification to address unique properties of diGly peptides. Impeded C-terminal cleavage of modified lysine residues generates longer peptides with higher charge states, necessitating:
Custom Window Schemes: Optimized DIA window widths based on empirical precursor distributions increase identified diGly peptides by 6% [12].
Scan Parameters: Methods with 46 precursor isolation windows and MS2 resolution of 30,000 strike the optimal balance between data quality and cycle time, improving identifications by 13% compared to standard proteome methods [12].
Figure 1: Optimized DIA Ubiquitinome Workflow integrating improved sample preparation with tailored mass spectrometry acquisition and data analysis.
Data Processing Strategies
Advanced computational tools are essential for DIA data analysis. The DIA-NN software package, enhanced with specialized scoring modules for modified peptides, enables confident identification of K-GG peptides [13]. Library-free analysis (searching against sequence databases without experimental spectral libraries) performs comparably to library-based approaches, quantifying approximately 68,000 ubiquitinated peptides with median CVs of 10% [13].
Biological Applications: From Circadian Rhythms to USP7 Inhibition
Systems-Wide Investigation of Circadian Ubiquitination
Applying DIA-based ubiquitinome profiling to circadian biology reveals unprecedented dynamics. A comprehensive analysis across the circadian cycle uncovered hundreds of cycling ubiquitination sites and dozens of cycling ubiquitin clusters within individual membrane protein receptors and transporters [12]. This highlights new connections between metabolic regulation and circadian timing that were previously inaccessible with DDA methods. The improved quantitative accuracy and data completeness of DIA enabled detection of these subtle but biologically crucial oscillations, demonstrating how ubiquitination dynamics may contribute to circadian protein regulation beyond transcriptional control.
Figure 2: Biological Applications of DIA Ubiquitinome Profiling revealing novel insights into circadian regulation and USP7 function.
High-Resolution Profiling of USP7 Inhibition
DIA enables unprecedented temporal resolution in mapping deubiquitinase function. Following USP7 inhibition, simultaneous monitoring of ubiquitination changes and corresponding protein abundance alterations for over 8,000 proteins revealed that while ubiquitination of hundreds of proteins increases within minutes, only a small fraction undergo degradation [13]. This critical distinction between degradative and non-degradative ubiquitination events provides fundamental insights into USP7's mechanism of action and potential therapeutic applications. The method's precision facilitated rapid mode-of-action profiling for this oncology drug target, demonstrating DIA's value in pharmaceutical development.
Essential Research Reagents and Tools
Table 2: Essential Research Reagents for DIA Ubiquitinome Profiling
| Reagent/Resource | Function | Application Notes |
|---|---|---|
| Anti-diGly Antibody | Immunoaffinity enrichment of K-GG remnant peptides | Critical for specificity; 31.25μg per 1mg peptide input optimal [12] |
| SDC Lysis Buffer | Protein extraction with protease inhibition | Superior to urea; supplement with CAA for immediate cysteine protease inactivation [13] |
| Chloroacetamide (CAA) | Cysteine alkylation | Preferred over iodoacetamide to avoid di-carbamidomethylation artifacts [13] |
| Proteasome Inhibitors (e.g., MG132) | Block proteasomal degradation | Enhances ubiquitinated peptide detection; requires K48-peptide separation [12] |
| High-pH Reversed-Phase Chromatography | Peptide fractionation for library generation | 96 fractions concatenated to 8 for comprehensive spectral libraries [12] |
| DIA-NN Software | Data processing with neural networks | Specialized scoring for K-GG peptides; library-free and library-based analysis [13] |
DIA mass spectrometry represents a paradigm shift in ubiquitinome research, enabling biological discovery at unprecedented depth and precision. The technical advantages of DIA – including tripled identification rates, superior quantitative reproducibility, and enhanced data completeness – translate directly into advanced biological insights, from the intricate ubiquitination dynamics governing circadian cycles to the rapid substrate profiling of therapeutic targets like USP7. As instrumentation and computational tools continue to evolve, DIA-based ubiquitinome profiling is poised to become the gold standard for investigating ubiquitin signaling in health and disease, offering researchers a powerful platform for comprehensive system-wide analysis.
Data-Independent Acquisition (DIA) mass spectrometry has revolutionized proteomic analysis by systematically fragmenting and analyzing all detectable ions within defined mass windows, eliminating the stochastic sampling limitations of traditional Data-Dependent Acquisition (DDA) approaches [7]. This fundamental shift in acquisition strategy generates highly complex datasets that require sophisticated computational processing, leading to two predominant analytical workflows: library-based and library-free DIA analysis [33]. The choice between these strategies significantly impacts proteome coverage, quantification accuracy, experimental flexibility, and resource allocation, making the selection critical for project success.
Within the broader context of DIA versus DDA mass spectrometry for ubiquitinome analysis, understanding these analytical pathways becomes particularly crucial. Post-translational modification profiling, including ubiquitination, demands high sensitivity and reliable quantification across diverse sample types [6]. This comparative guide examines both library-based and library-free DIA strategies through experimental data, performance benchmarks, and practical implementation protocols to empower researchers in selecting optimal methodologies for specific research scenarios in drug development and clinical proteomics.
Fundamental Principles: Library-Based and Library-Free DIA
Library-Based DIA Analysis
Library-based DIA relies on empirically derived spectral libraries that serve as reference maps for peptide identification and quantification [33]. These comprehensive catalogs contain peptide fragmentation patterns generated through prior high-quality Data-Dependent Acquisition (DDA) experiments, capturing precursor and fragment ion profiles under optimized LC-MS conditions with retention time calibration using internal iRT standards [33]. The analytical process matches complex DIA fragment spectra against library entries based on precursor m/z, retention time, and fragment ion intensity patterns using sophisticated scoring algorithms such as mProphet or Pulsar [33].
Spectral libraries vary in origin and specificity, with researchers selecting from three primary types according to project requirements and resource availability. Public spectral libraries (e.g., SWATHAtlas) offer cost-efficient solutions for common species or tissues but lack biological context specificity [33]. Project-specific libraries, built from matched DDA data through rigorous QC protocols, provide maximal depth and biological relevance but require additional instrument time and sample material [33]. Hybrid strategies combine public libraries with project-derived DDA data to balance coverage, cost, and timeline constraints [33].
Library-Free DIA Analysis
Library-free DIA, also termed directDIA or library-independent DIA, eliminates the need for separate DDA runs by computationally inferring peptide identities directly from DIA data [33]. This approach leverages sophisticated algorithms, often incorporating deep learning models, to predict peptide fragmentation patterns, retention times, and detectability scores based solely on amino acid sequences [33]. The analytical workflow processes raw DIA data through in silico spectral prediction engines that simulate spectra from sequence databases, match observed ion traces to predicted profiles, and score identifications using statistical models [33].
Multiple software platforms implement library-free analysis through different computational strategies. DIA-NN combines deep neural networks with fast spectral deconvolution, enabling high-throughput analysis with exceptional identification rates [33]. MSFragger-DIA + FragPipe utilizes open search methodology to discover unexpected post-translational modifications and tolerates wide precursor windows [33]. Prosit-enabled workflows leverage trained neural networks to generate highly accurate fragment ion intensity patterns and retention time predictions, while Spectronaut's directDIA workflow implicitly generates spectral libraries from the DIA data itself [33] [34]. MaxDIA performs discovery DIA through accurate false discovery rate estimates on both library-to-DIA match and protein levels, including when using whole-proteome predicted spectral libraries [35].
Figure 1: Comparative Workflows for Library-Based and Library-Free DIA Analysis. Library-based approaches (top) require separate DDA runs to construct empirical spectral libraries before DIA data analysis, while library-free methods (bottom) utilize computational prediction for direct DIA data processing.
Strategic Comparison and Performance Benchmarking
Direct Comparative Analysis of Key Features
The selection between library-based and library-free DIA strategies involves balancing multiple factors including experimental constraints, project goals, and available resources. The table below summarizes the core differentiating characteristics of each approach based on comprehensive benchmarking studies and implementation reports.
Table 1: Strategic Feature Comparison Between Library-Based and Library-Free DIA Approaches
| Feature | Library-Based DIA | Library-Free DIA |
|---|---|---|
| Prior DDA Requirement | Required for library generation | Not required |
| Spectral Library Source | Project-specific or public DDA data | Inferred via computational algorithm |
| Initial Setup Time | Longer (DDA acquisition + QC) | Shorter |
| Sample Demand | Higher (≥2 runs/sample for library) | Lower |
| Ideal Project Type | Targeted validation, pathway-focused studies | Discovery studies, large-scale profiling |
| Organism Compatibility | Well-characterized species | Broad, including novel/non-model organisms |
| Flexibility to Method Changes | Limited (may require new library) | High |
| Common Software Options | Spectronaut, Skyline, Scaffold DIA | DIA-NN, FragPipe, MSFragger, MaxDIA |
| Identification Specificity | Very high (empirical matching) | High (model prediction, QC-dependent) |
| Low-Abundance Protein Detection | Excellent if represented in library | Moderate unless extensively optimized |
| Panel Customization Support | Strong for preselected targets | Good for flexible post hoc selection |
| QC Interpretation Complexity | Lower | Higher (due to computational inference) |
Quantitative Performance Benchmarking Across Multiple Studies
Independent benchmarking studies across diverse sample types and instrumentation platforms provide critical performance metrics for informed strategy selection. The following table synthesizes quantitative results from multiple published comparisons, highlighting key differences in proteome coverage, reproducibility, and quantification performance.
Table 2: Experimental Performance Metrics from DIA Benchmarking Studies
| Performance Metric | Library-Based DIA | Library-Free DIA | Experimental Context |
|---|---|---|---|
| Protein Identifications | Up to 3,566 proteins | 2,753-3,066 proteins | Single-cell level proteomics (200pg input) [34] |
| Data Completeness | 57% proteins across all runs | 48% proteins across all runs | Single-cell level proteomics (Spectronaut vs DIA-NN) [34] |
| Quantification Precision (Median CV) | 22.2-24.0% (Spectronaut) | 16.5-18.4% (DIA-NN) | Single-cell level proteomics [34] |
| Quantitative Accuracy | Moderate | Higher for some software | Ground-truth spike-in studies [34] |
| Tear Fluid Proteome Coverage | 701 proteins (DIA overall) | 396 proteins (DDA for library) | Tear fluid analysis with Schirmer strips [25] |
| Technical Variation (CV) | 9.8% median protein CV | 17.3% median protein CV | Tear fluid replicates [25] |
Recent benchmarking studies reveal nuanced performance differences between library-based and library-free DIA workflows. In single-cell proteomics applications with minimal sample input (200pg), library-free approaches demonstrated advantages in quantitative precision, with DIA-NN showing median coefficients of variation (CV) of 16.5-18.4% compared to 22.2-24.0% for Spectronaut's library-based approach [34]. However, library-based methods maintained superior data completeness, with 57% of proteins identified across all replicates compared to 48% for library-free DIA-NN analysis [34].
In specialized applications like tear fluid proteomics, DIA methodologies overall significantly outperformed traditional DDA approaches, identifying 701 unique proteins compared to 396 with DDA while demonstrating markedly improved reproducibility (median CV of 9.8% for proteins vs. 17.3% for DDA) [25]. This demonstrates DIA's substantial advantages for complex biological samples regardless of the specific analytical workflow employed.
Experimental Protocols and Implementation Guidelines
Detailed Methodologies for Key Experimental Setups
Spectral Library Construction for Targeted Ubiquitinome Analysis: For library-based DIA investigating ubiquitination sites, project-specific spectral libraries yield optimal results. Begin with 500μg of protein extract per sample condition, performing tryptic digestion followed by ubiquitin remnant motif antibody enrichment (e.g., Cell Signaling Technology #5562). Separate enriched peptides using high-pH reversed-phase fractionation into 24 fractions, analyzing each via DDA on a Q-Exactive HF or Orbitrap Lumos mass spectrometer with 120-minute gradients [6]. Process raw files through MaxQuant or FragPipe to generate an initial identification list, then curate the library to include only ubiquitinated peptides with posterior error probability (PEP) scores <0.01.
Library-Free DIA for Large-Scale Ubiquitinome Profiling: For discovery-phase ubiquitinome analysis without prior library generation, utilize DIA-NN or MaxDIA software environments. Prepare samples as above with ubiquitin enrichment, but proceed directly to DIA acquisition using 30-60 variable windows optimized for your instrument's m/z range [33]. For Orbitrap Astral platforms, employ 45-minute gradients with 1μg peptide load [6]. In DIA-NN, enable "deep learning-based spectra prediction" and "match-between-runs" while setting protein false discovery rate (FDR) to 1% at both peptide and protein levels [34]. For MaxDIA, activate the "bootstrap DIA" workflow with three rounds of matching with increasing stringency [35].
Cross-Platform Single-Cell Proteomics Protocol: For limited samples simulating single-cell proteomics, prepare hybrid proteome samples consisting of tryptic digests of human HeLa cells, yeast, and Escherichia coli proteins with different composition ratios (e.g., 50% human, 25% yeast, 25% E. coli) at 200pg total input [34] [36]. Analyze using diaPASEF on a timsTOF Pro 2 mass spectrometer with six technical replicates. Process data through both library-based (Spectronaut with project-specific library) and library-free (DIA-NN with predicted library) workflows for comparative analysis [34].
Research Reagent Solutions for DIA Proteomics
Table 3: Essential Research Reagents and Materials for DIA Proteomics Workflows
| Reagent/Material | Function | Example Applications |
|---|---|---|
| Ubiquitin Remnant Motif Antibody | Immunoaffinity enrichment of ubiquitinated peptides | Ubiquitinome profiling for target identification |
| iRT Kit (Biognosys) | Retention time calibration standard | Spectral library alignment and cross-run normalization |
| Trypsin/Lys-C Mix (Promega) | Protein digestion with high specificity and efficiency | Sample preparation for bottom-up proteomics |
| High-pH Reversed-Phase Fractionation Kit | Peptide fractionation for deep coverage | Library generation for comprehensive spectral libraries |
| TMTpro 16/18-Plex (Thermo) | Multiplexed quantification for increased throughput | Experimental designs with multiple conditions |
| S-Trap or StageTip Columns | Sample cleanup and desalting | Preparation of MS-ready peptides from complex lysates |
Software Tool Landscape and Performance Characteristics
The DIA software ecosystem has evolved substantially, with multiple platforms offering distinct advantages for different experimental scenarios. Recent benchmarking studies reveal that software selection significantly impacts proteomic depth and quantification quality, sometimes exceeding the differences between library-based and library-free approaches [37] [34].
Spectronaut excels in proteome coverage, particularly in library-based mode with project-specific libraries, quantifying 3,066±68 proteins in single-cell level analyses compared to 2,753±47 for PEAKS and lower numbers for DIA-NN [34]. Its directDIA workflow (library-free) also demonstrated superior detection capabilities, identifying 11-23% more proteins than competing solutions [34]. However, Spectronaut exhibited higher quantitative variability (median CV 22.2-24.0%) compared to DIA-NN (16.5-18.4%) in the same study [34].
DIA-NN provides exceptional quantitative precision and computational efficiency, particularly in library-free mode where it leverages deep learning-based spectral prediction [33] [34]. Its performance advantages are most pronounced in large-scale studies involving hundreds of samples, where its speed and robust false discovery rate control deliver reliable results [33]. Benchmarking reveals DIA-NN's particular strength in quantitative accuracy, outperforming other tools in ground-truth spike-in experiments [34].
MaxDIA introduces the innovative "bootstrap DIA" workflow, performing multiple rounds of matching with increasing quality of recalibration and stringency [35]. This approach enables reliable false discovery rate control in discovery DIA mode without spectral libraries, addressing a critical challenge in library-free analyses [35]. MaxDIA's integration with the established MaxQuant environment provides a unified solution for both DDA and DIA data analysis [35].
Figure 2: DIA Software Landscape and Characteristic Strengths. Software tools specialize in different performance aspects, with some excelling in proteome coverage (Spectronaut), quantitative precision (DIA-NN), discovery mode analysis (MaxDIA), or PTM detection (MSFragger).
Application Scenarios and Strategic Recommendations
Optimal Use Cases for Library-Based DIA
Library-based DIA delivers superior performance in scenarios where maximum quantification precision and identification confidence are paramount. This approach is particularly advantageous for targeted validation studies, such as confirming biomarker candidates from prior discovery experiments or RNA-seq findings [33]. When working with well-characterized model organisms or tissues where comprehensive spectral libraries exist, library-based methods leverage these resources for deep, reproducible proteome coverage [37].
Pathway-focused studies investigating predefined protein sets, such as kinase families, transcription factors, or specific post-translational modifications including ubiquitination, benefit substantially from library-based approaches [33]. The empirical spectral matching provides high specificity for distinguishing closely related proteoforms and modified peptides. In regulated environments like pharmaceutical development, where fixed methods and rigorous QC are mandatory, library-based DIA offers the methodological consistency required for compliance [33].
Exemplar Scenario: Quantifying a predefined panel of neuroinflammatory markers across treated versus untreated brain samples in a preclinical model, where 20-30 specific proteins require precise measurement across hundreds of samples with minimal missing data [33].
Ideal Applications for Library-Free DIA
Library-free DIA excels in discovery-phase research where experimental flexibility and broad proteome interrogation are prioritized. This approach is particularly valuable when studying poorly characterized biological systems, such as tumor microenvironments, microbiome proteomics, or host-pathogen interactions [33]. For novel or non-model organisms without existing spectral resources, library-free methods bypass the dependency on reference spectra that constrains library-based approaches [33].
Large-scale cohort studies involving hundreds of samples, such as clinical patient populations, time-course experiments, or drug screening assays, benefit from library-free DIA's computational efficiency and streamlined workflow [33]. When sample material is severely limited, as with FFPE slices, organoid lysates, or microdissected tissues, library-free analysis eliminates the need for dedicating precious material to library generation [33]. The flexibility to modify LC gradients, MS parameters, or experimental conditions without regenerating spectral libraries makes library-free DIA ideal for method development and optimization phases [33].
Exemplar Scenario: Performing discovery ubiquitinome profiling on 40 patient-derived tumor samples to identify differential ubiquitination patterns associated with treatment response, where prior knowledge of relevant targets is limited [33].
Emerging Applications in Single-Cell and Clinical Proteomics
Advanced DIA applications in single-cell proteomics and clinical sample analysis demonstrate the evolving capabilities of both analytical strategies. In single-cell proteomics, where sample input is extremely limited (200pg or less), library-free approaches have shown advantages in quantitative accuracy, while library-based methods provide superior data completeness when comprehensive libraries are available [34] [36]. The unique challenges of single-cell data, including increased missing values and blurred signal-to-background boundaries, necessitate specialized informatics workflows regardless of analytical approach [34].
For clinical applications requiring robust analysis of patient-derived specimens, DIA methodologies overall provide exceptional quantitative reproducibility and reduced missing values compared to DDA [17]. Library-free approaches offer practical advantages in clinical settings where sample acquisition is unpredictable and batch effects must be minimized across large, longitudinally collected sample sets [17]. However, library-based methods deliver the exceptional reproducibility required for diagnostic applications when standardized spectral libraries are available [17].
The strategic selection between library-based and library-free DIA analysis depends fundamentally on research objectives, sample characteristics, and available resources. Library-based approaches provide superior quantification precision, identification confidence, and data completeness when comprehensive spectral libraries are available or can be practically constructed [33] [37]. Library-free methods offer unprecedented experimental flexibility, computational efficiency, and applicability to novel biological systems without prerequisite spectral resources [33] [35].
For ubiquitinome analysis specifically, library-based DIA delivers optimal performance for targeted validation of specific ubiquitination sites or pathways, while library-free approaches enable unbiased discovery of novel ubiquitination events across diverse biological contexts [33]. The ongoing development of sophisticated computational tools, including deep learning-based spectral prediction and enhanced false discovery rate control, continues to narrow the performance gap between these strategies [35] [34].
Future directions in DIA methodology include improved integration of ion mobility information, enhanced PTM characterization capabilities, and streamlined workflows for clinical translation [17]. As mass spectrometry instrumentation advances with platforms like the Orbitrap Astral providing orders-of-magnitude improvement in sensitivity and speed, both library-based and library-free DIA analyses will continue to expand the boundaries of proteomic investigation, enabling deeper characterization of complex biological systems including the ubiquitinome [6].
Protein ubiquitination is a crucial reversible post-translational modification that regulates virtually all cellular processes in eukaryotic cells, extending far beyond its original characterization as a marker for protein degradation [38]. This modification involves the covalent attachment of a small 8 kDa ubiquitin protein to target proteins, primarily through isopeptide bonds to lysine ε-amino groups, creating a tremendously diverse signaling system [38]. The functional consequences of ubiquitination are substantially more diverse than initially thought, encompassing protein trafficking, DNA repair, epigenetic regulation, mitophagy, and endocytosis [38]. Well-orchestrated spatio-temporal control of ubiquitination affects nearly every gene product in the proteome, making comprehensive ubiquitinome analysis essential for understanding cellular signaling networks.
Investigating the ubiquitination status of proteins presents significant challenges for researchers. Since proteins typically contain multiple potential ubiquitination sites and ubiquitin itself has seven lysine residues for chain elongation, proteins exist in numerous proteoforms due to their ubiquitination status [38]. Additionally, the relative stoichiometry of ubiquitination on substrate proteins is almost always well below 100%, creating substantial analytical hurdles [38]. Traditional data-dependent acquisition (DDA) mass spectrometry approaches have provided valuable insights but face limitations in depth, reproducibility, and quantitative accuracy for large-scale ubiquitinome profiling. This comparison guide examines how data-independent acquisition (DIA) mass spectrometry has emerged as a transformative technology that enables deep coverage in single-shot ubiquitinome experiments, revolutionizing our ability to study ubiquitin signaling at a systems level.
Fundamental Principles of Ubiquitinomics
The Ubiquitin Landscape and Analytical Targets
Ubiquitination comprises tremendous structural and functional diversity, providing multiple layers of potential regulation. Canonical ubiquitination proceeds through covalent attachment of ubiquitin to ε-NH2 groups of internal lysine residues on target proteins. Single ubiquitin modifications are defined as monoubiquitination, while modifications on two or more accessible lysine residues constitute multi-ubiquitination [38]. The initial ubiquitin provides seven lysine sites (K6, K11, K27, K29, K33, K48, and K63) for subsequent ubiquitin units, forming polyubiquitin chains defined by their linkage sites [38]. Combined activity of different E2 and E3 enzymes leads to either homomeric or heteromeric polyubiquitinated substrates, including mixed linkage chains and branched linkages where the substrate-proximal ubiquitin provides multiple branch sites [38].
Non-canonical ubiquitination occurs on amino acids other than lysine, including methionine, cysteine, serine, threonine, and protein N-termini [38]. Furthermore, ubiquitin itself undergoes various post-translational modifications including phosphorylation, acetylation, SUMOylation, neddylation, and ISGylation, adding another layer of complexity to ubiquitin signaling [38]. This remarkable diversity presents both opportunities and challenges for ubiquitinome analysis, requiring sophisticated analytical approaches to decipher the specific nature and functional roles of individual ubiquitination events.
Mass spectrometry-based detection of ubiquitination primarily relies on the diglycine (diGly) remnant approach. When trypsin digests ubiquitinated proteins, it cleaves both the protein substrate and the ubiquitin modification, leaving a characteristic diGly (GG) remnant on the lysine ε-NH2 group of the tryptic peptide [38]. This diGly signature serves as a specific marker for ubiquitination sites and can be targeted with specific antibodies for immunoaffinity enrichment prior to mass spectrometry analysis, dramatically improving detection sensitivity for low-abundance ubiquitinated peptides [39].
Mass Spectrometry Acquisition Strategies
Two primary mass spectrometry acquisition strategies dominate current ubiquitinomics research, each with distinct characteristics and applications:
Data-Dependent Acquisition (DDA) operates by selecting only the most abundant peptides (typically the "top N" precursors) for fragmentation during the second stage of tandem MS [40]. These selections are made in real-time based on signal intensity within narrow mass-to-charge (m/z) ranges. MS/MS data acquisition occurs sequentially for each selected peptide, and the resulting data are used to search existing protein databases [40]. While simpler to implement and less computationally intensive, DDA introduces selection bias toward higher-abundance peptides and suffers from lower precision and reproducibility compared to DIA [40].
Data-Independent Acquisition (DIA) takes a fundamentally different approach by systematically fragmenting and analyzing all peptides within predefined m/z windows without prior selection [40]. MS/MS data acquisition occurs in parallel across peptides, resulting in highly multiplexed MS2 spectra that comprehensively capture the peptide population [40]. This unbiased acquisition strategy eliminates the stochastic sampling inherent to DDA, providing higher precision, better reproducibility, and more complete data across complex sample series [41]. The trade-off involves more complex data analysis due to multiplexed spectra and higher computational demands [40].
Experimental Comparison: DIA Versus DDA Performance
Quantitative Performance Metrics
Rigorous experimental comparisons between DIA and DDA acquisition modes reveal dramatic differences in performance for ubiquitinome analysis. In a landmark study profiling ubiquitination dynamics following USP7 inhibition, researchers developed an optimized workflow combining sodium deoxycholate (SDC)-based lysis with DIA-MS and neural network-based data processing [41]. This approach more than tripled identification numbers to approximately 70,000 ubiquitinated peptides in single MS runs compared to DDA, while significantly improving robustness and quantification precision [41]. The median coefficient of variation (CV) for all quantified K-GG peptides was approximately 10%, with 68,057 peptides quantified in at least three replicates—demonstrating exceptional reproducibility [41].
Another comprehensive study developing a DIA method for ubiquitinome analysis achieved similar performance breakthroughs [5]. Using optimized Orbitrap-based DIA with comprehensive spectral libraries containing more than 90,000 diGly peptides, this workflow identified 35,000 diGly peptides in single measurements of proteasome inhibitor-treated cells—double the number and quantitative accuracy of data-dependent acquisition [5]. The DIA approach identified around 36,000 distinct diGly peptides across all replicates, with 45% exhibiting CVs below 20% and 77% below 50%, indicating excellent quantitative precision [5].
Table 1: Performance Comparison of DIA vs DDA in Ubiquitinome Analysis
| Performance Metric | Data-Dependent Acquisition (DDA) | Data-Independent Acquisition (DIA) | Improvement Factor |
|---|---|---|---|
| Identified Ubiquitinated Peptides | 21,434 peptides [41] | 68,429 peptides [41] | 3.2× |
| Quantitative Precision (Median CV) | ~20-30% [5] | ~10% [41] | 2-3× |
| Data Completeness | ~50% without missing values [41] | >95% without missing values [5] | ~2× |
| Reproducibility | Moderate [40] | Excellent [41] | Significant |
| Spectral Library Coverage | Limited to pre-identified peptides | 35,000+ sites from >90,000 library [5] | >2× |
Sample Input and Throughput Considerations
Sample requirements represent a critical practical consideration in experimental design for ubiquitinome studies. Traditional DDA approaches often require large protein inputs (frequently 2-4 mg) and extensive fractionation to achieve deep coverage, substantially limiting throughput [41] [5]. In contrast, optimized DIA workflows demonstrate excellent performance with substantially lower input requirements. Researchers have successfully quantified approximately 30,000 K-GG peptides from just 2 mg of protein input, with identification numbers dropping below 20,000 for inputs of 500 μg or less [41]. This enhanced sensitivity enables robust ubiquitinome profiling from more limited sample sources, including clinical specimens where material may be scarce.
Throughput advantages extend beyond sample input requirements to analysis time and robustness. The DIA workflow enables complete ubiquitinome analysis in single 75-125 minute LC-MS runs without extensive fractionation, while maintaining exceptional quantitative precision [41]. This streamlined approach makes DIA particularly suitable for time-series experiments and larger sample cohorts where consistency across measurements is essential. For example, in a study investigating ubiquitination across the circadian cycle, DIA enabled the comprehensive capture of hundreds of cycling ubiquitination sites and dozens of cycling ubiquitin clusters within individual membrane protein receptors and transporters [5].
Table 2: Sample Throughput and Experimental Requirements Comparison
| Experimental Parameter | Data-Dependent Acquisition (DDA) | Data-Independent Acquisition (DIA) | Practical Implications |
|---|---|---|---|
| Protein Input Requirements | 2-4 mg for deep coverage [41] | 0.5-2 mg for deep coverage [41] | DIA enables studies with limited samples |
| Fractionation Needs | Extensive (8-24 fractions) [5] | Minimal (single-shot) [41] | DIA dramatically increases throughput |
| Analysis Time per Sample | 2-24 hours with fractionation | 75-125 minutes single-shot [41] | 3-10× throughput improvement with DIA |
| Temporal Resolution | Limited by fractionation requirements | Suitable for high-resolution time courses [41] | DIA ideal for dynamic process capture |
| Clinical Application | Challenging due to sample needs | Feasible with typical clinical samples [42] | DIA enables translational ubiquitinomics |
Optimized Experimental Protocols for Deep Ubiquitinome Coverage
Sample Preparation and Lysis Optimization
Robust sample preparation forms the foundation for successful ubiquitinome profiling. Recent methodological advances have identified sodium deoxycholate (SDC)-based protein extraction as superior to conventional urea-based lysis buffers for ubiquitinomics applications [41]. When supplemented with chloroacetamide (CAA) for immediate cysteine protease inactivation, this lysis protocol yields approximately 38% more K-GG peptides than urea buffer (26,756 vs 19,403, n = 4 workflow replicates) without negatively affecting relative enrichment specificity [41]. Immediate boiling of samples after lysis combined with high CAA concentration rapidly alkylates and inactivates cysteine ubiquitin proteases, preserving the native ubiquitination state.
The standard SDC lysis protocol involves:
- Cell Lysis: Use ice-cold lysis buffer containing 50 mM Tris-HCl (pH = 8.2) with 0.5% sodium deoxycholate [39]
- Protein Denaturation: Boil lysates at 95°C for 5 minutes followed by sonication for 10 minutes at 4°C [39]
- Protein Quantitation: Determine total protein concentration using colorimetric absorbance BCA assay [39]
- Reduction and Alkylation: Reduce proteins with 5 mM 1,4-dithiothreitol for 30 minutes at 50°C, then alkylate with 10 mM chloroacetamide for 15 minutes in the dark [41]
- Digestion: Perform protein digestion with Lys-C (1:200 enzyme-to-substrate ratio) for 4 hours followed by overnight digestion with trypsin (1:50 enzyme-to-substrate ratio) at 30°C [39]
DiGly Peptide Enrichment and Fractionation
Effective enrichment of diGly-containing peptides is crucial for deep ubiquitinome coverage. The optimized protocol employs:
- Peptide Cleanup: Add trifluoroacetic acid (TFA) to digested samples to a final concentration of 0.5% and centrifuge at 10,000 × g for 10 minutes to precipitate and remove detergent [39]
- High-pH Reverse-Phase Fractionation: For maximum depth, fractionate tryptic peptides using high-pH reverse-phase C18 chromatography with polymeric stationary phase material (300 Å, 50 μM) [5]. Load peptides onto prepared columns and elute with 10 mM ammonium formate solution (pH = 10) containing 7%, 13.5%, and 50% acetonitrile [39]
- Immunoaffinity Enrichment: Use ubiquitin remnant motif (K-ε-GG) antibodies conjugated to protein A agarose beads for immunoenrichment [39]. For single-shot analyses, enrichment from 1 mg of peptide material using 31.25 μg of anti-diGly antibody provides optimal results [5]
- Competitor Management: Isolate fractions containing highly abundant K48-linked ubiquitin-chain derived diGly peptide and process them separately to reduce competition for antibody binding sites, particularly important in proteasome inhibitor-treated samples [5]
Mass Spectrometry Acquisition Parameters
Optimized DIA methods for ubiquitinome analysis require specific parameter adjustments to address the unique characteristics of diGly peptides:
- LC Separation: Employ nanoElute ultra-high performance liquid systems with 44-60 minute gradients from 6% to 30% mobile phase B (0.1% formic acid in acetonitrile) at flow rates of 450 nl/min [41] [42]
- DIA Window Schemes: Implement segmented variable window designs with approximately 30 m/z window widths rather than larger windows (100-300 m/z) which yield poorer spectral quality [5] [43]
- MS2 Resolution: Use relatively high MS2 resolution of 30,000 with 46 precursor isolation windows for optimal performance [5]
- Ion Mobility: When available, incorporate parallel accumulation-serial fragmentation (PASEF) modes on timsTOF instruments with ion source voltage of 2.0 kV and scanning range of 100-1700 m/z [42]
Essential Research Reagent Solutions
Successful implementation of deep-coverage ubiquitinomics requires specific reagents and materials optimized for this application. The following table outlines key solutions and their functions:
Table 3: Essential Research Reagent Solutions for High-Throughput Ubiquitinomics
| Reagent/Material | Function | Optimization Notes |
|---|---|---|
| Sodium Deoxycholate (SDC) | Lysis detergent for efficient protein extraction | Superior to urea; use at 0.5% in Tris-HCl buffer with immediate heating [41] |
| Chloroacetamide (CAA) | Cysteine protease alkylation | Preferred over iodoacetamide; prevents di-carbamidomethylation artifacts [41] |
| Anti-diGly Antibody | Immunoaffinity enrichment of ubiquitinated peptides | Critical for sensitivity; 31.25 μg per 1 mg peptide input optimal [5] |
| Lys-C/Trypsin | Sequential protein digestion | Generates appropriate peptide lengths with preserved diGly remnants [39] |
| High-pH RP Material | Peptide fractionation | 300 Å, 50 μm polymeric C18 material; enables deep library generation [5] |
| Proteasome Inhibitors | Enhance ubiquitinated peptide detection | MG-132 (10 μM, 4-6 h) or bortezomib treatment increases ubiquitin signal [41] [39] |
Biological Applications and Case Studies
Dynamic Ubiquitin Signaling Profiling
The superior quantitative capabilities of DIA-based ubiquitinomics enable unprecedented insights into dynamic ubiquitin signaling processes. In a landmark application, researchers employed time-resolved in vivo ubiquitinome profiling to identify substrates of the deubiquitinase USP7, an important oncology target [41]. Following USP7 inhibition with selective compounds, they simultaneously recorded ubiquitination changes and abundance profiles for more than 8,000 proteins at high temporal resolution [41]. This approach revealed that while ubiquitination of hundreds of proteins increased within minutes of USP7 inhibition, only a small fraction of those targets underwent degradation, thereby dissecting the scope of USP7 action and distinguishing regulatory ubiquitination leading to protein degradation from non-degradative events [41].
Another sophisticated application investigated ubiquitination dynamics across the circadian cycle, uncovering hundreds of cycling ubiquitination sites and dozens of cycling ubiquitin clusters within individual membrane protein receptors and transporters [5]. This systems-wide investigation highlighted new connections between metabolism and circadian regulation, demonstrating how comprehensive ubiquitinome profiling can reveal previously unrecognized regulatory mechanisms. The high quantitative precision and data completeness of DIA were essential for detecting these cycling patterns, which would likely be missed with more variable DDA approaches.
Clinical Ubiquitinome Characterization
DIA-based ubiquitinomics has also demonstrated significant potential for clinical applications, particularly in cancer research. A comprehensive characterization of the colorectal cancer (CRC) ubiquitinome identified 1,690 quantifiable ubiquitination sites and 870 quantifiable proteins from patient tissues [42]. Researchers found that highly ubiquitinated proteins (with ≥10 modification sites) were specifically involved in biological processes including G-protein coupling, glycoprotein coupling, and antigen presentation [42]. Analysis of differential ubiquitination revealed up-regulation in CRC cells for 1,172 proteins and down-regulation for 1,700 proteins, with these differentially ubiquitinated proteins relevant to pathways including metabolism, immune regulation, and telomere maintenance [42].
Integration of ubiquitinome data with proteomic datasets from the Clinical Proteomic Tumor Analysis Consortium (CPTAC) revealed that increased ubiquitination of FOCAD at Lys583 and Lys587 was potentially associated with patient survival [42]. This finding illustrates how DIA-enabled ubiquitinomics can identify clinically relevant ubiquitination events that may serve as prognostic markers or therapeutic targets, highlighting the translational potential of this approach.
Data-independent acquisition mass spectrometry has fundamentally transformed the field of high-throughput ubiquitinomics, enabling deep coverage in single-shot experiments that was previously unattainable with conventional DDA approaches. The dramatic improvements in identification numbers (tripling peptide identifications), quantitative precision (median CV of ~10%), and data completeness (>95% without missing values) position DIA as the premier technology for comprehensive ubiquitinome profiling [41] [5]. These technical advances have opened new avenues for investigating dynamic ubiquitin signaling in physiological and pathological contexts, from fundamental biology to clinical translation.
Looking forward, several emerging trends will likely shape the next generation of ubiquitinomics research. Continuous improvements in mass spectrometry instrumentation, particularly in ion mobility separation and scanning rates, will further enhance the depth and throughput of DIA analyses [17]. Similarly, computational advances in spectral library generation, de novo sequencing, and data deconvolution will address current limitations in data analysis complexity [17] [40]. Standardization of protocols and analytical workflows will be crucial for clinical implementation and cross-study comparisons, potentially establishing ubiquitinome profiling as a routine component of multi-omics investigations in both basic research and translational applications [17]. As these developments converge, DIA-based ubiquitinomics will continue to illuminate the intricate landscape of ubiquitin signaling, providing unprecedented insights into cellular regulation and identifying novel therapeutic opportunities for human diseases.
Solving Ubiquitinome Analysis Challenges: From Data Complexity to Software Selection
Data-Independent Acquisition (DIA) mass spectrometry has revolutionized proteomics by addressing critical limitations of traditional Data-Dependent Acquisition (DDA). While DDA selectively fragments the most abundant precursors, leading to stochastic missing values and reduced reproducibility, DIA systematically fragments all ions within predefined isolation windows, creating comprehensive digital proteome maps [28]. This fundamental difference is particularly valuable in ubiquitinome analysis, where capturing low-abundance, transient ubiquitination events is essential yet challenging. The ubiquitin-proteasome system regulates countless cellular processes, and its dysregulation contributes to various diseases, making it an active area for drug discovery [44]. However, the success of DIA-based ubiquitinomics hinges on the bioinformatics pipeline chosen. This guide objectively compares three leading software suites—DIA-NN, Spectronaut, and the FragPipe ecosystem—evaluating their performance, practical applicability, and suitability for ubiquitinome profiling within the broader context of DIA versus DDA methodologies.
Platform Positioning and Workflow Philosophy
Each software suite embodies a distinct philosophy in approaching DIA data analysis, influencing its ideal application scenarios.
DIA-NN: Designed for high-speed, library-free/predicted-library workflows, DIA-NN excels in robustness and cross-batch merging. It is particularly noted for being ion-mobility (IM) aware, making it a strong choice for timsTOF data. Its architecture leverages deep neural networks for robust quantification and stringent statistical control [45] [46] [28].
Spectronaut: A mature commercial platform offering polished directDIA and library-based modes. It provides an audit-friendly GUI, comprehensive QC reports, and templated exports, making it suitable for standardized environments and less experienced users. Its recent versions incorporate new search engines like Kuiper, which are optimized for unspecific searches and immunopeptidomics [45] [47].
FragPipe Ecosystem: An open, composable pipeline typically comprising tools like MSFragger-DIA and DIA-Umpire. Its strength lies in flexibility, transparency, and the retention of intermediate files (e.g., mzML, pepXML), which is ideal for method development, custom pipelines, and ensuring computational traceability [45].
Library Strategy Decision Guide
The choice of spectral library strategy is a critical first step in DIA analysis, and each software offers different strengths.
Table 1: Library Strategy Selection Guide
| Constraint / Goal | Recommended Strategy | Rationale and Software Strengths |
|---|---|---|
| Few samples, no historical DDA | Library-free / Predicted | Minimal setup; rapid proof-of-concept. DIA-NN excels here [45]. |
| Large cohorts, multi-batch | Predicted + Conservative MBR | Stable across batches; predictable compute. DIA-NN provides robust cross-batch stability [45]. |
| Maximum depth with available DDA | Project Library (DDA/GPF) | Sensitivity with tighter interference control. Spectronaut and FragPipe support robust library generation [45] [28]. |
| timsTOF with ion-mobility–enabled DIA | IM-aware search/alignment | Proper handling of ion mobility (1/K0) values. DIA-NN is specifically designed for this [45]. |
Performance Benchmarking in Global Proteomics and Ubiquitinomics
Independent benchmark studies reveal how these tools perform with real-world data. A comprehensive 2023 study in Nature Communications created benchmark datasets from hybrid mouse-yeast proteomes on both Orbitrap and timsTOF instruments to simulate complex biological regulation [28].
Identification Performance and Quantitative Robustness
The benchmark analysis provided clear performance metrics across different platforms and library types.
Table 2: Software Performance Benchmark on Hybrid Proteome Data
| Software | Library Type | Mouse Proteins (Orbitrap) | Mouse Proteins (timsTOF) | Key Quantitative Performance |
|---|---|---|---|---|
| DIA-NN | In-silico/Predicted | 5,186 | ~7,000 | Excellent CVs (<10-20%); high quantitative precision and reproducibility [28]. |
| DIA-NN | Universal DDA | 4,919 | 7,128 | Robust performance, often matching or exceeding other tools with experimental libraries [28]. |
| Spectronaut | Software-specific DDA | 5,354 | 7,116 | High quantitative precision; mature, reliable quantification [28]. |
| Spectronaut | directDIA | Smaller than DDA lib | Smaller than DDA lib | Good performance without need for DDA library [28]. |
| FragPipe (MSFragger) | Universal DDA | Not the top performer | Not the top performer | Flexible, but may not achieve top identification counts in global proteomics [28]. |
| Skyline | Universal DDA | ~4,900 (with FDR concerns) | N/R | Insufficient FDR control reported in benchmark study [28]. |
Specialized Performance in Ubiquitinome Analysis
DIA-MS has proven particularly powerful for ubiquitinomics. A landmark 2021 study in Nature Communications coupled an optimized sample preparation protocol with DIA-MS and DIA-NN processing specifically optimized for ubiquitinomics [8].
- Tripled Identifications: Compared to state-of-the-art DDA, the DIA-NN workflow more than tripled the number of identified ubiquitinated peptides (K-GG peptides) from proteasome-inhibited cells, increasing from ~21,000 to over 68,000 in single MS runs [8].
- Enhanced Robustness: The DIA-NN-based DIA workflow showed excellent quantitative precision, with a median coefficient of variation (CV) of about 10% for all quantified K-GG peptides. Furthermore, over 68,000 peptides were quantified in at least three out of four replicates, drastically reducing missing values common in DDA [8].
- Experimental Validation: The identification confidence for K-GG peptides with DIA-NN was experimentally validated to be comparable to DDA workflows and other DIA processing software, confirming the reliability of its false discovery rate (FDR) control for ubiquitinomics [8].
Experimental Protocols for Ubiquitinome Analysis
To achieve the deep ubiquitinome coverage described above, a robust and reproducible wet-lab protocol is essential. The following method, adapted from the 2021 study, is compatible with all three software platforms but was originally optimized for DIA-NN [8].
Sample Preparation for Ubiquitinome Profiling
Cell Lysis and Protein Extraction: Lyse cells immediately in a Sodium Deoxycholate (SDC)-based buffer supplemented with 20-40 mM Chloroacetamide (CAA) and protease/deubiquitinase inhibitors. Immediate boiling post-lysis is recommended to rapidly inactivate enzymes.
- Rationale: SDC-based lysis, compared to conventional urea buffer, yielded ~38% more K-GG peptides without affecting enrichment specificity. CAA rapidly alkylates cysteine ubiquitin proteases and avoids di-carbamidomethylation artifacts that can mimic K-GG peptides [8].
Protein Digestion: Perform standard reduction (e.g., DTT) and alkylation (CAA) followed by tryptic digestion. SDC is compatible with in-solution digestion and can be removed by acidification before the next step.
Enrichment of Ubiquitinated Peptides: Use immunoaffinity purification with anti-diglycine (K-GG) remnant motif antibodies to enrich ubiquitinated peptides from the complex peptide mixture.
Mass Spectrometry Analysis: Desalt and analyze enriched peptides on a nanoLC-MS system coupled to a high-resolution mass spectrometer.
- DIA Method: Implement a DIA method with variable window sizes optimized for the instrument's performance. A medium-length (75-120 min) nanoLC gradient is typical for achieving high coverage [8].
Data Analysis Workflow
The subsequent data processing and analysis steps form the core of this comparison guide.
DIA Data Analysis Workflow
Spectral Library Generation: As per Table 1.
- Project Library: Generate from fractionated DDA runs of your samples for maximum sensitivity.
- Predicted Library: Generate in-silico from a canonical protein sequence database (e.g., UniProt). DIA-NN and other tools have integrated predictors for fragment intensities and retention times.
- directDIA/Library-Free: Analyze DIA data directly against a sequence database without an experimental library. DIA-NN and Spectronaut's directDIA are highly effective in this mode [45] [8].
DIA Data Search and Quantification:
- Use the software-specific parameters as outlined in Table 3.
- Enable Match-Between-Runs (MBR) to propagate identifications across runs and reduce missing values, but apply conservative evidence thresholds, especially for complex matrices like plasma [45].
False Discovery Rate (FDR) Control: Apply uniform FDR thresholds, typically 1% at both peptide and protein levels, to ensure consistent confidence in identifications across tools. All three platforms implement robust target-decoy strategies for FDR estimation [45] [28].
Protein Grouping and Quantification: Use a consistent parsimonious protein grouping policy. The software will output protein-level quantitative values (e.g., MaxLFQ) for downstream statistical analysis.
Practical Implementation and Reagent Solutions
The Scientist's Toolkit: Essential Research Reagents
Table 3: Key Reagent Solutions for DIA Ubiquitinomics
| Reagent / Solution | Function | Application Note |
|---|---|---|
| Anti-K-GG Antibody Beads | Immunoaffinity enrichment of ubiquitinated peptides post-trypsin digestion. | Critical for isolating low-abundance ubiquitin remnants from the complex peptide background [8]. |
| Sodium Deoxycholate (SDC) | Lysis and protein extraction detergent. | Superior to urea for ubiquitinomics, providing higher recovery of K-GG peptides [8]. |
| Chloroacetamide (CAA) | Cysteine alkylating agent. | Preferred over iodoacetamide to avoid lysine di-carbamidomethylation artifacts that mimic K-GG mass shifts [8]. |
| N-Ethylmaleimide (NEM) | Deubiquitinase (DUB) inhibitor. | Preserves ubiquitination states during lysis by inhibiting cysteine-based DUBs (use at 20 mM) [44]. |
| Tandem Ubiquitin Binding Entities (TUBEs) | Enrich polyubiquitinated proteins prior to digestion. | Useful for workflows focusing specifically on polyubiquitin chain topology, complementing K-GG enrichment [44]. |
Software Configuration and Optimization
Configuring each software correctly is vital for reproducible and high-quality results.
Table 4: Recommended Software Configurations by Sample Type
| Aspect | DIA-NN | Spectronaut | FragPipe / MSFragger-DIA |
|---|---|---|---|
| Typical FDR Policy | 1% peptide / 1% protein | 1% peptide / 1% protein | 1% peptide / 1% protein |
| MBR Recommendation | On, with stricter evidence thresholds | On, with interference scoring | Configurable, often enabled |
| Key Strengths | Speed, library-free performance, IM-awareness (timsTOF) | GUI maturity, comprehensive QC, directDIA | Open-source flexibility, transparency, custom pipelines |
| Ideal Use Case | High-throughput cohorts, timsTOF data, new projects without DDA libraries | Standardized environments, audit-heavy projects, users preferring GUI | Method development, labs requiring open-source tools, complex custom analyses |
The choice between DIA-NN, Spectronaut, and FragPipe is not a matter of identifying a single "best" tool, but rather of selecting the right tool for the specific research context. For ubiquitinome analysis, the evidence strongly favors DIA-based methods over DDA due to superior reproducibility, quantitative accuracy, and depth of coverage [8] [28].
- DIA-NN stands out for its exceptional performance in library-free and predicted library modes, making it ideal for projects where generating deep experimental libraries is impractical. Its proven track record in large-scale ubiquitinome profiling [8], combined with high speed and robust cross-batch alignment, makes it a top recommendation for discovery-phase ubiquitinomics.
- Spectronaut remains a mature, reliable, and user-friendly platform, particularly strong in standardized environments requiring rigorous QC and audit trails. Its continuous commercial development, as seen with the Spectronaut 20 release [47], ensures it stays at the forefront of new applications like immunopeptidomics.
- FragPipeline offers unmatched flexibility and transparency for researchers who develop custom methods, require full control over their pipeline, or need to adhere to open-source principles.
For the practicing scientist investigating the ubiquitinome, the collective advancements in DIA-MS and these sophisticated software tools now enable the simultaneous monitoring of thousands of ubiquitination sites and proteome-wide changes at unprecedented resolution. This powerful combination is poised to accelerate the discovery and characterization of therapeutics targeting the ubiquitin-proteasome system [8] [44].
In the field of ubiquitinome analysis, proteasome inhibitors like MG132 are essential tools for stabilizing ubiquitinated proteins and enhancing the detection of ubiquitination sites by blocking their degradation [5] [48]. However, a significant technical challenge arises from the subsequent overabundance of peptides derived from K48-linked ubiquitin chains, which can dominate subsequent mass spectrometry analysis and mask the detection of co-eluting, lower-abundance ubiquitinated peptides from other substrates [5]. This article objectively compares the performance of Data-Independent Acquisition (DIA) and Data-Dependent Acquisition (DDA) mass spectrometry for overcoming this challenge, providing supporting experimental data and detailed methodologies to guide researchers and drug development professionals.
The K48-Peptide Challenge in Ubiquitinome Analysis
The K48-linked ubiquitin chain is the principal signal for proteasomal degradation. When the proteasome is inhibited, proteins tagged with K48 chains accumulate, and after digestion, they generate an exceedingly abundant diGly-modified peptide with a specific sequence [5]. During immunoaffinity enrichment, this K48-peptide competes for binding sites on the anti-diGly antibody, potentially reducing the enrichment efficiency of other ubiquitinated peptides [5]. In the mass spectrometer, its intense signal can overshadow less abundant peptides, leading to missing data and a biased representation of the ubiquitinome. Effectively managing this overabundance is therefore a critical prerequisite for deep and unbiased ubiquitinome profiling.
Technical Solutions for K48-Peptide Management
Fractionation-Based Strategy
The most direct solution to the K48-peptide overabundance problem is to separate it from the broader peptide mixture prior to enrichment.
- Experimental Protocol: After tryptic digestion of proteins from proteasome inhibitor-treated cells (e.g., 10 µM MG132 for 4 hours), peptides are separated by basic reversed-phase (bRP) chromatography into 96 fractions [5]. These fractions are then concatenated into a smaller number of pools (e.g., 8 fractions). Crucially, fractions containing the highly abundant K48-linked ubiquitin-chain derived diGly peptide are identified and processed separately [5].
- Rationale: This physical separation of the dominant K48-peptide reduces its capacity to compete during the subsequent antibody-based enrichment step in the individual pools. This allows for a more equitable capture of co-eluting, lower-abundance diGly peptides, thereby increasing the overall depth of ubiquitinome coverage [5].
The following workflow diagram illustrates this fractionation strategy integrated with the subsequent MS analysis:
MS Acquisition Mode: DIA vs. DDA
The choice of mass spectrometry acquisition mode is pivotal in determining the final depth and quantitative quality of ubiquitinome data, especially in the presence of high-abundance interferents.
- Data-Dependent Acquisition (DDA): This traditional method selects the most intense precursor ions (the "top N") for fragmentation in real-time [40]. In samples with an overabundant K48-peptide, this can lead to a bias where the instrument repeatedly fragments the same dominant ions, resulting in under-sampling of lower-abundance ubiquitinated peptides and greater "missing values" across sample runs [5] [40].
- Data-Independent Acquisition (DIA): This method systematically fragments all ions within sequential, pre-defined isolation windows across the full mass range [5] [40] [13]. This unbiased acquisition ensures that all detectable peptides, regardless of abundance, are fragmented and recorded, leading to more complete data sets with fewer missing values [5] [13].
Table 1: Performance Comparison of DIA vs. DDA in Ubiquitinome Analysis
| Feature | Data-Independent Acquisition (DIA) | Data-Dependent Acquisition (DDA) |
|---|---|---|
| Principle | Fragments all ions in pre-defined windows [40] | Selects & fragments most intense ions [40] |
| Identification Depth | ~35,000 diGly sites in single measurements [5] | Typically <50% of DIA IDs in single runs [5] [13] |
| Quantitative Reproducibility | High (Median CV ~10%) [13] | Lower, more missing values [5] [13] |
| Susceptibility to K48 Overabundance | Low (Unbiased acquisition) [5] | High (Biased towards intense signals) [5] [40] |
| Best Application | Large-scale, quantitative studies of complex ubiquitinomes [5] [16] | Targeted analysis or smaller-scale discovery [16] |
Optimized DIA Workflow for Ubiquitinome Profiling
Building on the fractionation strategy, implementing an optimized DIA workflow maximizes the benefits for ubiquitinome analysis. Key optimizations include tailoring the DIA method to the unique properties of diGly peptides, which are often longer and carry higher charge states than unmodified peptides [5]. Furthermore, coupling DIA with a sensitive and specific sample preparation protocol is critical.
Optimized DIA Method and Sample Preparation
- DIA Method Optimization: Research has shown that using a larger number of narrower precursor isolation windows (e.g., 46 windows) with a high MS2 resolution (e.g., 30,000) can increase the identification of diGly peptides by over 10% compared to standard full proteome methods [5].
- SDC-Based Lysis Protocol: Replacing conventional urea-based lysis buffer with a sodium deoxycholate (SDC) buffer, supplemented with chloroacetamide (CAA) for immediate cysteine protease inactivation, has been demonstrated to increase the yield of identified K-GG peptides by 38% while improving reproducibility [13]. This protocol also minimizes the risk of alkylation artifacts that can mimic diGly modifications [13].
The Scientist's Toolkit: Key Research Reagents
Table 2: Essential Reagents for Ubiquitinome Analysis with K48-Peptide Management
| Reagent / Material | Function | Key Consideration |
|---|---|---|
| Proteasome Inhibitor (e.g., MG132) | Stabilizes ubiquitinated proteins by blocking degradation [5] [48] | Treatment increases K48-chain abundance, necessitating management strategies [5]. |
| Anti-diGly Antibody | Immunoaffinity enrichment of ubiquitin-derived peptides [5] [48] | The K48-peptide competes for binding sites; titration is required for optimal yield [5]. |
| Basic Reversed-Phase Resin | High-resolution fractionation of digested peptides [5] | Critical for separating the hyper-abundant K48-peptide from the rest of the ubiquitinome [5]. |
| Sodium Deoxycholate (SDC) | Powerful detergent for efficient protein extraction [13] | Boosts ubiquitinome coverage and reproducibility compared to urea [13]. |
| Chloroacetamide (CAA) | Alkylating agent for cysteine residues [13] | Preferred over iodoacetamide to avoid di-carbamidomethylation artifacts on lysine [13]. |
The logical relationship between the K48-peptide challenge, the technical solutions, and the resulting performance outcomes is summarized below:
Managing K48-peptide abundance is a non-trivial challenge that is central to successful ubiquitinome analysis in proteasome inhibitor-treated samples. The combined approach of basic reversed-phase fractionation to physically separate the interfering peptide and the implementation of an optimized DIA-based mass spectrometry workflow provides a robust solution. The experimental data clearly demonstrates that DIA outperforms DDA in this context, offering superior identification depth, quantitative accuracy, and reproducibility by systematically capturing the entire ubiquitinome landscape, thereby mitigating the biases introduced by dominant peptide species. For researchers aiming to achieve comprehensive and unbiased ubiquitinome profiling, this integrated strategy represents a current best practice.
For researchers in ubiquitinome analysis, selecting the optimal data-independent acquisition (DIA) library strategy is crucial for balancing depth of coverage, quantitative accuracy, and project resources. This guide objectively compares the performance of project-specific, predicted, and library-free approaches to help you make an informed decision.
Direct Comparison of DIA Library Strategies
The table below summarizes the core performance characteristics of the three primary library strategies, based on benchmarking studies.
| Library Strategy | Proteome/Coverage (Peptide Level) | Quantitative Precision (Median CV) | Quantitative Accuracy | Best Suited For |
|---|---|---|---|---|
| Project-Specific | Highest (e.g., 35,111 diGly sites) [5] | ~10% CV for ubiquitinated peptides [8] | High [36] | Ultimate depth and precision; when sample is sufficient for library building. |
| Predicted (Library-Free) | High (e.g., 26,780 diGly sites without library) [5] | Good (e.g., 16.5–18.4% CV for proteins) [36] | Often highest in benchmarks [36] | New discovery without pre-existing libraries; high quantitative accuracy needs. |
| Public/Resource | Variable (≈ 90–103% of project-specific library performance) [49] | Good | High, if library is comprehensive [36] | Well-studied systems (e.g., human cell lines); maximizing throughput. |
Experimental Protocols for Key Benchmarking Studies
To ensure the reproducibility of your DIA workflows, here are the detailed methodologies from foundational studies.
Protocol 1: Generating a Project-Specific Spectral Library for Ubiquitinome
This protocol, adapted from Hansen et al. 2021, is designed to create a deep, comprehensive spectral library [5].
- 1. Cell Lysis & Protein Extraction: Use SDC (Sodium Deoxycholate) lysis buffer supplemented with Chloroacetamide (CAA) for rapid protease inactivation and improved ubiquitin site coverage compared to urea-based buffers [8].
- 2. Protein Digestion: Digest proteins using trypsin, which generates peptides with a diagnostic diGly (K-ε-GG) remnant on previously ubiquitinated lysines [8] [5].
- 3. Peptide Fractionation: Separate the resulting peptides using high-pH reversed-phase chromatography into 96 fractions. These are then concatenated into a smaller number of pools (e.g., 8). To prevent signal suppression, isolate and process fractions containing the highly abundant K48-linked ubiquitin chain peptide separately [5].
- 4. Ubiquitinated Peptide Enrichment: Enrich for diGly-containing peptides from each fraction using anti-K-ε-GG antibodies. The optimal ratio is typically 31.25 µg of antibody per 1 mg of peptide material [5].
- 5. Library MS Analysis: Analyze the enriched fractions using a Data-Dependent Acquisition (DDA) method on a high-resolution mass spectrometer (e.g., Orbitrap) to generate the foundational MS/MS spectra for the library [5].
Protocol 2: Library-Free DIA Ubiquitinome Profiling
This workflow, based on Steger et al. 2021, enables high-throughput ubiquitinome analysis without a prior experimental library [8].
- 1. Sample Preparation: Follow steps 1 and 2 from Protocol 1 (SDC lysis and tryptic digestion) [8].
- 2. Single-Shot Enrichment: Enrich diGly peptides from the total digest without prior fractionation. For single-run analysis, loading only 25% of the total enriched material can be sufficient [5].
- 3. DIA-MS Acquisition: Analyze the enriched peptides using an optimized DIA method. Critical parameters include:
- 4. Data Processing with Specialist Software: Process the raw DIA data using software like DIA-NN in "library-free" mode. The software utilizes deep neural networks to generate in-silico predicted spectral libraries from protein sequence databases, which are then used to interrogate the DIA data [8] [36].
The Scientist's Toolkit: Essential Research Reagents
This table details key reagents and materials used in the featured ubiquitinome workflows.
| Research Reagent / Material | Function in Workflow |
|---|---|
| Anti-K-ε-GG Antibody | Immunoaffinity enrichment of ubiquitin-derived diGly-modified peptides from complex peptide digests [8] [5]. |
| Sodium Deoxycholate (SDC) | A highly efficient detergent for cell lysis and protein extraction, leading to higher ubiquitin site coverage compared to urea [8]. |
| Chloroacetamide (CAA) | Alkylating agent used in lysis buffer to rapidly and effectively cysteine ubiquitin proteases (DUBs), preserving the native ubiquitinome [8]. |
| High-pH Reversed-Phase Chromatography | Fractionation technique used to reduce sample complexity prior to enrichment, which is essential for building deep spectral libraries [5]. |
| DIA-NN Software | A deep neural network-based software package for analyzing DIA data, offering high performance in both library-based and library-free modes [8] [36]. |
Workflow Visualization
The following diagrams illustrate the logical relationships and steps in the key experimental protocols.
DIA vs DDA Ubiquitinomics Workflow
Project-Specific Library Generation
Library-Free DIA Analysis Workflow
In mass spectrometry-based proteomics, reproducibility is a central hurdle that can limit the potential of large-scale studies, particularly in clinical and drug development settings [50]. Data-independent acquisition (DIA) has emerged as a powerful alternative to data-dependent acquisition (DDA) due to its systematic sampling of all analytes within predetermined mass-to-charge windows, fundamentally reducing stochastic sampling effects [51] [17]. While DIA inherently provides more reproducible data acquisition [6], the transformation of this raw data into biologically meaningful results depends critically on robust computational strategies for cross-batch alignment and normalization [34]. These post-acquisition processes are especially crucial for ubiquitinome analyses, where the low stoichiometry of modifications and extensive sample processing can introduce technical variances that obscure true biological signals [12] [13]. This guide objectively compares the performance of different alignment and normalization strategies within DIA workflows, providing researchers with evidence-based recommendations to ensure reproducible ubiquitinome analysis across large sample batches.
Fundamental Concepts: Alignment and Normalization
Retention time (RT) alignment corrects for chromatographic shifts between runs, establishing precise correspondence between peptide elution profiles across different batches [52]. Without proper alignment, consistent quantification becomes compromised, especially in large-scale studies where data acquisition occurs over extended periods [52].
Normalization addresses systematic technical variation affecting signal intensities across samples, ensuring that quantitative comparisons reflect true biological differences rather than experimental artifacts [34]. In single-cell and ubiquitinome proteomics, where missing values tend to be more prevalent, normalization becomes particularly challenging yet essential for valid biological interpretation [34].
The interaction between alignment and normalization is sequential yet interdependent: successful alignment establishes the foundation for meaningful normalization by ensuring consistent feature matching, while proper normalization enables accurate quantitative comparisons across batches [34] [52].
Experimental Protocols for Benchmarking
Benchmarking Study Design
Robust evaluation of alignment and normalization strategies requires carefully designed benchmark experiments with known ground truth:
- Spike-in Designs: Create samples with known contents and ratios of proteins in a complex background matrix. For ubiquitinome studies, cells treated with proteasome inhibitors (e.g., MG132) significantly increase ubiquitinated peptides, providing well-characterized test cases [12] [13].
- Cross-Batch Simulation: Divide samples across multiple acquisition batches with different dates, operators, or LC columns to mimic real-world heterogeneity [23] [51].
- Hybrid Proteome Samples: Construct samples consisting of tryptic digests from multiple organisms (e.g., human, yeast, E. coli) mixed in defined proportions, creating a system with known expected ratios [34].
Ubiquitinome-Specific Protocol
For benchmarking ubiquitinome-specific workflows, researchers have developed optimized protocols:
Figure 1: Optimized ubiquitinome analysis workflow with critical steps highlighted.
Sample Preparation:
- Use sodium deoxycholate (SDC)-based lysis buffer supplemented with chloroacetamide (CAA) for immediate cysteine protease inactivation [13]. This approach yields approximately 38% more diGly peptides compared to conventional urea buffer [13].
- Process 1-2 mg of protein extract for tryptic digestion followed by immunoaffinity enrichment of diGly-containing peptides using specific antibodies [12].
- For very deep libraries, basic reversed-phase fractionation into 96 fractions concatenated into 8-12 pools reduces complexity and increases coverage [12].
Mass Spectrometry Acquisition:
- Employ DIA methods with optimized window schemes tailored to diGly peptide characteristics [12] [13].
- Implement 46 precursor isolation windows with MS2 resolution of 30,000 for optimal performance [12].
- Use medium-length LC gradients (75-120 minutes) for balance between throughput and depth [13].
Comparative Performance of Alignment Strategies
Retention Time Alignment Algorithms
Recent benchmarking studies have revealed critical differences in alignment approaches:
Figure 2: Retention time alignment approaches and their performance characteristics.
Traditional Global Alignment methods use a monotonic function (linear or LOESS regression) based on internal retention time standards (iRT peptides) or landmark features [52]. These methods assume consistent elution order and struggle when this assumption is violated, particularly across distant runs where elution-order-swapped peaks become common [52].
Local Alignment approaches directly align raw MS2 chromatograms using dynamic programming for each precursor independently. While potentially more accurate for specific peptides, these methods can be sensitive to noise and missing features [52].
Hybrid Approaches like DIAlignR combine global and local strategies, using global whole-run alignment for guidance while allowing local adjustments [52]. This approach achieves approximately 98% alignment accuracy in heterogeneous human plasma samples, significantly outperforming global methods that achieved only 67-76% accuracy in challenging cases [52].
Quantitative Comparison of Alignment Performance
Table 1: Performance comparison of alignment strategies in SWATH-MS data
| Alignment Method | Alignment Principle | Reported Accuracy | Strengths | Limitations |
|---|---|---|---|---|
| Global (Linear/LOESS) | Monotonic function based on iRT peptides | 67-76% in heterogeneous samples [52] | Simple implementation, fast computation | Fails with elution-order-swapped peaks |
| Local (Pairwise) | Direct chromatogram alignment per precursor | Variable, sensitive to noise [52] | Handles swapped peaks effectively | Computationally intensive, less robust |
| Hybrid (DIAlignR) | Global guidance with local adjustments | 98% in human plasma samples [52] | Robust to noise and peak swapping | Moderate computational requirements |
Normalization Strategies for Batch Effects
Normalization Techniques
Comprehensive benchmarking studies have evaluated multiple normalization approaches in DIA data:
Linear Regression Methods include global normalization (equalizing total signal across runs) and cyclic LOESS (intensity-dependent normalization). These methods effectively address systematic intensity shifts but may struggle with complex batch effects [51].
Quantile Normalization forces the distribution of intensities to be identical across runs. While powerful, this approach can potentially remove biological signals if applied indiscriminately [51].
Advanced Statistical Methods include batch effect correction algorithms like ComBat, which uses empirical Bayes frameworks to adjust for batch effects while preserving biological variation [34].
Performance in Ubiquitinome Applications
In ubiquitinome analyses, normalization must address the specific characteristics of post-translational modification data:
- Signal-to-noise considerations: Ubiquitinated peptides often exhibit lower signals than unmodified peptides, requiring careful handling of low-abundance signals [12] [13].
- Missing value patterns: Ubiquitinome data typically has higher missing value rates, complicating normalization [34].
- Dynamic range compression: Highly abundant proteins (e.g., K48-linked ubiquitin chains in proteasome-inhibited samples) can dominate signals, necessitating specialized handling [12].
Recent benchmarking demonstrates that DIA normalization generally achieves superior reproducibility compared to DDA, with median coefficients of variation (CVs) for ubiquitinated peptides around 10% in DIA versus 15-25% in DDA [13].
Integrated Workflow Comparisons
Comprehensive Workflow Benchmarking
Large-scale benchmarking studies have evaluated complete workflows combining spectral libraries, DIA software, and normalization strategies:
Table 2: DIA software performance for ubiquitinome analysis
| Software Tool | Spectral Library Strategy | Quantified diGly Peptides | Quantitative Precision (Median CV) | Recommended Use Cases |
|---|---|---|---|---|
| DIA-NN | Library-free (predicted) | ~68,429 (single run) [13] | ~10% [13] | Large-scale studies, newest instruments |
| Spectronaut | directDIA (library-free) | ~33,409 (single run) [12] | 22-24% [34] | Standardized workflows, clinical applications |
| PEAKS Studio | Sample-specific library | ~27,753 (single run) [34] | 27-30% [34] | Projects with available DDA data for libraries |
Impact of Spectral Libraries on Reproducibility
The choice of spectral library generation significantly impacts downstream reproducibility:
- Gas-phase fractionation (GPF) libraries consistently outperform other library types, particularly for detecting differentially abundant proteins [51].
- Sample-specific libraries from fractionated DDA measurements provide the largest libraries but require substantial additional measurement time [23] [51].
- Public/predicted libraries offer convenience but may reduce quantitative accuracy and reproducibility compared to project-specific libraries [34] [23].
Benchmarking reveals that library-based searches generally improve reproducibility compared to database searches, with approximately 30% higher protein overlap among technical replicates and more than 35% reduction in missing values [50].
The Scientist's Toolkit: Essential Research Reagents
Table 3: Key research reagents for reproducible ubiquitinome analysis
| Reagent / Material | Function | Performance Considerations |
|---|---|---|
| Anti-diGly Antibody | Immunoaffinity enrichment of ubiquitinated peptides | Critical for specificity; 31.25 µg antibody per 1 mg peptide input recommended [12] |
| SDC Lysis Buffer | Protein extraction with protease inhibition | 38% more diGly peptides vs. urea buffer [13] |
| Chloroacetamide (CAA) | Cysteine alkylation | Prevents di-carbamidomethylation artifacts vs. iodoacetamide [13] |
| iRT Kit | Retention time standardization | Enables cross-batch alignment [52] [51] |
| GPF Libraries | Spectral reference generation | Highest performance for differential abundance analysis [51] |
Based on comprehensive benchmarking evidence, researchers should implement these practices to ensure reproducibility in cross-batch ubiquitinome analyses:
Implement Hybrid Alignment: Use tools like DIAlignR that combine global and local alignment strategies to handle elution-order-swapped peaks in large-scale studies [52].
Leverage GPF Libraries: Invest in gas-phase fractionation for spectral library generation, as these consistently outperform other library types in benchmarking studies [51].
Apply Appropriate Normalization: Select normalization methods based on your specific data characteristics, with non-parametric permutation-based statistical tests generally performing best [51].
Validate with Spike-ins: Incorporate internal standards or spike-in controls to monitor and correct for batch effects throughout the experimental timeline [23] [51].
Adopt Multi-Softwork Strategies: Employ multiple DIA analysis tools with orthogonal approaches to enhance the robustness and reliability of findings, as different software tools have unique strengths and potential biases [17].
The reproducibility advantages of DIA over DDA are substantial, particularly for ubiquitinome applications where quantitative accuracy across batches is essential for valid biological conclusions. By implementing these evidence-based practices for cross-batch alignment and normalization, researchers can maximize the value of their DIA ubiquitinome data and generate findings that stand up to rigorous validation.
For researchers embarking on large-cohort proteomic studies, effective computational resource planning is as critical as experimental design. The choice of data analysis software directly impacts hardware requirements, processing time, and ultimately, the depth and reliability of biological insights. This guide provides an objective comparison of leading Data-Independent Acquisition (DIA) software tools, focusing on their performance and computational demands to inform efficient resource planning.
Experimental Protocols for Benchmarking DIA Software
Benchmarking studies typically employ a standardized design to ensure fair and reproducible comparisons between software tools. The following methodology is adapted from published evaluations [45].
- Sample Matrices: Experiments utilize at least three distinct biological matrices to test software robustness. Common choices include cell or tissue lysates (e.g., HeLa cell lines), depleted human plasma to challenge algorithms with complex backgrounds, and Formalin-Fixed Paraffin-Embedded (FFPE) tissue extracts [45].
- Chromatographic Gradients: Benchmarks are run using multiple liquid chromatography (LC) gradient lengths, such as 60-minute and 120-minute methods, to evaluate performance across different peptide separation densities [45].
- Sample Loading and Replication: Tests include both low and standard protein load amounts. Each condition is processed with a minimum of three technical replicates, with a quality control (QC) pool sample injected every ~10-12 runs to assess cross-batch alignment and quantitative precision [45].
- Data Acquisition and Processing: All samples are analyzed using the same DIA mass spectrometry instrument method. The resulting raw files are processed through each software tool (DIA-NN, Spectronaut, FragPipe) using consistent false discovery rate (FDR) thresholds (1% at both peptide and protein levels) and a parsimonious protein grouping policy. Key Performance Indicators (KPIs) are then calculated from the native output tables to ensure comparability [45].
Quantitative Performance and Resource Comparison of DIA Software
The table below summarizes the core performance metrics and computational footprints of the major DIA analysis platforms, based on benchmark data from complex proteome samples [45].
| Software Tool | Identification Performance (HeLa Lysate) | Quantitative Precision (Median CV) | Typical Computational Footprint |
|---|---|---|---|
| DIA-NN | ~73,000 precursors; ~6,800 protein groups [18] | 7.7% (Protein Groups) [18] | 16-32 vCPU; 64-128 GB RAM per job [45] |
| Spectronaut | Competitive, precise library-based identification [45] | ≤15% (QC-pool protein CV target) [45] | Varies; generally higher than DIA-NN due to GUI overhead [45] |
| FragPipe (MSFragger-DIA) | Flexible, high performance with composable pipelines [45] | Data not specified in results | Sensitive to I/O; benefits from high-speed storage [45] |
| AlphaDIA | >73,000 precursors with unique sequence and charge [18] | Person R > 0.99 across replicates [18] | Designed for cloud/distributed computing (Slurm, Docker) [18] |
The table below outlines the primary strengths and optimal use cases for each tool, which directly influence workflow design and resource allocation.
| Software Tool | Primary Strengths | Recommended Library Strategy | Ideal Use Case |
|---|---|---|---|
| DIA-NN | High-speed library-free/predicted workflows; robust cross-batch merging; ion mobility (IM)-aware [45]. | Predicted or library-free for rapid startup and large cohorts [45]. | High-throughput, budget-sensitive cohorts; timsTOF with ion-mobility–enabled DIA data [45]. |
| Spectronaut | Mature directDIA & library-based modes; audit-friendly GUI reports; templated exports [45]. | Project-specific library for maximum depth; directDIA for flexibility [45]. | Regulated environments requiring standardized reports; projects leveraging existing spectral libraries [45]. |
| FragPipe | Open, composable pipeline; transparent intermediate files; ideal for traceability and method development [45]. | Flexible; supports various library and library-free approaches via MSFragger-DIA [45]. | Research environments prioritizing method development, customization, and computational traceability [45]. |
| AlphaDIA | Feature-free identification; machine learning on raw signal; handles novel acquisition modes like synchro-PASEF [18]. | DIA transfer learning using fully predicted libraries [18]. | Novel scan modes (e.g., sliding windows); projects analyzing arbitrary post-translational modifications (PTMs) [18]. |
The DIA Data Analysis Workflow
The process of analyzing DIA data, from raw files to biological interpretation, follows a multi-stage workflow. The computational load is highest during the feature detection and scoring phases.
Successful DIA-based ubiquitinome analysis requires a combination of wet-lab reagents and computational resources.
| Category | Item | Function in Workflow |
|---|---|---|
| Wet-Lab Reagents | Sodium Deoxycholate (SDC) Lysis Buffer [8] | Efficient protein extraction with immediate protease inactivation for ubiquitinome preservation. |
| Wet-Lab Reagents | Chloroacetamide (CAA) [8] | Rapid alkylation agent that prevents artifactual di-carbamidomethylation of lysines, which can mimic K-GG peptides. |
| Wet-Lab Reagents | K-ε-GG Motif Antibody Beads [8] [31] | Immunoaffinity enrichment of diglycine-modified (K-GG) peptides derived from ubiquitinated proteins. |
| Computational Resources | High-Speed Storage (NVMe Drives) [45] | Critical for handling intermediate files during feature extraction and scoring, reducing I/O bottlenecks. |
| Computational Resources | DIA-NN Software [8] [45] [53] | High-performance, freely available software suite for deep and reproducible DIA data analysis. |
| Computational Resources | pRoloc Bioinformatics Pipeline [53] | R-based suite for spatial proteomics data analysis, used in subcellular localization workflows like DIA-LOP. |
Strategic Implementation for Workflow Efficiency
Optimizing Library Strategy for Computational Load
The choice of spectral library strategy is a major determinant of computational runtime and project setup time. For large cohorts, predicted or library-free strategies, as implemented in DIA-NN and AlphaDIA, offer the best balance of speed and depth, avoiding the upfront cost of generating experimental libraries [45]. While project-specific libraries from data-dependent acquisition (DDA) can provide maximum sensitivity, they require significant compute time for library construction and maintenance [45].
Managing Batch Effects and Data Quality
For large studies run over multiple batches, implementing a robust quality control regimen is non-negotiable. This includes:
- QC-Pool Anchoring: Injecting a pooled quality control sample every ~10-12 runs to monitor instrument performance and anchor retention time alignment across batches [45].
- Conservative Match-Between-Runs (MBR): Using MBR with strict evidence thresholds to fill missing values without compromising data integrity, especially in complex matrices like plasma [45].
- Data-Driven Optimization: Leveraging frameworks like DO-MS for interactive quality control and optimization of DIA acquisition parameters, which is particularly relevant for advanced applications like single-cell proteomics and plexDIA [54].
Throughput and Cost Considerations
Total CPU-hours can be estimated as: N samples × (baseline CPU-h per sample) × (multipliers for gradient length, library strategy, and matrix complexity) [45]. To manage turnaround time (TAT) and cost effectively:
- Parallelization: Shard jobs by sample to leverage high-core-count servers or cloud computing environments [18] [45].
- Checkpointing: Use software that caches intermediate results (e.g., feature tables) to allow for quick parameter tweaks without re-processing from scratch [45].
- Hardware Selection: Allocate 16-32 vCPU and 64-128 GB RAM per concurrent job as a pragmatic baseline for efficient processing [45].
Strategic computational resource planning for large-cohort DIA studies requires matching software capabilities to project goals. DIA-NN excels in high-throughput, budget-conscious environments with its fast library-free workflows, while Spectronaut offers polished solutions for regulated workflows. FragPipe provides unparalleled transparency for method development, and AlphaDIA shows great promise for handling next-generation acquisition modes. By aligning computational tool selection with experimental objectives and implementing robust QC and data management practices, researchers can ensure their resource investment directly translates into deep, reproducible, and biologically meaningful proteomic insights.
Benchmarking Performance: Quantitative Evidence for DIA's Superiority in Ubiquitinome Analysis
For researchers investigating the ubiquitin-proteasome system, the choice of mass spectrometry acquisition method is pivotal. Direct comparative studies demonstrate that Data-Independent Acquisition (DIA) consistently and significantly outperforms Data-Dependent Acquisition (DDA) in ubiquitinome analysis. As shown in the table below, DIA provides superior identification depth, quantification precision, and data completeness, making it particularly suitable for comprehensive, systems-wide studies of ubiquitin signaling [15] [12] [25].
Table 1: Comprehensive Performance Comparison: DIA vs. DDA in Ubiquitinome Analysis
| Performance Metric | Data-Independent Acquisition (DIA) | Data-Dependent Acquisition (DDA) |
|---|---|---|
| Typical Ubiquitinated Peptide IDs (Single Run) | ~35,000 - 70,000 peptides [15] [12] | ~20,000 - 21,000 peptides [15] [12] |
| Quantitative Reproducibility (Median CV) | ~10% or better [15] [12] | ~17% or higher [12] [25] |
| Data Completeness (Missing Values) | Significant reduction; matrix ~93% complete [6] [25] | Higher rate of missing values; matrix ~69% complete [6] |
| Dynamic Range & Sensitivity | Enhanced detection of low-abundance peptides; extends dynamic range [6] | Biased toward high-abundance ions; low-abundance peptides often missed [6] [55] |
| Key Technological Enablers | DIA-NN software; deep spectral libraries; optimized isolation windows [15] [18] | Standard MaxQuant processing; match-between-runs [15] |
Experimental Protocols for Ubiquitinome Analysis
The superior performance of DIA is demonstrated through rigorous experimental workflows designed for deep ubiquitinome profiling.
Optimized Sample Preparation for Ubiquitinomics
A critical improvement in sample preparation involves the lysis buffer. A sodium deoxycholate (SDC)-based protocol, supplemented with chloroacetamide (CAA) for immediate cysteine protease inactivation during boiling, has been shown to increase ubiquitin site coverage by an average of 38% compared to conventional urea-based buffers [15]. This protocol avoids the di-carbamidomethylation of lysine residues that can occur with iodoacetamide, which mimics the diGly mass tag [15]. For immunoaffinity enrichment, the standard approach uses specific antibodies targeting the diglycine (K-ε-GG) remnant left on lysine residues after tryptic digestion of ubiquitinated proteins [15] [12].
DDA and DIA Mass Spectrometry Acquisition Parameters
The fundamental difference between the two techniques lies in their data acquisition logic, which is visualized in the workflow diagram below.
DDA Method Details: The instrument performs a full MS1 survey scan to detect all eluting peptide ions. In real-time, it selects the most abundant precursor ions (e.g., top 10-20) for subsequent isolation and fragmentation. This intensity-based selection is its primary limitation, leading to stochastic missing values across runs and a bias against low-abundance ubiquitinated peptides [6] [55].
Optimized DIA Method Details: The mass range (e.g., 400-1000 m/z) is divided into consecutive, wide isolation windows. The instrument systematically cycles through these windows, isolating and fragmenting all ions within each window, regardless of intensity. This unbiased acquisition is key to its completeness [15] [12]. One optimized method uses 46 variable-width windows with a fragment scan resolution of 30,000 [12].
Data Processing and Analysis
DDA Data Processing: Typically processed using tools like MaxQuant, which can employ "match-between-runs" to partially compensate for missing values [15].
DIA Data Processing: The complex, multiplexed data requires specialized software for deconvolution. DIA-NN is a prominent deep neural network-based tool specifically optimized for ubiquitinomics data. It can operate in a "library-free" mode against a sequence database or use a deep spectral library for matching, resulting in significantly higher identification numbers and quantitative accuracy [15]. Newer tools like AlphaDIA are emerging, using feature-free processing and machine learning directly on the raw signal to further improve performance [18].
Performance Data and Biological Validation
The theoretical advantages of DIA are consistently borne out in experimental data, revealing a significant performance gap.
Direct Comparison of Identification Depth and Data Quality
In a landmark study profiling the ubiquitinome of HCT116 cells, DIA quantified 68,429 ubiquitinated peptides on average per single MS run. This was more than triple the 21,434 peptides identified by state-of-the-art DDA in the same samples [15]. This dramatic increase in coverage does not come at the cost of quality; the DIA data showed excellent quantitative precision with a median coefficient of variation (CV) of about 10% [15]. A separate study on tear fluid proteomics, while not ubiquitin-specific, corroborates this trend, with DIA showing a median protein CV of 9.8% versus 17.3% for DDA [25].
Application in Biological Signaling and Drug Discovery
The practical value of DIA's performance is clear in mode-of-action studies. When researchers applied the DIA ubiquitinomics workflow to profile inhibition of the deubiquitinase USP7 (an oncology target), they could simultaneously track ubiquitination changes and protein abundance for over 8,000 proteins at high temporal resolution [15]. This deep, precise profiling allowed them to distinguish between ubiquitination events that lead to protein degradation and those with non-degradative regulatory functions—a key insight for drug discovery that is difficult to achieve with lower-coverage methods [15]. Furthermore, when applied to the study of circadian biology, DIA ubiquitinomics uncovered hundreds of cycling ubiquitination sites, revealing a previously unappreciated layer of post-translational regulation in cellular timing [12].
The Scientist's Toolkit for DIA Ubiquitinomics
Transitioning to a robust DIA workflow requires specific reagents, instruments, and software solutions. The table below details the key components.
Table 2: Essential Research Reagent Solutions for DIA Ubiquitinome Analysis
| Tool / Solution | Function / Description | Role in the Workflow |
|---|---|---|
| Anti-diGly Remnant Antibody | Immunoaffinity purification of tryptic peptides with lysine-glycine-glycine (K-ε-GG) remnants [15] [12]. | Critical for enriching low-abundance ubiquitinated peptides from complex digests. |
| Sodium Deoxycholate (SDC) Lysis Buffer | A detergent for efficient protein extraction and digestion, superior to urea for ubiquitinomics [15]. | Boosts ubiquitinated peptide identification numbers by ~38% compared to urea [15]. |
| DIA-NN Software | A deep neural network-based data processing tool specifically optimized for DIA and ubiquitinomics [15]. | Enables high-confidence identification and quantification from complex DIA spectra. |
| High-Resolution Mass Spectrometer | Instruments like Orbitrap Astral or timsTOF capable of fast scanning and high resolution [6] [18]. | Provides the speed and sensitivity needed for DIA's comprehensive acquisition. |
| Spectral Library | A comprehensive collection of known ubiquitinated peptide spectra; can be empirical or predicted in silico [12] [18]. | Used by software to match and deconvolute signals in DIA data. |
| Chloroacetamide (CAA) | A cysteine alkylating agent that avoids lysine modifications [15]. | Used in SDC lysis to rapidly inactivate ubiquitin proteases, preserving the native ubiquitinome. |
The experimental evidence is unequivocal: for deep, reproducible, and quantitative analysis of the ubiquitinome, Data-Independent Acquisition (DIA) represents a definitive advance over Data-Dependent Acquisition (DDA). By moving from a stochastic, intensity-driven sampling method to a systematic and comprehensive acquisition strategy, DIA more than triples the number of identifiable ubiquitinated peptides while simultaneously improving quantitative robustness [15] [12]. This powerful capability enables researchers to uncover novel biology within the ubiquitin-proteasome system with greater confidence and depth, solidifying DIA's role as the method of choice for cutting-edge ubiquitin signaling research and drug target validation.
Protein ubiquitination is a versatile post-translational modification involved in virtually all cellular processes, including circadian regulation, TNF signaling, and the response to anticancer drugs [12] [13]. Mass spectrometry (MS)-based ubiquitinomics typically uses antibodies to enrich for tryptic peptides containing a di-glycine (K-ε-GG) remnant left after ubiquitinated proteins are digested [12]. However, the low stoichiometry of ubiquitination and the semi-stochastic sampling of traditional Data-Dependent Acquisition (DDA) MS have made large-scale, reproducible analysis challenging [12] [13].
Data-Independent Acquisition (DIA) has emerged as a solution, systematically fragmenting all ions within predefined m/z windows rather than selecting only the most intense precursors [7] [16]. This fundamental shift in acquisition strategy enables DIA to achieve remarkably low coefficients of variation (CVs), often below 10%, providing the quantitative precision required for robust systems-wide ubiquitinome profiling [12] [13]. This guide objectively compares the quantitative performance of DIA and DDA, detailing the experimental protocols and data that establish DIA as the superior method for precise ubiquitinome analysis.
Quantitative Comparison: DIA vs. DDA Performance
Extensive benchmarking experiments reveal that DIA consistently outperforms DDA in depth of coverage, quantitative accuracy, and reproducibility for ubiquitinome studies.
Table 1: Comparative Performance of DIA and DDA in Ubiquitinome Analysis
| Performance Metric | Data-Independent Acquisition (DIA) | Data-Dependent Acquisition (DDA) |
|---|---|---|
| Typical DiGly Peptide IDs (Single Shot) | ~35,000 - 70,000 peptides [12] [13] | ~20,000 - 21,000 peptides [12] [13] |
| Median Quantitative Precision (CV) | ~10% [13] | Significantly higher [12] |
| Peptides with CV < 20% | ~45% of identified peptides [12] | ~15% of identified peptides [12] |
| Data Completeness | High; ~68,000 peptides quantified in ≥3 of 6 replicates [13] | Lower; ~50% of IDs without missing values in replicates [13] |
| Key Enabling Factors | Comprehensive fragmentation; neural network-based processing (DIA-NN) [13] | Stochastic, intensity-based precursor selection [12] |
The superiority of DIA is quantitively demonstrated in a study where six replicate analyses of ubiquitinated peptides from proteasome-inhibitor treated cells identified around 36,000 distinct diGly peptides, with 45% showing CVs below 20% and a median CV of approximately 10% [12] [13]. In contrast, a DDA method applied to the same samples identified only about 20,000 diGly peptides, with a mere 15% having a CV below 20% [12]. This tripling of robustly quantified peptides underscores DIA's transformative impact on quantitative accuracy [13].
Experimental Protocols for High-Precision DIA Ubiquitinomics
Achieving low CVs requires optimized sample preparation, tailored instrument methods, and advanced data processing.
Sample Preparation and Lysis Optimization
A key advancement is the use of Sodium Deoxycholate (SDC)-based lysis buffer supplemented with Chloroacetamide (CAA) [13]. Immediate sample boiling after lysis with a high concentration of CAA rapidly inactivates deubiquitinases (DUBs), preserving the endogenous ubiquitinome. Compared to conventional urea-based lysis, the SDC protocol increases the yield of K-ε-GG peptides by an average of 38% and significantly improves reproducibility [13]. For enrichment, the optimal input is typically 1 mg of peptide material using 31.25 µg of anti-diGly antibody, with only 25% of the total enriched material needed for injection in a sensitive DIA setup [12].
DIA Method Configuration and Spectral Libraries
DIA method parameters must be optimized for the unique characteristics of diGly peptides, which are often longer and carry higher charge states due to impeded C-terminal cleavage at modified lysine residues [12]. An optimized method for an Orbitrap instrument involves:
- Number of Windows: 46 precursor isolation windows.
- MS2 Resolution: A setting of 30,000.
- Cycle Time: Balanced to sufficiently sample eluting chromatographic peaks [12].
This tailored method provided a 13% improvement in identifications over a standard full proteome DIA method [12]. For data processing, two main strategies are employed:
- Library-Free Analysis: Software like DIA-NN can directly search DIA data against a protein sequence database, leveraging deep neural networks to confidently identify and quantify modified peptides without an experimental library [56] [13].
- Using Deep Spectral Libraries: Researchers have generated comprehensive, cell line-specific spectral libraries containing over 90,000 diGly peptides by fractionating samples (e.g., into 96 fractions concatenated into 8 pools) prior to DDA analysis. This deep library allows the matching of over 35,000 diGly sites in a single DIA measurement [12].
Table 2: Essential Research Reagents and Software for DIA Ubiquitinomics
| Item | Function / Explanation |
|---|---|
| Anti-diGly Remnant Motif Antibody | Immunoaffinity purification of K-ε-GG peptides from complex tryptic digests [12]. |
| Sodium Deoxycholate (SDC) Lysis Buffer | Efficient protein extraction while improving ubiquitin remnant peptide yield and reproducibility vs. urea [13]. |
| Chloroacetamide (CAA) | Cysteine alkylating agent; rapidly inactivates DUBs to preserve ubiquitination and avoids lysine modifications [13]. |
| Spectral Library (e.g., >90,000 diGly peptides) | Enables sensitive targeted extraction of quantitative data from complex DIA files [12]. |
| DIA-NN Software | Deep neural network-based computational tool for high-sensitivity "library-free" analysis of DIA ubiquitinome data [56] [13]. |
| MSFragger-DIA / FragPipe | Computational platform for fast, direct database searching of DIA MS/MS spectra and hybrid spectral library generation [56]. |
The DIA Ubiquitinomics Workflow
The following diagram illustrates the integrated workflow from sample preparation to data analysis that enables high-precision ubiquitinome profiling.
The experimental evidence unequivocally demonstrates that DIA-MS, supported by optimized sample preparation and advanced computational tools, achieves a level of quantitative precision—with median CVs around 10%—that is unattainable with DDA for ubiquitinome analysis [12] [13]. This capability to robustly quantify tens of thousands of ubiquitination sites across multiple samples is crucial for investigating dynamic biological processes, such as signaling pathway activation [12] or the mode-of-action of deubiquitinase inhibitors [13]. For researchers and drug development professionals requiring the highest quantitative accuracy and reproducibility in their ubiquitin signaling studies, DIA represents the current state-of-the-art methodology.
In mass spectrometry-based proteomics, the completeness and consistency of data are fundamental to drawing reliable biological conclusions. The challenge of missing values—where peptides or proteins are detected in some experimental runs but not in others—poses a significant bottleneck for quantitative studies, potentially skewing statistical analysis and obscuring biologically relevant changes. For years, data-dependent acquisition (DDA) has been the predominant method for discovery proteomics, but its stochastic nature inherently limits data completeness. This comparison guide examines how data-independent acquisition (DIA) mass spectrometry systematically addresses this limitation by reducing missing values and enhancing experimental reproducibility, with particular relevance to ubiquitinome analysis where comprehensive coverage is essential.
The core difference between these acquisition methods lies in their approach to peptide fragmentation. In DDA, the mass spectrometer performs a full scan (MS1) and then selectively isolates the most abundant precursor ions for fragmentation (MS2), effectively capturing only a subset of the proteome in each run. In contrast, DIA fragments all detectable peptides within predefined, sequential mass-to-charge (m/z) windows, creating a permanent digital map of the sample that can be consistently queried across multiple runs [6] [7]. This fundamental distinction in acquisition strategy translates directly to measurable advantages in data quality for DIA, as evidenced by the quantitative comparisons presented in this guide.
Quantitative Comparison: DIA vs. DDA Performance Metrics
Table 1: Direct Performance Comparison Between DIA and DDA Methods
| Performance Metric | Data-Independent Acquisition (DIA) | Data-Dependent Acquisition (DDA) |
|---|---|---|
| Typical Data Completeness | 93-98% [6] [57] | ~69% [6] |
| Quantitative Reproducibility (CV) | <10% median CV [8] [57] | Higher variability, often >20% CV [50] |
| Proteome Coverage (Mouse Liver) | Over 10,000 protein groups [6] | 2,500 - 3,600 protein groups [6] |
| Identification of Ubiquitinated Peptides | >68,000 K-ε-GG peptides [8] | ~21,000 K-ε-GG peptides [8] |
| Dynamic Range | 5-6 orders of magnitude [57] | Limited, biased toward abundant ions |
| Cross-Site Quantitative Consistency | 50% reduction in CV for abundant proteins with multirun alignment [58] | Higher inter-site variability |
The superior quantitative performance of DIA is further exemplified in specialized applications like ubiquitinomics. One study directly comparing DIA with DDA for ubiquitinome profiling reported that DIA more than tripled the number of identified ubiquitinated peptides (68,429 vs. 21,434 K-GG peptides on average) while simultaneously achieving excellent quantitative precision with a median coefficient of variation (CV) of approximately 10% [8]. This substantial improvement in coverage and consistency is critical for ubiquitin signaling studies, where capturing a comprehensive picture of dynamic post-translational modifications is necessary to understand regulatory mechanisms.
Experimental Evidence and Workflow Protocols
Key Experimental Protocols for DIA Ubiquitinome Analysis
The demonstrated performance advantages of DIA are supported by robust experimental methodologies. The following protocol, adapted from a landmark 2021 Nature Communications paper on time-resolved ubiquitinome profiling, outlines a optimized workflow for DIA-based ubiquitinomics [8]:
- Improved Lysis and Protein Extraction: Cells are lysed using a sodium deoxycholate (SDC)-based buffer supplemented with chloroacetamide (CAA), followed by immediate boiling. This method inactivates deubiquitinases more effectively than conventional urea buffers, preserving the ubiquitinome and increasing ubiquitin site coverage by approximately 38% [8].
- Protein Digestion and Peptide Cleanup: Proteins are digested with trypsin, generating peptides with C-terminal diglycine (K-ε-GG) remnants on ubiquitinated lysine residues. Peptides are desalted and quantified.
- Immunoaffinity Enrichment: K-ε-GG peptides are enriched using specific anti-K-ε-GG antibodies (e.g., PTMScan antibodies) to reduce sample complexity and increase the relative abundance of ubiquitinated peptides.
- DIA Mass Spectrometry Acquisition: The enriched peptides are separated by nanoflow liquid chromatography. On the Q-Exactive mass spectrometer, DIA is performed using a method covering a mass range of 400-1200 m/z with 4 m/z isolation windows. MS2 spectra are collected at 17,500 resolution with a normalized collision energy of 25% [8].
- Data Processing with Neural Networks: Raw DIA data are processed using specialized software like DIA-NN [8] [18] with an additional scoring module optimized for modified peptides. Library-free analysis against a sequence database or using a project-specific spectral library is performed, with false discovery rate (FDR) controlled at 1% for both peptides and proteins.
Experimental Workflow Visualization
Multisite Reproducibility Validation
The reproducibility of DIA extends beyond single-laboratory settings. A 2023 multi-site study investigated the quantitative reproducibility of DIA across 11 different LC-MS/MS setups, each analyzing technical replicates of a HEK293 cell lysate [58]. The initial analysis revealed site-specific variations in retention times, a major source of missing data and inconsistent quantification. To address this, the researchers implemented multirun alignment strategies (MST and Progressive alignment) within the DIAlignR workflow, which successfully reduced the cross-site coefficient of variation (CV) for highly abundant proteins by 50% [58]. This demonstrates that with appropriate bioinformatic processing, DIA can maintain its reproducibility advantage even in large-scale, multi-laboratory studies, a common scenario in clinical proteomics and drug development.
The Scientist's Toolkit: Essential Reagents and Software
Successful implementation of a reproducible DIA ubiquitinomics workflow relies on several key reagents and software tools.
Table 2: Essential Research Reagent Solutions for DIA Ubiquitinomics
| Item | Function/Description | Role in Workflow |
|---|---|---|
| Anti-K-ε-GG Antibody | Immunoaffinity enrichment of diglycine remnant peptides | Isolates ubiquitinated peptides from complex digests, significantly increasing coverage and sensitivity [8]. |
| Sodium Deoxycholate (SDC) | Powerful, MS-compatible detergent for cell lysis | Improves protein extraction efficiency and ubiquitin site coverage compared to urea buffers [8]. |
| Chloroacetamide (CAA) | Cysteine alkylating agent | Rapidly alkylates cysteines to prevent disulfide bond formation and inactivates deubiquitinases when used in hot lysis buffer [8]. |
| DIA-NN Software | Deep neural network-based data processing | Enables high-sensitivity, library-free analysis of DIA data; includes specialized scoring for modified peptides like K-ε-GG [8] [18] [45]. |
| iRT Kit | Retention time calibration standards | Spiked-in synthetic peptides for consistent retention time alignment across multiple runs and instruments, crucial for reducing missing values [58]. |
Acquisition Strategy and Data Analysis Logic
The fundamental difference in how DIA and DDA acquire data underpins the disparity in their data completeness. The following diagram illustrates the logical flow of each method and its direct impact on the comprehensiveness of the resulting data.
The DDA workflow's reliance on intensity-based selection creates a stochastic element, where the set of peptides identified can vary significantly between runs, leading to higher rates of missing values when comparing multiple samples [6] [7]. In contrast, the DIA workflow systematically fragments and records all ions, ensuring the same set of peptides is measured in every run. This comprehensive acquisition strategy creates a permanent digital map of the sample, which allows for consistent retrospective analysis of any peptide of interest without the need to re-run samples [6] [57].
The collective experimental evidence demonstrates that Data-Independent Acquisition mass spectrometry provides a definitive advantage over Data-Dependent Acquisition in terms of data completeness and experimental reproducibility. The systematic fragmentation of all ions in DIA leads to a significant reduction in missing values (exceeding 93% data completeness), superior quantitative precision (median CV <10%), and deeper proteome coverage, as validated in both standard proteome and complex ubiquitinome profiling studies [6] [8].
For researchers and drug development professionals, particularly those investigating dynamic signaling processes like ubiquitination, the choice of acquisition method has profound implications. The robustness, reproducibility, and comprehensiveness of DIA data make it exceptionally well-suited for large-scale cohort studies, biomarker discovery, and temporal mechanism-of-action studies, where detecting subtle but biologically significant changes reliably is paramount. As DIA software tools and spectral library resources continue to mature, DIA is positioned to become the new standard for quantitative proteomics, enabling more confident biological insights and accelerating discovery in basic research and therapeutic development.
Mass spectrometry-based proteomics is a cornerstone of modern biological research and biomarker discovery. The choice of data acquisition method—data-dependent acquisition (DDA) versus data-independent acquisition (DIA)—profoundly impacts the depth, accuracy, and reproducibility of results. This comparison guide objectively evaluates the performance of these two methodologies, with a specific focus on evidence from large-scale multicenter studies. Such studies provide the most rigorous validation of a technology's robustness, demonstrating that DIA consistently delivers superior quantitative reproducibility and data completeness across different instrument platforms and laboratories, thereby solidifying its position as the method of choice for large-scale clinical and ubiquitinome profiling studies.
In bottom-up proteomics, proteins are digested into peptides, which are then separated by liquid chromatography and analyzed by tandem mass spectrometry (LC-MS/MS). The method by which peptide ions are selected for fragmentation and analysis defines the two primary acquisition strategies.
Data-Dependent Acquisition (DDA), the long-established method, operates through a cyclical process. The mass spectrometer first performs a full scan (MS1) to record all intact peptide ions. It then automatically selects the most abundant ions from this scan (typically the "top N") for isolation and subsequent fragmentation, acquiring MS2 spectra for peptide identification. This targeted yet stochastic process makes DDA prone to under-sampling lower-abundance peptides and can lead to inconsistent results across replicate runs [40] [16].
Data-Independent Acquisition (DIA) represents a paradigm shift from this targeted isolation. In DIA, the entire mass range is systematically partitioned into consecutive, predefined isolation windows. Within each cycle, all precursor ions within each window are collectively fragmented, without regard to their intensity. This results in highly multiplexed MS2 spectra containing fragment ions from all co-eluting peptides [12] [17]. While this generates more complex data, the deterministic nature of the acquisition ensures that all detectable peptides are sampled in every run, eliminating the stochastic sampling bias of DDA and providing a complete digital record of the sample [7].
The following diagram illustrates the fundamental operational differences between these two approaches.
Multicenter Studies Demonstrate Superior Reproducibility of DIA
The most compelling evidence for the robustness of an analytical technique comes from large-scale, multi-laboratory studies. These studies assess whether a method can yield consistent and comparable results when the same samples are analyzed on different instrument platforms across independent sites, a critical requirement for clinical applications and large collaborative projects.
The MSCoreSys Neat Plasma Benchmark Study
A landmark study under the German MSCoreSys initiative directly addressed this need by benchmarking DIA against DDA using a standardized, multi-species sample set (PYE) designed to mimic the challenges of clinical plasma analysis [59]. The study involved twelve different partner sites, each employing state-of-the-art LC-MS platforms. The samples were centrally prepared and shipped, but each site followed its own protocols without enforced restrictions, simulating a real-world scenario.
Centralized data analysis revealed that DIA methods significantly outperformed DDA-based approaches in terms of identifications, data completeness, accuracy, and precision [59]. A key quantitative metric for reproducibility is the coefficient of variation (CV). The study reported that DIA achieved excellent technical reproducibility, with CVs between 3.3% and 9.8% at the protein level [59]. This demonstrates that DIA can deliver highly precise measurements even in a complex matrix like human plasma, which has a dynamic range of over 11 orders of magnitude.
The Global SWATH-MS Reproducibility Study
In another extensive inter-laboratory assessment, eleven sites worldwide were tasked with analyzing aliquots of the same human cell line (HEK293) digests using SWATH-MS, a specific implementation of DIA [60]. The study demonstrated that participating labs could consistently detect and reproducibly quantify more than 4000 proteins from the complex cell lysate. The quantitative performance, including sensitivity and dynamic range, was uniformly high across all sites. This study concluded that the acquisition of reproducible quantitative proteomics data by multiple labs is achievable with DIA, greatly increasing confidence in its application for large-scale protein quantification [60].
Table 1: Summary of Key Multicenter Study Findings for DIA Performance
| Study | Scale | Sample Type | Key Quantitative Finding | Implication |
|---|---|---|---|---|
| MSCoreSys Plasma Study [59] | 12 sites | Human plasma digest with spike-ins | Protein-level CVs of 3.3% - 9.8% | DIA provides highly precise quantification in a clinically relevant, complex matrix. |
| Global SWATH-MS Study [60] | 11 sites | HEK293 cell digest | Consistent quantification of >4,000 proteins across all sites | DIA is robust and reproducible for large-scale proteome quantification across different laboratories. |
Quantitative Advantages of DIA in Ubiquitinome Analysis
The superior performance of DIA is particularly evident in the analysis of post-translational modifications, such as ubiquitination. Ubiquitinome profiling involves the enrichment of peptides containing a di-glycine (K-ε-GG) remnant left after tryptic digestion of ubiquitinated proteins. The low stoichiometry of this modification makes its comprehensive analysis notoriously challenging.
Direct Comparison of DIA and DDA for Ubiquitinome Profiling
Multiple independent studies have systematically compared DIA and DDA for ubiquitinomics. The results consistently show a dramatic advantage for DIA.
One study developed an optimized DIA workflow for ubiquitinome analysis, which, when compared to state-of-the-art label-free DDA, more than tripled the number of ubiquitinated peptides identified in single MS runs—from 21,434 with DDA to 68,429 with DIA [13]. Furthermore, the DIA data showed excellent quantitative precision, with a median CV of about 10% for all quantified K-GG peptides, and a vastly increased data completeness, with 68,057 peptides quantified in at least three out of several replicates [13].
Another group developed a sensitive DIA workflow combining diGly antibody-based enrichment with optimized Orbitrap-based DIA. They reported the identification of 35,000 diGly peptides in single measurements—double the number achievable with DDA in their setup. Critically, they also demonstrated far better reproducibility: in their replicates, 45% of diGly peptides had CVs below 20% with DIA, compared to only 15% with DDA [12].
Head-to-Head Performance Comparison
The table below synthesizes the quantitative findings from key comparative studies, highlighting the performance gap between DIA and DDA.
Table 2: Direct Performance Comparison: DIA vs. DDA in Ubiquitinome and Proteome Analysis
| Performance Metric | Data-Independent Acquisition (DIA) | Data-Dependent Acquisition (DDA) | Citation |
|---|---|---|---|
| Ubiquitinated Peptides (Single Shot) | >35,000 - 68,000 identifications | ~20,000 identifications | [12] [13] |
| Quantitative Reproducibility (CV < 20%) | 45% of diGly peptides | 15% of diGly peptides | [12] |
| Median Quantitative Precision (CV) | ~10% (Ubiquitinated peptides) | Not Reported (Generally higher) | [13] |
| Inter-lab Reproducibility (Protein CV) | 3.3% - 9.8% (Plasma proteins) | Lower and less consistent | [59] |
| Data Completeness | High; minimal missing values | Lower; significant run-to-run gaps | [59] [13] |
Experimental Protocols for DIA-Based Ubiquitinome Profiling
To achieve the deep and reproducible ubiquitinome coverage described, researchers have refined their experimental protocols. Below is a detailed methodology from a leading study that established a highly robust workflow.
Sample Preparation and Lysis Protocol
- Cell Lysis: Lyse cells or tissues in a lysis buffer containing 4% Sodium Deoxycholate (SDC), 100 mM Tris-HCl (pH 8.5), and 40 mM Chloroacetamide (CAA). The SDC provides efficient protein extraction and digestion, while the high concentration of CAA immediately alkylates cysteine residues to rapidly inactivate deubiquitinases (DUBs), preserving the native ubiquitinome.
- Boiling: Immediately boil the lysates at 95°C for 10 minutes to further denature proteins and fully inactivate enzymes.
- Protein Digestion: Dilute the lysate with 100 mM Tris-HCl (pH 8.5) to reduce the SDC concentration. Digest the proteins with trypsin (enzyme-to-substrate ratio of 1:50) overnight at 37°C.
- Acidification: Acidify the sample with trifluoroacetic acid (TFA) to a final concentration of 1%. This precipitates the SDC, which is then removed by centrifugation.
- Peptide Desalting: Desalt the resulting peptides using C18 solid-phase extraction (SPE) cartridges and dry them down in a vacuum concentrator [13].
DiGly Peptide Enrichment
- Antibody Binding: Resuspend the dried peptide pellets in immunoaffinity purification (IAP) buffer. Enrich the diGly-modified peptides using anti-K-ε-GG remnant motif antibodies (e.g., PTMScan Ubiquitin Remnant Motif Kit). The optimal input is typically 1-2 mg of peptide material.
- Washing and Elution: After incubation, wash the antibody-bound beads extensively with IAP buffer and then with water to remove non-specifically bound peptides. Elute the enriched diGly peptides with 0.15% TFA.
- Stage-Tip Cleaning: Desalt and concentrate the enriched peptides using C18 StageTips before LC-MS/MS analysis [12] [13].
LC-MS/MS Data Acquisition with DIA
- Chromatography: Separate the enriched peptides on a reverse-phase nanoLC column using a medium-length (75-120 min) acetonitrile gradient.
- Mass Spectrometry: Acquire data on a high-resolution Orbitrap mass spectrometer.
- MS1: Acquire at a resolution of 120,000.
- DIA MS2: Use an optimized DIA method with ~40-60 variable-width precursor isolation windows covering the mass range of ~400-1000 m/z. Acquire MS2 spectra at a resolution of 30,000-45,000. The use of narrower windows in crowded m/z regions improves selectivity [12] [13].
Data Processing and Analysis
- Library-Free DIA Analysis: Process the raw DIA data using specialized software like DIA-NN or Spectronaut.
- Search Parameters: Search the data against the appropriate protein sequence database (e.g., Human UniProt). Set carbamidomethylation of cysteine as a fixed modification and protein N-terminal acetylation and methionine oxidation as variable modifications. Specify the diGly (K-ε-GG) remnant on lysine as a variable modification.
- False Discovery Rate (FDR): Control the FDR at both the peptide and protein level to 1% [12] [13].
The following workflow diagram summarizes this optimized protocol for deep ubiquitinome profiling.
The Scientist's Toolkit: Essential Reagents and Software
Successful and reproducible DIA-based ubiquitinome analysis relies on a set of key reagents, instruments, and software tools.
Table 3: Essential Research Reagent Solutions for DIA Ubiquitinome Analysis
| Item | Function / Purpose | Key Consideration / Example |
|---|---|---|
| Anti-K-ε-GG Antibody | Immunoaffinity enrichment of ubiquitin-derived diGly-modified peptides from complex digests. | Critical for specificity and depth. Available commercially (e.g., PTMScan Kit from CST) [12]. |
| SDC Lysis Buffer | Efficient protein solubilization and extraction while enabling rapid protease/deubiquitinase inactivation. | Superior to urea for ubiquitinomics, providing higher yields and better reproducibility [13]. |
| Chloroacetamide (CAA) | Cysteine alkylating agent. | Preferred over iodoacetamide as it avoids di-carbamidomethylation artifacts that can mimic diGly remnants [13]. |
| High-Resolution Mass Spectrometer | Instrument platform for DIA acquisition (e.g., Orbitrap Exploris, timsTOF, TripleTOF). | Must support fast, high-resolution MS2 scanning for deconvoluting complex DIA spectra [17] [60]. |
| DIA Analysis Software | Computational tools to deconvolute multiplexed DIA data and perform peptide-centric quantification. | DIA-NN, Spectronaut, and Skyline are leading tools. They enable high-sensitivity library-free or library-based analysis [59] [17] [13]. |
The body of evidence, particularly from large multicenter studies, provides a clear and compelling validation of Data-Independent Acquisition. When benchmarked against Data-Dependent Acquisition, DIA demonstrates superior quantitative reproducibility, fewer missing values, higher quantitative accuracy, and significantly deeper coverage, especially in challenging applications like ubiquitinome profiling and clinical plasma analysis. The deterministic nature of DIA acquisition makes it inherently robust, a quality confirmed by its ability to deliver consistent results across different laboratories and instrument platforms. For researchers and drug development professionals designing studies where precision, reproducibility, and comprehensive profiling are paramount—such as in biomarker discovery, clinical proteomics, and signaling pathway analysis—DIA represents the current state-of-the-art in mass spectrometry-based proteomics.
The transition from Data-Dependent Acquisition (DDA) to Data-Independent Acquisition (DIA) mass spectrometry represents a fundamental evolution in ubiquitinome analysis. While traditional DDA methods struggle with the dynamic range and stoichiometry challenges inherent to ubiquitination studies, DIA introduces a paradigm shift through its systematic fragmentation of all eluting peptides within predefined isolation windows. This technical advancement directly addresses the critical need in biological research: accurately distinguishing degradative ubiquitination (primarily targeting proteins for proteasomal destruction) from the diverse repertoire of non-degradative ubiquitination signaling that regulates fundamental cellular processes. By providing unparalleled quantitative accuracy, reproducibility, and depth of coverage, DIA enables researchers to move beyond mere cataloging of ubiquitination sites toward meaningful functional interpretation of the ubiquitin code's role in health and disease.
Protein ubiquitination, a reversible post-translational modification involving the covalent attachment of the small protein ubiquitin to substrate proteins, serves as a master regulator of virtually all cellular processes [12] [61]. The functional outcome of ubiquitination is remarkably diverse—while K48-linked polyubiquitin chains typically target substrates for degradation by the 26S proteasome, other chain types (including K63-, K11-, K29-, and K33-linked polymers) and monoubiquitination execute non-degradative functions such as regulating protein activity, subcellular localization, and participation in signaling complexes [61] [62]. This dichotomy presents a fundamental challenge in ubiquitinome research: identifying the site of modification is insufficient; understanding its functional consequence requires distinguishing between these ubiquitin signals.
Mass spectrometry (MS)-based proteomics has become the principal technology for large-scale ubiquitinome profiling, primarily through antibody-based enrichment of tryptic peptides containing the diGlycine (diGly) remnant left after ubiquitinated proteins are digested [12] [61]. For years, Data-Dependent Acquisition (DDA) has been the standard MS acquisition method, but its stochastic nature and dynamic range limitations have constrained progress. The emergence of Data-Independent Acquisition (DIA) offers a transformative approach that fundamentally improves the quantitative precision and comprehensiveness necessary to decode the biological logic of the ubiquitin code.
Technical Showdown: DIA vs. DDA for Ubiquitinome Analysis
Fundamental Acquisition Differences
The core distinction between DDA and DIA lies in their precursor selection mechanisms. In DDA, the mass spectrometer selects the most abundant precursor ions from each survey scan for subsequent fragmentation. This intensity-based selection is inherently stochastic, leading to missing values across samples and compromising quantitative accuracy for lower-abundance ubiquitinated peptides [31].
In contrast, DIA eliminates precursor selection bias by systematically fragmenting all ions within sequential, predefined mass-to-charge (m/z) windows that cover the entire precursor range of interest. This unbiased acquisition captures fragment ion data for all ubiquitinated peptides in a sample, dramatically reducing missing values and enabling more accurate quantification across a wider dynamic range [12] [17].
Performance Benchmarking: Quantitative Evidence
Direct comparative studies demonstrate DIA's substantial advantages for ubiquitinome applications. A landmark study systematically comparing both methods revealed striking differences in performance metrics:
Table 1: Direct Performance Comparison of DIA vs. DDA for Ubiquitinome Analysis
| Performance Metric | DDA Performance | DIA Performance | Improvement |
|---|---|---|---|
| diGly Peptide IDs (single-shot) | ~20,000 peptides | ~35,000 peptides | ~75% increase [12] |
| Quantitative Reproducibility (CV < 20%) | 15% of peptides | 45% of peptides | 3-fold improvement [12] |
| Total Distinct diGly Peptides | 24,000 peptides | 48,000 peptides | 2-fold increase [12] |
| Data Completeness | Higher missing values | Fewer missing values | Enhanced across samples [17] [31] |
The implications of these performance differences extend beyond mere numbers. The superior quantitative accuracy and reproducibility of DIA are particularly crucial for distinguishing degradative from non-degradative ubiquitination, as this often requires monitoring subtle temporal changes in ubiquitination dynamics in response to cellular stimuli [12].
Experimental Framework: DIA Ubiquitinome Profiling Workflow
Optimized DIA Ubiquitinome Protocol
Establishing a robust DIA ubiquitinome workflow requires careful optimization at each step. The following protocol, adapted from pioneering DIA ubiquitinome studies, has demonstrated exceptional performance [12]:
Step 1: Sample Preparation and Proteasome Inhibition (Optional)
- Treat cells (e.g., HEK293, U2OS) with 10 µM MG132 proteasome inhibitor for 4 hours to stabilize ubiquitinated substrates targeted for degradation, thereby enriching for the degradative ubiquitination subpopulation [12].
- Extract proteins using urea-based lysis buffer (8M urea, 100mM Tris/HCl, pH 8.5).
- Reduce with 10mM DTT (90 minutes, 37°C) and alkylate with 50mM IAA (30 minutes, dark).
- Digest with trypsin overnight at 37°C (enzyme-to-substrate ratio 1:50) [62].
Step 2: diGly Peptide Enrichment
- Dissolve peptides in 1.4 mL ice-cold Immunoaffinity Purification (IAP) buffer.
- Enrich diGly-modified peptides using anti-K-ε-GG antibody beads (e.g., PTMScan Ubiquitin Remnant Motif Kit).
- Incubate for 90 minutes at 4°C with gentle agitation.
- Wash beads three times with IAP buffer, followed by three washes with distilled water.
- Elute peptides with 0.15% TFA (2 × 40 μL, 10 minutes each) [12] [62].
Step 3: Liquid Chromatography and DIA Mass Spectrometry Analysis
- Separate peptides using nanoflow liquid chromatography (e.g., 25cm C18 column, 75μm inner diameter).
- Employ a 60-120 minute gradient from 0.1% formic acid to 84% acetonitrile/0.1% formic acid.
- Acquire DIA data on an Orbitrap-based mass spectrometer (e.g., Orbitrap Exploris, Astral, or timsTOF Pro).
- Use optimized DIA method with 46 variable windows covering 400-1000 m/z range.
- Set MS2 resolution to 30,000 for optimal fragment ion detection [12] [62].
Step 4: Data Processing and Bioinformatics
- Process raw data using specialized DIA software (DIA-NN, Spectronaut, or FragPipe).
- Utilize comprehensive spectral libraries (>90,000 diGly peptides) for peak identification.
- Apply false discovery rate (FDR) control at 1% for both peptide and protein levels [45].
- Normalize data and perform statistical analysis to identify differentially ubiquitinated sites.
The following workflow diagram illustrates the optimized DIA ubiquitinome analysis pipeline:
Critical Methodological Considerations
Spectral Library Generation: Comprehensive spectral libraries are foundational to successful DIA ubiquitinome analysis. The most effective approach involves:
- Generating deep reference libraries from multiple cell lines (e.g., HEK293, U2OS) under both proteasome-inhibited and normal conditions.
- Fractionating peptides by basic reversed-phase chromatography into 96 fractions, concatenated into 8 pools to reduce complexity.
- Separately handling K48-linked ubiquitin chain-derived diGly peptides due to their exceptional abundance, which can compete for antibody binding sites [12].
- Merging DDA-derived libraries with direct DIA search results to create hybrid libraries encompassing >90,000 diGly peptides [12].
Antibody and Input Optimization: Titration experiments establish that enrichment from 1mg of peptide material using 31.25μg (1/8 vial) of anti-diGly antibody provides optimal yield and coverage. With DIA's enhanced sensitivity, only 25% of the total enriched material typically requires injection [12].
Successful implementation of DIA ubiquitinome studies requires specific reagents and computational tools. The following table catalogues essential resources:
Table 2: Essential Research Reagents and Resources for DIA Ubiquitinome Analysis
| Category | Specific Product/Software | Function and Application |
|---|---|---|
| Enrichment Antibody | PTMScan Ubiquitin Remnant Motif (K-ε-GG) Kit | Immunoaffinity enrichment of diGly-modified peptides from trypsin-digested samples [12] [62] |
| DIA Analysis Software | DIA-NN | High-speed library-free and predicted-library workflows; excellent for timsTOF ion mobility data [45] [63] |
| Spectronaut | Mature directDIA and library-based modes with comprehensive QC reporting [45] [63] | |
| FragPipe (MSFragger-DIA) | Open, composable pipeline ideal for method development and traceability [45] | |
| Mass Spectrometry Platforms | Orbitrap Exploris/Astral | High-resolution accurate mass systems; optimized for complex PTM analyses [12] [64] |
| timsTOF Pro/HT | Parallel Accumulation-Serial Fragmentation (PASEF) enabled; enhanced sensitivity [62] | |
| Spectral Libraries | Cell Line-Specific Libraries | Project-specific libraries (>90,000 diGly peptides) from relevant biological systems [12] |
Biological Application: Deciphering Circadian Ubiquitination Dynamics
The power of DIA ubiquitinome analysis is exemplified by its application to complex biological systems. A groundbreaking study applied this methodology to investigate ubiquitination dynamics across the circadian cycle, revealing unprecedented insights into temporal regulation of protein stability and function [12].
This systems-wide investigation discovered:
- Hundreds of cycling ubiquitination sites that oscillate with circadian rhythmicity
- Dozens of cycling ubiquitin clusters within individual membrane protein receptors and transporters
- Novel connections between metabolic regulation and circadian biology
These findings would have been impossible with DDA methodology due to its limitations in quantitative accuracy and data completeness across multiple time points. The study successfully differentiated degradative ubiquitination events (showing coordinated oscillation with protein abundance) from non-degradative regulatory events (ubiquitination oscillations without corresponding protein abundance changes), highlighting DIA's unique capability to resolve the functional complexity of the ubiquitin code in dynamic biological systems [12].
DIA mass spectrometry represents a transformative advancement for ubiquitinome analysis, providing the quantitative robustness, reproducibility, and depth of coverage required to distinguish biologically significant degradative and non-degradative ubiquitination events. The methodological framework presented here—encompassing optimized sample preparation, comprehensive spectral libraries, and sophisticated bioinformatics—enables researchers to move beyond mere identification of ubiquitination sites toward meaningful functional interpretation.
As DIA methodologies continue to evolve, several emerging trends promise to further enhance ubiquitinome studies: integration with ion mobility separation for enhanced specificity, implementation of gas-phase fractionation approaches for ultra-deep coverage, and development of artificial intelligence-driven data analysis tools for improved identification confidence [65] [17]. Furthermore, the growing adoption of 4D-proteomics on timsTOF platforms and Orbitrap Astral instruments will likely push the boundaries of sensitivity and throughput [64] [31].
For the research community investigating ubiquitin signaling in contexts ranging from cancer biology to neurodegenerative disease, adopting DIA methodologies provides a critical pathway to unravel the functional complexity of the ubiquitin code and its profound implications for cellular regulation and therapeutic development.
Conclusion
The comprehensive evidence from recent ubiquitinome studies firmly establishes DIA-MS as the superior method for large-scale, quantitative ubiquitin signaling analysis. By delivering dramatically increased coverage, superior quantitative precision, and exceptional reproducibility, DIA enables researchers to dissect the ubiquitinome with unprecedented depth and confidence. This methodological advancement is not merely technical—it unlocks new biological insights, from mapping deubiquitinase substrates to uncovering circadian-regulated ubiquitination clusters. For drug discovery professionals, DIA provides a powerful platform for rapid mode-of-action profiling of DUB inhibitors and targeted protein degradation therapies. As algorithms like DIA-NN and AlphaDIA continue to evolve, making DIA analysis more accessible and powerful, the future of ubiquitinome research will increasingly rely on this transformative technology to illuminate new therapeutic opportunities in oncology, neurodegeneration, and beyond.
References
- 1. The Ubiquitin–Proteasome System in Immune Cells - PMC [https://pmc.ncbi.nlm.nih.gov/articles/PMC7824874/]
- 2. Ubiquitin-like protein conjugation and the ... [https://www.nature.com/articles/nrd3321]
- 3. Modulation of the Ubiquitin-Proteasome System by ... [https://www.sciencedirect.com/science/article/pii/S095528632500289X]
- 4. Ubiquitin/Proteasome System | Cell Metabolism [https://www.tocris.com/cell-biology/ubiquitin-and-proteasome-system]
- 5. Data-independent acquisition method for ubiquitinome ... [https://pmc.ncbi.nlm.nih.gov/articles/PMC7801436/]
- 6. What's the difference between DIA & DDA proteomics? [https://blog.cellsignal.com/deep-proteome-profiling-with-dia]
- 7. DIA vs DDA Mass Spectrometry [https://www.creative-proteomics.com/ngpro/resource-dia-vs-dda-mass-spectrometry-a-comprehensive-comparison.html]
- 8. Time-resolved in vivo ubiquitinome profiling by DIA-MS ... [https://www.nature.com/articles/s41467-021-25454-1]
- 9. Ubiquitin diGLY proteomics as an approach to identify ... - PMC [https://pmc.ncbi.nlm.nih.gov/articles/PMC6791129/]
- 10. exploring the ubiquitin system for drug development [https://www.nature.com/articles/cr201631]
- 11. Emerging drug development technologies targeting ... [https://pmc.ncbi.nlm.nih.gov/articles/PMC7112620/]
- 12. Data-independent acquisition method for ubiquitinome ... [https://www.nature.com/articles/s41467-020-20509-1]
- 13. Time-resolved in vivo ubiquitinome profiling by DIA-MS ... [https://pmc.ncbi.nlm.nih.gov/articles/PMC8438043/]
- 14. What is the difference between DDA and DIA? [https://biognosys.com/what-is-the-difference-between-dda-and-dia/]
- 15. Time-resolved in vivo ubiquitinome profiling by DIA -MS reveals... [https://www.nature.com/articles/s41467-021-25454-1?error=cookies_not_supported&code=636437d9-8baa-4ed3-a190-62aa3bba229c]
- 16. DIA Proteomics vs DDA Proteomics: A Comprehensive ... [https://www.metwarebio.com/dia-vs-dda-proteomics/]
- 17. Data-Independent Acquisition: A Milestone and Prospect in ... [https://www.sciencedirect.com/science/article/pii/S1535947624000902]
- 18. AlphaDIA enables DIA transfer learning for feature-free ... [https://www.nature.com/articles/s41587-025-02791-w]
- 19. Uncovers Alterations in Synaptic Proteins and... Ubiquitinome Analysis [https://pmc.ncbi.nlm.nih.gov/articles/PMC11011669/]
- 20. Analysis of Ubiquitinated Proteome by Quantitative Mass ... [https://pmc.ncbi.nlm.nih.gov/articles/PMC3467951/]
- 21. Analysis of the topology of ubiquitin chains - PMC [https://pmc.ncbi.nlm.nih.gov/articles/PMC6989142/]
- 22. Recent Advances in Glycoproteomic Analysis by Mass ... [https://pmc.ncbi.nlm.nih.gov/articles/PMC7026884/]
- 23. Reproducibility, Specificity and Accuracy of Relative ... [https://pmc.ncbi.nlm.nih.gov/articles/PMC6944235/]
- 24. Data-independent acquisition (DIA) [https://pmc.ncbi.nlm.nih.gov/articles/PMC8674493/]
- 25. a comparative study of DIA and DDA mass spectrometry [https://www.sciencedirect.com/science/article/pii/S2667145X25000240]
- 26. Multicenter evaluation of label-free quantification in human ... [https://www.nature.com/articles/s41467-025-64501-z]
- 27. Improvement of ubiquitylation site detection by Orbitrap ... [https://www.sciencedirect.com/science/article/pii/S1874391917303718]
- 28. Benchmarking commonly used software suites and ... [https://www.nature.com/articles/s41467-022-35740-1]
- 29. A High-Throughput Method for Specific, Rapid, Precise and ... [https://www.sciencedirect.com/science/article/abs/pii/S0039914025015681]
- 30. Chemoproteomics Workflows [https://www.thermofisher.com/us/en/home/industrial/mass-spectrometry/proteomics-mass-spectrometry/chemoproteomics/workflows.html]
- 31. DIA-MS Ubiquitinome Analysis Services [https://www.creative-proteomics.com/ngpro/dia-ms-ubiquitinome-analysis-services.html]
- 32. Tear fluid proteomics: a comparative study of DIA and DDA ... [https://pubmed.ncbi.nlm.nih.gov/41158730/]
- 33. - Library - Free Proteomics... - Creative Proteomics vs Library Based DIA [https://www.creative-proteomics.com/ngpro/resource-library-free-vs-library-based-dia-proteomics.html]
- 34. Benchmarking informatics workflows for data-independent ... [https://pmc.ncbi.nlm.nih.gov/articles/PMC12639053/]
- 35. MaxDIA enables library-based and library-free data ... [https://www.nature.com/articles/s41587-021-00968-7]
- 36. Benchmarking informatics workflows for data-independent ... [https://www.nature.com/articles/s41467-025-65174-4]
- 37. Research A Comparative Analysis of Data Analysis Tools ... [https://www.sciencedirect.com/science/article/pii/S1535947623001342]
- 38. Proteomic approaches to study ubiquitinomics - PMC [https://pmc.ncbi.nlm.nih.gov/articles/PMC10612121/]
- 39. Detection of Protein Ubiquitination Sites by Peptide Enrichment and... [https://www.jove.com/t/59079/detection-protein-ubiquitination-sites-peptide-enrichment-mass]
- 40. Data-dependent vs. Data-independent... | Technology Networks [https://www.technologynetworks.com/proteomics/lists/data-dependent-vs-data-independent-proteomic-analysis-331712]
- 41. Time-resolved in vivo ubiquitinome profiling... | Nature Communications [https://www.nature.com/articles/s41467-021-25454-1?error=cookies_not_supported&code=7be4a0cf-6c32-4654-805c-89de5a39454b]
- 42. Comprehensive characterization of ubiquitinome of human colorectal... [https://translational-medicine.biomedcentral.com/articles/10.1186/s12967-022-03645-8]
- 43. Study of Comparative and DDA Acquisition Modes on... DIA [https://app.jove.com/t/69227/comparative-study-dda-dia-acquisition-modes-on-uplc-q-orbitrap-mass]
- 44. Small Molecule‐Induced Alterations of Protein ... [https://pmc.ncbi.nlm.nih.gov/articles/PMC12322627/]
- 45. DIA-NN, Spectronaut, FragPipe [https://www.creative-proteomics.com/ngpro/resource-dia-proteomics-software-comparison-diann-spectronaut-fragpipe.html]
- 46. vdemichev/DiaNN: DIA-NN - a universal automated ... [https://github.com/vdemichev/DiaNN]
- 47. Biognosys Launches Spectronaut 20 and SpectroMine 5, ... [https://biognosys.com/news/biognosys-launches-spectronaut-20-and-spectromine-5-setting-new-benchmarks-in-immunopeptidomics/]
- 48. Deubiquitinating enzymes and the proteasome regulate ... [https://www.nature.com/articles/s41467-022-30376-7]
- 49. Optimization of Experimental Parameters in Data ... [https://pmc.ncbi.nlm.nih.gov/articles/PMC5724188/]
- 50. Impact of the identification strategy on the reproducibility of ... [https://pmc.ncbi.nlm.nih.gov/articles/PMC7898222/]
- 51. Benchmarking of analysis strategies for data-independent ... [https://www.nature.com/articles/s41467-022-30094-0]
- 52. DIAlignR Provides Precise Retention Time Alignment ... [https://pmc.ncbi.nlm.nih.gov/articles/PMC6442363/]
- 53. Localization of Organelle Proteins Using Data-Independent ... [https://pmc.ncbi.nlm.nih.gov/articles/PMC12455123/]
- 54. Data-Driven Optimization of DIA Mass Spectrometry by DO-MS [https://pubmed.ncbi.nlm.nih.gov/37695820/]
- 55. Acquisition Mode Showdown: Mass vs. Spectrometry vs.... DDA DIA [https://www.metwarebio.com/mass-spectrometry-acquisition-modes-dda-vs-dia-vs-mrm-vs-prm/]
- 56. Analysis of DIA proteomics data using MSFragger-DIA and ... [https://www.nature.com/articles/s41467-023-39869-5]
- 57. Proteomics Service - Creative Proteomics DIA [https://www.creative-proteomics.com/ngpro/dia-quantitative-proteomics-service.html]
- 58. Achieving quantitative reproducibility in label-free multisite DIA ... [https://www.nature.com/articles/s42003-023-05437-2?error=cookies_not_supported&code=6eb00055-6f85-4891-905d-4110a8c84ddc]
- 59. Multicenter evaluation of label-free quantification in human ... [https://pmc.ncbi.nlm.nih.gov/articles/PMC12491457/]
- 60. Multi-laboratory assessment of reproducibility, qualitative ... [https://www.nature.com/articles/s41467-017-00249-5]
- 61. Ubiquitomics: An Overview and Future [https://www.mdpi.com/2218-273X/10/10/1453]
- 62. Differential analysis of ubiquitin-proteomics in skeletal ... [https://www.frontiersin.org/journals/veterinary-science/articles/10.3389/fvets.2024.1455338/full]
- 63. Optimizing differential expression analysis for proteomics ... [https://www.nature.com/articles/s41467-024-47899-w]
- 64. Ubiquitination Proteomics [https://www.completeomics.com/ubiquitination-proteomics/]
- 65. Advanced mass spectrometry techniques for monitoring ... [https://www.sciencedirect.com/science/article/pii/S0167779925003117]