Evaluating Database Search Algorithms for Ubiquitination Site Prediction: A Comprehensive Guide for Biomedical Researchers
This article provides a systematic evaluation of database search algorithms for ubiquitination site identification, addressing both computational prediction tools and mass spectrometry-based methods.
Evaluating Database Search Algorithms for Ubiquitination Site Prediction: A Comprehensive Guide for Biomedical Researchers
Abstract
This article provides a systematic evaluation of database search algorithms for ubiquitination site identification, addressing both computational prediction tools and mass spectrometry-based methods. We explore foundational biological concepts of ubiquitination and examine diverse algorithmic approaches including traditional machine learning, deep learning architectures, and advanced mass spectrometry techniques like DIA-MS. The content covers practical implementation strategies, troubleshooting common challenges with imbalanced data and experimental workflows, and rigorous validation methodologies. Aimed at researchers, scientists, and drug development professionals, this resource offers critical insights for selecting, optimizing, and validating ubiquitination site detection methods to advance understanding of cellular regulation and therapeutic development.
Ubiquitination Biology and Computational Prediction Fundamentals
The Biological Significance of Ubiquitination in Cellular Regulation and Disease
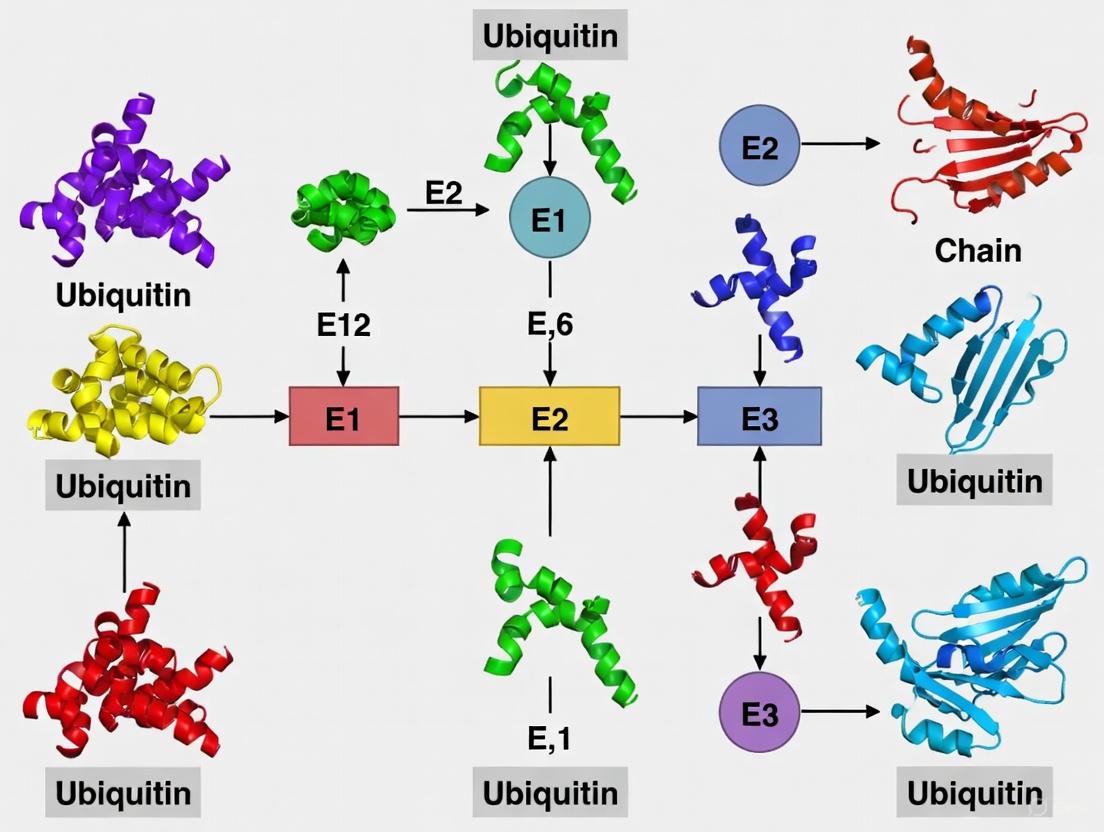
Ubiquitination is a reversible post-translational modification (PTM) characterized by the covalent attachment of ubiquitin, a 76-amino acid protein, to lysine (K) residues on target proteins [1] [2]. This highly conserved process requires a sequential enzymatic cascade involving E1 (activation), E2 (conjugation), and E3 (ligation) enzymes that ultimately attach the C-terminal glycine of ubiquitin to the ε-amino group of substrate lysines [2]. The resulting modification serves as a versatile regulatory signal that extends far beyond its initial recognition as a mere marker for proteasomal degradation. The biological significance of ubiquitination spans virtually all eukaryotic cellular processes, including DNA repair, cell cycle control, transcriptional regulation, signal transduction, endocytosis, and immune response [1] [2] [3].
The critical importance of ubiquitination in maintaining cellular homeostasis becomes strikingly evident when this system becomes dysregulated. Abnormal ubiquitination has been implicated in numerous pathological conditions, including cancer, autoimmune disorders, inflammatory diseases, diabetes, and neurodegenerative conditions such as Alzheimer's and Parkinson's disease [2] [4]. The ubiquitin-proteasome system regulates the stability of key regulatory proteins including tumor suppressors, oncoproteins, and cell cycle regulators, making it a crucial focus for therapeutic development [5] [3]. Consequently, comprehensive understanding and accurate identification of ubiquitination sites have become essential objectives in biomedical research, driving the development of both experimental and computational approaches for ubiquitination site detection.
Experimental Methods for Ubiquitination Site Detection
Mass Spectrometry-Based Approaches
Mass spectrometry (MS) has emerged as the predominant experimental method for large-scale identification, mapping, and quantification of ubiquitination sites [2]. The typical MS-based workflow involves several critical steps: (1) enrichment of ubiquitinated peptides using affinity reagents such as specific antibodies or ubiquitin-binding domains; (2) proteolytic digestion (usually with trypsin or Glu-C); (3) liquid chromatography separation; (4) tandem mass spectrometry analysis; and (5) computational analysis of resulting spectra for site identification [6] [3].
Recent methodological advances have significantly improved the sensitivity and specificity of ubiquitination site detection. One notable innovation involves the use of engineered protein affinity reagents, such as the GST-qUBA reagent consisting of four tandem repeats of ubiquitin-associated domain from UBQLN1 fused to a GST tag [6]. This approach enabled the isolation of polyubiquitinated proteins and identification of 294 endogenous ubiquitination sites on 223 proteins from human 293T cells without requiring proteasome inhibitors or ubiquitin overexpression [6]. Interestingly, mitochondrial proteins constituted 14.7% of the identified sites, implicating ubiquitination in a wide range of previously underappreciated mitochondrial functions [6].
Despite its power, MS-based identification faces several challenges, including the rapid turnover of ubiquitinated proteins, the large size of the ubiquitin modifier, and the dynamic nature of the modification itself [3]. Furthermore, these experimental approaches remain expensive, time-consuming, and labor-intensive, prompting the development of complementary computational methods for large-scale ubiquitination site prediction [1] [2].
Table 1: Essential Research Reagents for Ubiquitination Studies
| Reagent Type | Specific Examples | Function/Application |
|---|---|---|
| Affinity Reagents | GST-qUBA, Ubiquitin-binding domains (UBA, UIM, UBAN) | Enrichment of ubiquitinated proteins/peptides for mass spectrometry |
| Enzymes | E1 activating enzymes, E2 conjugating enzymes, E3 ligases, Deubiquitinases (DUBs) | Studying ubiquitination machinery and reversal mechanisms |
| Cell Lines | HEK293T, Yeast mutant strains (CDC34tm, grr1Δ) | Model systems for studying ubiquitination pathways |
| Protease Inhibitors | Proteasome inhibitors (MG132, Bortezomib) | Stabilization of ubiquitinated proteins by blocking degradation |
| Specific Antibodies | Anti-ubiquitin, Anti-diGly remnant antibodies | Immunoprecipitation and detection of ubiquitinated proteins |
| Database Resources | PLMD, mUbiSiDa, dbPTM, UniProt | Curated repositories of experimentally validated ubiquitination sites |
Figure 1: Ubiquitination Enzymatic Cascade. The three-step enzymatic process of ubiquitin attachment involving E1, E2, and E3 enzymes.
Computational Prediction of Ubiquitination Sites
Evolution of Prediction Methodologies
The limitations of experimental approaches for ubiquitination site identification have stimulated the development of numerous computational prediction tools. These methods have evolved substantially from early feature-based machine learning approaches to contemporary deep learning architectures. Initial methods primarily relied on manually crafted features such as amino acid composition (AAC), position-specific scoring matrices (PSSM), physico-chemical properties (PCPs), and composition of k-spaced amino acid pairs (CKSAAP) combined with classifiers like Support Vector Machines (SVM) and Random Forests [1] [2] [7].
Notable early tools included UbPred, which utilized random forest classifiers and achieved 72% accuracy with AUC of 0.80 [3], and UbiSite, which fused multiple features into a two-layer SVM model [1]. However, these traditional machine learning approaches often struggled with feature engineering limitations, requiring extensive domain expertise and potentially introducing bias through redundant or incomplete feature representations [1].
The field has subsequently witnessed a significant shift toward deep learning approaches that can automatically learn relevant features from large-scale data. Modern architectures including convolutional neural networks (CNNs), multimodal deep architectures, and capsule networks have demonstrated remarkable improvements in prediction accuracy [1] [2] [4]. For instance, the multimodal deep architecture described in [1] processes raw protein sequences, physico-chemical properties, and evolutionary profiles through separate sub-networks, achieving 66.43% accuracy on the large-scale PLMD database.
Comparative Performance of Prediction Tools
Table 2: Performance Comparison of Ubiquitination Site Prediction Tools
| Tool | Methodology | Accuracy | Sensitivity | Specificity | AUC | MCC |
|---|---|---|---|---|---|---|
| Multimodal Deep Architecture [1] | Multimodal CNN | 66.43% | 66.7% | 66.4% | - | 0.221 |
| UbPred [3] | Random Forest | 72.0% | - | - | 0.80 | - |
| ESA-UbiSite [8] | Evolutionary Screening + SVM | 92.0% | - | - | - | - |
| UbiNets [9] | DenseNet Architecture | 92.0% | - | - | - | - |
| MDCapsUbi [4] | Capsule Network | 91.82% | 91.39% | 92.24% | 0.97 | 0.837 |
| Hybrid DL Model [2] | Deep Learning with Hand-crafted Features | 81.98% | 91.47% | - | - | - |
Recent benchmarking studies have provided valuable insights into the relative performance of different computational approaches. A comprehensive 2023 evaluation comparing ten machine learning-based approaches across three categories (feature-based conventional ML, end-to-end sequence-based DL, and hybrid feature-based DL) revealed that deep learning methods consistently outperformed classical machine learning approaches [2]. The best-performing model achieved a 0.902 F1-score, 0.8198 accuracy, 0.8786 precision, and 0.9147 recall using a hybrid approach that combined raw amino acid sequences with hand-crafted features [2].
Interestingly, this study also discovered a positive correlation between model performance and the length of amino acid fragments used for training, suggesting that utilizing entire protein sequences rather than short windows around candidate sites may yield more accurate predictions [2]. This finding has significant implications for future method development and highlights the importance of considering contextual protein information beyond immediate flanking regions.
Advanced Deep Learning Architectures for Ubiquitination Site Prediction
Multimodal Deep Architecture
The multimodal deep architecture represents a significant advancement in ubiquitination site prediction by addressing three key challenges: limitations of artificially designed features, heterogeneity among different feature types, and unbalanced distribution between positive and negative samples [1]. This approach processes three distinct protein modality representations through specialized sub-networks:
- Raw Sequence Processing: One-hot encoded protein sequence fragments are processed through 1D convolutional neural networks (CNNs) to detect implicit sequence patterns [1].
- Physico-chemical Properties: Thirteen carefully selected physico-chemical properties strongly associated with ubiquitination are analyzed through stacked fully connected layers [1].
- Evolutionary Profiles: Position-specific scoring matrices (PSSM) generated via BLAST searches against Swiss-Prot provide evolutionary constraints and are processed through additional CNN layers [1].
The outputs from these three sub-networks are subsequently merged to build the final prediction model. This architecture demonstrated its effectiveness on the Protein Lysine Modification Database (PLMD), which contains 121,742 ubiquitination sites from 25,103 proteins, making it one of the most comprehensive assessments of computational ubiquitination site prediction to date [1].
Capsule Network-Based Approaches
More recently, capsule networks have emerged as promising alternatives to traditional CNNs for ubiquitination site prediction. The MDCapsUbi model represents a sophisticated implementation of this approach, addressing several limitations of conventional deep learning methods [4]. This architecture consists of three main components:
- Sequence Encoding Module: Intercepts raw protein sequences into fragments and encodes amino acids as numerical vectors [4].
- Multi-dimensional Feature Recognition Module: Identifies hidden features through convolution operations and channel attention mechanisms across both sequence and feature map dimensions [4].
- Capsule Network Module: Fuses and refines features from multiple dimensions into capsule vectors that effectively represent hierarchical relationships between low-level and high-level features [4].
A key advantage of capsule networks is their ability to preserve spatial relationships between features through vector-based representations rather than the scalar activations used in traditional CNNs. This enables more effective modeling of complex motifs and patterns associated with ubiquitination sites [4]. The MDCapsUbi model achieved impressive performance metrics with 91.82% accuracy, 91.39% sensitivity, 92.24% specificity, 0.837 MCC, and 0.97 AUC using ten-fold cross-validation [4].
Figure 2: MDCapsUbi Architecture. The capsule network-based model for ubiquitination site prediction incorporating multi-dimensional feature recognition.
Specialized Ubiquitination Databases
The development and validation of computational prediction tools rely heavily on comprehensive, well-curated databases of experimentally verified ubiquitination sites. Several specialized resources have been developed to address this need:
PLMD (Protein Lysine Modification Database): This specialized database contains 20 types of protein lysine modifications, extending from CPLA 1.0 and CPLM 2.0 datasets [1]. The latest version includes 25,103 proteins with 121,742 ubiquitination sites, making it the largest available resource for ubiquitination site prediction [1] [4].
mUbiSiDa (Mammalian Ubiquitination Site Database): This comprehensive resource focuses specifically on mammalian ubiquitination sites, containing approximately 35,494 experimentally validated ubiquitinated proteins with 110,976 ubiquitination sites across five species [5]. Approximately 95% of these sites are from human and mouse, providing a valuable resource for biomedical research [5].
dbPTM: This general PTM database incorporates substantial ubiquitination site information and has been used in several benchmarking studies [2]. The 2019 and 2022 versions have provided standardized datasets for fair comparison of different prediction methods [2].
These databases not only facilitate information retrieval but also enable studies of cross-regulation between different post-translational modifications and investigation of molecular mechanisms underlying protein stability-related cellular processes [5].
Data Processing and Curation
High-quality database construction requires rigorous data processing to ensure reliability and minimize bias. Common procedures include:
- Data Collection: Experimentally identified ubiquitination sites are gathered from published literature through PubMed searches and international databases like UniProt [5].
- Homology Reduction: Tools like CD-HIT are employed to remove similar protein sequences (typically at 40% similarity threshold) to prevent overrepresentation of certain protein families [1] [4].
- Validation: Manual curation eliminates predicted lysine modifications without reference support, ensuring only experimentally verified sites are included [5].
- Dataset Partitioning: Proteins are divided into training and testing datasets via random partition for model construction and evaluation [1].
These meticulous curation processes are essential for developing unbiased predictive models and generating reliable benchmarking datasets for tool comparison.
Implications for Disease Mechanisms and Therapeutic Development
The central role of ubiquitination in cellular regulation directly links its dysregulation to numerous disease pathways. Computational analyses have revealed that proteins involved in specific functional categories display particularly high extents of ubiquitination. In the human proteome, cytoskeletal proteins, cell cycle regulators, and cancer-associated proteins show significantly higher levels of predicted ubiquitination sites compared to proteins from other functional categories [3].
Notably, gain or loss of ubiquitination sites may represent a molecular mechanism underlying numerous disease-associated mutations [3]. For example, aberrant ubiquitination of tumor suppressor proteins or oncoproteins can disrupt normal cellular growth control, contributing to cancer development [5] [3]. In neurodegenerative diseases, impaired ubiquitin-proteasome function leads to abnormal protein accumulation, a hallmark of conditions like Alzheimer's and Parkinson's disease [2] [4].
The improved accuracy of ubiquitination site prediction tools has significant implications for drug development. As the ubiquitin-proteasome system gains recognition as a therapeutic target, computational identification of ubiquitination sites can guide the development of targeted therapies that modulate specific ubiquitination events. Several successful drugs already target this system, including proteasome inhibitors used in cancer treatment, and emerging strategies aim to develop specific E3 ligase inhibitors or activators for more precise therapeutic interventions [4].
The field of ubiquitination site prediction has evolved dramatically from early feature-based machine learning approaches to sophisticated deep learning architectures that automatically extract relevant patterns from large-scale biological data. Current state-of-the-art methods, particularly multimodal deep architectures and capsule networks, have demonstrated remarkable performance improvements, achieving accuracy levels exceeding 90% in some implementations [1] [4].
Future developments will likely focus on several promising directions. Integration of additional contextual information, such as protein structural features and interaction network data, may further enhance prediction accuracy. Species-specific modeling approaches that account for differences in ubiquitination machinery across organisms will improve the relevance of predictions for particular experimental systems [7]. Additionally, the development of explainable AI methods that provide biological insights alongside predictions will increase the utility of these tools for hypothesis generation and experimental design.
As these computational methods continue to mature, they will play an increasingly vital role in bridging the gap between large-scale proteomic data and biological understanding, ultimately accelerating research into the fundamental mechanisms of cellular regulation and disease pathogenesis. The integration of computational predictions with targeted experimental validation represents a powerful strategy for comprehensively mapping the ubiquitin landscape and exploiting this knowledge for therapeutic benefit.
Protein ubiquitination, the process by which a small regulatory protein called ubiquitin is covalently attached to target proteins, represents one of the most important post-translational modifications (PTMs) in eukaryotic cells [10] [11]. This versatile modification regulates diverse fundamental features of protein substrates, including stability, activity, and localization, with dysregulation leading to many pathologies such as cancer and neurodegenerative diseases [11]. The systematic study of ubiquitination has generated massive datasets requiring specialized bioinformatics resources for organization, annotation, and dissemination. Three databases have emerged as cornerstone resources for the ubiquitination research community: dbPTM, PLMD, and PhosphoSitePlus. This comparison guide provides an objective evaluation of these resources within the broader context of evaluating different database search algorithms for ubiquitination site research, enabling researchers to select the most appropriate tools for their specific investigative needs.
dbPTM: An Integrated Resource for Multiple PTM Types
The dbPTM database represents a comprehensive resource that integrates experimentally verified PTMs from multiple sources including UniProtKB/Swiss-Prot, PhosphoSitePlus, and manual curation of literature [12]. In its 2022 update, dbPTM accumulated over 2.77 million PTM substrate sites, with more than 2.23 million entries being experimentally verified [12]. While encompassing numerous modification types, its ubiquitination data is substantial, with current statistics showing 456,653 ubiquitination sites in its collection [13]. A key strength of dbPTM is its focus on functional and structural analyses for PTM sites, including information on upstream regulatory proteins and their integration into protein-protein interaction networks [12]. The database also incorporates disease associations based on non-synonymous single nucleotide polymorphisms (nsSNPs) that occur near PTM sites, providing clinical context to the modification data [13].
PLMD: A Specialized Protein Lysine Modification Database
The Protein Lysine Modification Database (PLMD) takes a specialized approach, focusing exclusively on PTMs occurring at lysine residues [14]. This dedicated focus has enabled PLMD to become one of the most comprehensive resources for ubiquitination and other lysine-directed modifications. The database contains 284,780 modification events across 53,501 proteins from 176 eukaryotes and prokaryotes, covering 20 different types of lysine modifications [14]. PLMD is particularly valuable for studying crosstalk between different modification types on the same lysine residues, having identified 65,297 PLM events involved in 90 types of PLM co-occurrences [14]. The database's specialized nature makes it particularly useful for researchers specifically investigating the complex interplay of modifications at lysine residues, which serve as the exclusive attachment points for ubiquitin.
PhosphoSitePlus: A Leading PTM Resource with Extensive Curation
PhosphoSitePlus (PSP) represents one of the most extensive and highly curated resources for PTM information, originally focusing on phosphorylation but subsequently expanding to include ubiquitination, acetylation, and other modifications [15] [16] [17]. Created with grant support from the NIH and curated by Cell Signaling Technology scientists, PSP is uniquely characterized by its manual curation process that has been maintained for over fifteen years, with more than 20,000 articles compiled [17]. This resource contains over 500,000 PTM sites collectively, with phosphorylation, ubiquitylation, and acetylation sites representing over 90% of the modification types [17]. PSP integrates thousands of disease mutations, allowing researchers to analyze intersections between genetic variants and PTM sites [17]. The database also provides information on upstream-downstream relationships and regulatory networks, making it particularly valuable for signaling pathway analysis.
Comparative Analysis of Database Features
Table 1: Core Database Characteristics and Ubiquitination Content
| Feature | dbPTM | PLMD | PhosphoSitePlus |
|---|---|---|---|
| Primary Focus | Comprehensive PTM resource | Exclusive lysine modifications | Multi-PTM with signaling emphasis |
| Total Ubiquitination Sites | 456,653 [13] | 121,742 (in PLMD 3.0) [18] | 18,996 (as of 2011, significant growth since) [16] |
| Data Sources | Public DBs, manual literature curation | Manual literature curation, specialized datasets | Manual LTP curation, HTP MS datasets |
| Species Coverage | Broad, multiple organisms | 176 eukaryotes and prokaryotes [14] | Predominantly mammalian (99.7%) [16] |
| Ubiquitin Linkage Information | Limited | Not specialized | Limited, though some linkage-specific data |
| Regulatory Network Integration | Upstream regulatory proteins, PPI networks [12] | Motif analysis, modification crosstalk [14] | Kinase-substrate relationships, pathway context |
| Disease Association | nsSNP integration [13] | Limited disease focus | Extensive disease mutation integration [17] |
| Update Frequency | Regular updates | Version-based updates | Continuous updates with NIH support |
Table 2: Experimental and Analytical Method Support
| Methodological Aspect | dbPTM | PLMD | PhosphoSitePlus |
|---|---|---|---|
| MS Data Integration | Extensive MS-based proteomics data [12] | LC-MS techniques, pan-antibody data [14] | Extensive HTP MS datasets, LTP validation [16] [17] |
| Antibody-Based Data | Incorporated | Specialized anti-diGly antibody data [14] | Strong antibody validation, commercial links [16] |
| Computational Predictions | Integrated prediction tools | Motif-based analysis [14] | Limited prediction focus |
| Curation Approach | Hybrid: automated + manual | Manual literature curation | Extensive manual curation (>20,000 articles) [17] |
| Tool Integration | PTM prediction resources | Limited tool integration | Sequence logos, Cytoscape plugin, BioPAX [16] |
| Data Export Capabilities | Available | Multiple access options [14] | Extensive download options |
Ubiquitination Site Identification Methods
The databases rely on complementary experimental methodologies for ubiquitination site identification, which influences the nature and quality of their data:
Mass Spectrometry Approaches: All three databases heavily incorporate mass spectrometry data, with particular emphasis on enrichment strategies to overcome the low stoichiometry of ubiquitination. These include antibody-based enrichment using anti-diGly antibodies that recognize the glycine-glycine remnant left on trypsin-digested ubiquitinated peptides [14] [11], ubiquitin tagging approaches expressing epitope-tagged ubiquitin (e.g., His, Strep) for affinity purification [11], and ubiquitin-binding domain (UBD) based methods using tandem-repeated Ub-binding entities for higher affinity capture [11].
Experimental Validation Methods: Traditional biochemical approaches remain important, including immunoblotting with anti-ubiquitin antibodies following lysine-to-arginine mutations to validate specific modification sites [11]. While low-throughput, these methods provide functional validation that complements high-throughput MS identifications.
Experimental Workflow for Ubiquitination Site Detection and Database Integration
Research Applications and Integration with Analysis Tools
Pathway Analysis and Visualization
The integration of ubiquitination data with pathway analysis tools represents a growing area of development. PTMNavigator, recently introduced as part of the ProteomicsDB platform, provides interactive visualization of PTM data within signaling pathways [19]. This tool enables researchers to overlay experimental ubiquitination data onto ~3000 canonical pathways from manually curated databases, allowing for the examination of how ubiquitination events regulate cellular signaling networks [19]. The software automatically runs kinase and pathway enrichment algorithms whose results are directly integrated into the visualization, providing a comprehensive view of the intricate relationship between PTMs and signaling pathways [19].
Computational Prediction of Ubiquitination Sites
Complementing the experimental data within these databases, numerous computational approaches have been developed to predict ubiquitination sites, which can inform subsequent experimental validation:
Machine Learning and Deep Learning Approaches: Recent advances have demonstrated the effectiveness of deep learning architectures for large-scale ubiquitination site prediction. Multimodal deep architectures that integrate raw protein sequence fragments, physico-chemical properties, and position-specific scoring matrices (PSSM) have shown superior performance compared to traditional feature-based methods [18]. Hybrid models using both raw amino acid sequences and hand-crafted features with deep neural networks have achieved performance metrics up to 0.902 F1-score and 0.8198 accuracy [10].
Feature Selection for Prediction: Critical features for successful ubiquitination site prediction include evolutionary information captured in PSSM profiles, physico-chemical properties of amino acids (e.g., isoelectric point, entropy of formation, flexibility parameters), and sequence-based patterns around candidate ubiquitination sites [18] [10]. These computational approaches are particularly valuable for directing experimental resources toward high-probability ubiquitination sites.
Ubiquitination Cascade and Functional Outcomes Annotated in Databases
Table 3: Key Research Reagents and Computational Tools for Ubiquitination Studies
| Resource Type | Specific Examples | Research Application | Database Integration |
|---|---|---|---|
| Linkage-Specific Antibodies | K48-, K63-, M1-linkage specific antibodies [11] | Enrichment and detection of specific ubiquitin chain types | PhosphoSitePlus, PLMD |
| Epitope Tags for Affinity Purification | His, Strep, HA, Flag tags [11] | Purification of ubiquitinated proteins in tagging systems | PLMD, dbPTM |
| Pan-Ubiquitin Antibodies | P4D1, FK1/FK2 antibodies [11] | General detection and enrichment of ubiquitinated proteins | All databases |
| Deubiquitinase Inhibitors | PR-619, P22077 | Stabilizing ubiquitination events by preventing deubiquitination | Limited integration |
| Proteasome Inhibitors | MG132, Bortezomib | Accumulation of polyubiquitinated proteins destined for degradation | Limited integration |
| Computational Prediction Tools | DeepUbiquitylation, UbiPred, iUbiq-Lys [18] [10] | In silico identification of potential ubiquitination sites | dbPTM |
| Pathway Analysis Platforms | PTMNavigator, Cytoscape with PhosphoPath [19] | Contextualizing ubiquitination in signaling networks | PhosphoSitePlus |
The comparative analysis of dbPTM, PLMD, and PhosphoSitePlus reveals complementary strengths that can guide researchers in selecting appropriate databases for specific investigative contexts. dbPTM excels as a comprehensive multi-PTM resource with extensive integration of computationally predicted features and structural analyses. PLMD provides specialized focus on lysine modifications with detailed information on modification crosstalk, making it invaluable for studying the complex interplay at specific lysine residues. PhosphoSitePlus offers unparalleled manual curation depth with strong emphasis on biological context and disease associations.
For researchers designing studies of ubiquitination sites, we recommend a sequential database approach: beginning with PhosphoSitePlus for its curated functional annotations and disease context, expanding to PLMD for detailed analysis of lysine modification crosstalk, and utilizing dbPTM for structural insights and integration with computational prediction tools. The emerging integration of these resources with visualization platforms like PTMNavigator represents a promising direction for contextualizing ubiquitination within broader signaling networks, ultimately accelerating our understanding of this critical regulatory mechanism in health and disease.
Ubiquitination is a crucial post-translational modification (PTM) that involves the covalent attachment of a 76-residue ubiquitin protein to lysine (K) residues on substrate proteins [20]. This modification regulates diverse cellular processes, including targeted protein degradation, subcellular trafficking, and protein-protein interactions [20]. During mass spectrometry (MS) analysis, tryptic digestion of ubiquitinated proteins generates a characteristic di-glycine (K-GG) remnant attached to the modified lysine residue, resulting in a detectable mass shift of +114.0429 Da [20]. The identification of these K-GG modified peptides is essential for understanding ubiquitination's role in various biological processes and disease mechanisms, such as cancer and neurodegeneration [20] [1].
Within the broader context of evaluating database search algorithms for ubiquitination site research, accurate detection methods form the foundational data layer upon which algorithmic performance depends. This guide objectively compares the performance characteristics of K-GG peptide enrichment against alternative methodologies, providing researchers with experimental data to inform their proteomics workflow design.
Fundamental Principles and Methodologies
The Ubiquitination Process and Mass Spectrometry Detection
The ubiquitination cascade involves a sequential enzymatic mechanism: an E1 activating enzyme charges ubiquitin, which is transferred to an E2 conjugating enzyme, and an E3 ligase finally facilitates ubiquitin attachment to the substrate protein [20]. In proteomics analysis, tryptic digestion cleaves proteins after arginine and lysine residues, but when a lysine is modified by ubiquitination, trypsin cannot cleave at that site. Instead, the C-terminal glycine-glycine motif of ubiquitin remains attached to the modified lysine, creating the distinctive K-GG signature that can be identified via mass spectrometry [20].
Mass spectrometry detects ubiquitination sites through several approaches. In MS1 spectra, the K-GG modification produces a characteristic mass shift, while in tandem MS/MS, fragmentation patterns reveal sequence information including the modified residue [20] [21]. Different fragmentation techniques yield distinct fragment patterns: collision-induced dissociation (CID) primarily generates b and y ions, while electron-transfer dissociation (ETD) produces c and z ions and better preserves labile post-translational modifications [21] [22].
K-GG Peptide Immunoaffinity Enrichment Workflow
K-GG peptide immunoaffinity enrichment employs antibodies specifically raised against the di-glycine remnant motif to selectively isolate modified peptides from complex protein digests [20]. The typical workflow begins with protein extraction from biological samples, often using RIPA or Nonidet P-40 buffer systems supplemented with protease inhibitors to preserve modifications [20]. Following extraction, proteins undergo reduction and alkylation to break disulfide bonds and prevent reformation, then tryptic digestion to generate peptides including K-GG modified species [20].
The critical enrichment step involves incubating the peptide mixture with anti-K-GG antibodies conjugated to solid supports. After extensive washing to remove non-specifically bound peptides, the enriched K-GG peptides are eluted for LC-MS/MS analysis [20]. This method has demonstrated capability to identify thousands of ubiquitination sites from just 1 mg of input material, making it exceptionally efficient for global ubiquitinome profiling [20]. Recent advancements include tandem enrichment approaches like SCASP-PTM that enable simultaneous purification of ubiquitinated, phosphorylated, and glycosylated peptides from a single sample without intermediate desalting steps [23].
Performance Comparison of Ubiquitination Site Detection Methods
Experimental Data and Quantitative Performance Metrics
Direct comparison of K-GG peptide immunoaffinity enrichment with alternative methods reveals significant performance differences. In a controlled study using SILAC-labeled lysates, researchers quantitatively compared abundances of individual K-GG peptides from samples prepared in parallel using different methods [20]. The results demonstrated that K-GG peptide immunoaffinity enrichment consistently yielded greater than fourfold higher levels of modified peptides than affinity-purification mass spectrometry (AP-MS) approaches [20].
Table 1: Quantitative Comparison of Ubiquitination Site Detection Methods
| Method | Sensitivity | Specificity | Number of Sites Identified | Starting Material | Key Applications |
|---|---|---|---|---|---|
| K-GG Peptide Immunoaffinity Enrichment | ~66.7% [1] | ~66.4% [1] | >5,000 sites [20] | 1 mg protein [20] | Global ubiquitinome profiling, focused site mapping |
| Protein-Level AP-MS | Lower than K-GG method [20] | Similar to K-GG method | Limited sites per experiment [20] | 10 mg protein [20] | Specific protein complex analysis |
| Computational Prediction | 66.7% [1] | 66.4% [1] | Large-scale in silico prediction [1] | N/A | Pre-screening, hypothesis generation |
| Gel-Based Methods | Variable, often insufficient [20] | High when detected | Limited by sensitivity [20] | Large amounts required [20] | High-abundance substrates |
For specific substrates including HER2, DVL2, and TCRα, K-GG peptide immunoaffinity enrichment consistently revealed additional ubiquitination sites beyond those identified through protein-level AP-MS experiments [20]. This enhanced detection capability provides more comprehensive ubiquitination mapping for individual proteins of interest. The method has proven particularly valuable for characterizing inducible ubiquitination events, such as those affecting multiple members of the T-cell receptor complex under endoplasmic reticulum stress conditions [20].
Technical Advantages and Methodological Limitations
K-GG immunoaffinity enrichment offers several distinct advantages over alternative approaches. The method enables direct identification of modification sites rather than inferring them through mutagenesis, overcoming challenges associated with functional redundancy when preferred lysine sites are mutated [20]. Additionally, the technique requires less starting material than conventional AP-MS approaches—successfully identifying sites from just 1 mg of input material compared to 10 mg typically used for immunoprecipitation-based methods [20].
However, the method does present certain limitations. The requirement for specific high-quality antibodies represents a potential constraint, and the technique may still miss low-abundance ubiquitination events despite its enhanced sensitivity. Furthermore, like other antibody-based methods, it may exhibit sequence context biases where certain K-GG peptide motifs are enriched more efficiently than others. These limitations highlight why multiple complementary approaches continue to be valuable in ubiquitination research.
Table 2: Methodological Characteristics Across Ubiquitination Detection Approaches
| Characteristic | K-GG Peptide Enrichment | Protein-Level AP-MS | Gel-Based Methods | Computational Prediction |
|---|---|---|---|---|
| Site Resolution | Direct identification of modified lysines [20] | Indirect, requires additional MS | Direct identification after gel separation [20] | In silico prediction only [1] |
| Sensitivity | High (4× more than AP-MS) [20] | Moderate | Variable, often limited [20] | Not applicable |
| Throughput | High for global profiling [20] | Lower, target-specific | Low | Very high [1] |
| Resource Requirements | Specialized antibodies, MS instrumentation | Specific antibodies, MS | Standard protein lab equipment | Computational resources |
| Typical Applications | Ubiquitinome profiling, focused site mapping [20] | Specific protein complexes | High-abundance substrates | Pre-screening, large-scale analysis [1] |
Implementation Considerations and Research Applications
The Scientist's Toolkit: Essential Research Reagents
Successful implementation of K-GG enrichment requires specific reagents and optimization at each workflow stage. The following essential materials represent critical components for effective ubiquitination site detection.
Table 3: Essential Research Reagents for K-GG Enrichment Studies
| Reagent Category | Specific Examples | Function and Importance |
|---|---|---|
| Cell Lysis Buffers | RIPA buffer, Nonidet P-40 buffer [20] | Protein extraction while preserving ubiquitination states |
| Protease Inhibitors | EDTA-free protease inhibitor mixtures [20] | Prevent degradation of ubiquitinated proteins during preparation |
| Proteasomal Inhibitors | MG132 [20] | Stabilize ubiquitinated proteins by blocking degradation |
| Enrichment Antibodies | Anti-di-glycine remnant (K-GG) antibodies [20] | Specific isolation of ubiquitinated peptides from complex mixtures |
| Chromatography Media | Protein A/G agarose beads, anti-FLAG M2 beads [20] | Solid supports for immunoaffinity purification |
| Digestion Enzymes | Sequencing-grade trypsin [20] | Generates K-GG modified peptides from ubiquitinated proteins |
| Mass Spec Standards | SILAC-labeled lysates [20] | Enable quantitative comparisons across experimental conditions |
Practical Implementation and Data Analysis
Effective implementation of K-GG enrichment protocols requires attention to several practical considerations. Sample preparation should include proteasomal inhibitors like MG132 to stabilize ubiquitinated proteins, and lysis conditions must balance complete protein extraction with preservation of ubiquitination states [20]. For LC-MS/MS analysis, data-dependent acquisition methods efficiently select intense ions from MS1 for fragmentation, while data-independent acquisition approaches like those mentioned in SCASP-PTM protocols provide complementary coverage [23].
For database searching, algorithms must account for the +114.0429 Da mass shift on modified lysines and account for potential missed cleavages at these sites [20]. The multimodal deep architectures recently developed for computational prediction achieve approximately 66.4% accuracy and 0.221 MCC value, providing potential supplementary approaches to experimental methods [1]. When interpreting results, researchers should consider that K-GG enrichment may capture both conventional ubiquitination and other ubiquitin-like modifications that generate similar di-glycine remnants, necessitating careful validation of important findings through orthogonal methods.
K-GG peptide immunoaffinity enrichment represents a highly effective method for ubiquitination site mapping, offering superior sensitivity and comprehensive coverage compared to protein-level AP-MS and gel-based approaches. The method's ability to identify thousands of modification sites from minimal starting material has significantly advanced large-scale ubiquitinome profiling studies. While computational prediction methods continue to evolve, mass spectrometry-based detection with prior enrichment remains the gold standard for experimental validation of ubiquitination sites.
The selection of appropriate detection methodologies fundamentally influences the quality of data used for evaluating database search algorithms in ubiquitination research. As mass spectrometry technologies advance and enrichment protocols become more refined, the research community can expect increasingly comprehensive ubiquitination site atlases that will further illuminate this critical regulatory mechanism in health and disease.
Ubiquitination, the covalent attachment of a small regulatory protein to substrate proteins, represents a crucial post-translational modification that governs diverse cellular functions including protein degradation, DNA repair, and signal transduction [24] [25]. Traditional experimental methods for ubiquitination site identification—including mass spectrometry (MS), immunoprecipitation (IP), and proximity ligation assay (PLA)—have provided valuable insights but remain costly, time-consuming, and technically challenging [25] [10]. The limitations are particularly evident in detecting low-stoichiometry modifications and characterizing ubiquitin chain architecture, creating a critical need for computational approaches that can complement experimental methods [26] [25].
The evolution of computational prediction tools has progressed through distinct phases: from early feature-based machine learning models to contemporary deep learning frameworks that leverage representation learning and ensemble strategies. This guide provides a systematic comparison of current ubiquitination site prediction tools, evaluating their methodologies, performance metrics, and practical applications for researchers in proteomics and drug development.
Traditional Experimental Methods: Foundations and Limitations
Conventional approaches for ubiquitination characterization rely on biochemical techniques with inherent constraints. Immunoblotting using anti-ubiquitin antibodies (e.g., P4D1, FK1/FK2) enables detection of ubiquitinated substrates but offers low throughput and limited site-specific resolution [25]. MS-based proteomics has emerged as the dominant experimental method, though it requires sophisticated enrichment strategies to overcome sensitivity challenges posed by low ubiquitination stoichiometry [26] [25].
Key enrichment methodologies include:
- Ubiquitin tagging-based approaches: Expression of epitope-tagged ubiquitin (e.g., His, Strep, FLAG) enables affinity purification of ubiquitinated proteins, though this may introduce artifacts from tag interference [25].
- Antibody-based enrichment: Linkage-specific antibodies (e.g., recognizing K48 or K63 chains) allow isolation of particular ubiquitin chain types, but suffer from high cost and potential non-specific binding [25].
- Ubiquitin-binding domain (UBD) tools: Tandem-repeated ubiquitin-binding entities (TUBEs) with enhanced affinity permit enrichment of endogenous ubiquitination without genetic manipulation [25].
Recent quantitative studies reveal that ubiquitination site occupancy spans over four orders of magnitude, with median occupancy approximately three orders of magnitude lower than phosphorylation, explaining why enrichment remains essential for detection [26]. These experimental methods generate the ground-truth data essential for training and validating computational predictors while establishing the performance benchmarks that computational approaches must exceed.
Computational Prediction Approaches: Methodological Evolution
The progression of computational tools for ubiquitination site prediction mirrors broader trends in bioinformatics, transitioning from feature-engineered machine learning to representation learning with deep neural networks.
Traditional Machine Learning Foundations
Early prediction systems relied on manually curated features and conventional classifiers:
- UbiPred: Utilized support vector machines (SVM) with 31 selected physicochemical properties of amino acids [24].
- CKSAAP_UbSite: Implemented SVM with k-spaced amino acid pairs composition [24].
- hCKSAAP_UbSite: Expanded feature space to include protein aggregation tendencies alongside sequence features [24].
These models demonstrated the feasibility of computational prediction but exhibited limited generalizability across species and conditions.
Deep Learning Revolution
Contemporary tools leverage diverse deep learning architectures:
- Ubigo-X: Employs an ensemble approach with three sub-models: Single-Type sequence-based features, k-mer sequence-based features, and structure-based/function-based features. The framework transforms sequence features into image-like representations processed through ResNet34 and combines predictions via weighted voting [24] [27].
- EUP: Leverages the ESM2 protein language model to extract lysine site-dependent features, applies conditional variational autoencoders for dimensionality reduction, and builds downstream predictors on the latent representations for cross-species prediction [28].
- DeepMVP: Incorporates convolutional neural networks (CNNs) and bidirectional gated recurrent units (GRUs) optimized via genetic algorithm, trained on PTMAtlas—a curated compendium of 397,524 PTM sites from systematic reanalysis of 241 public mass spectrometry datasets [29].
- MMUbiPred: Unifies multiple sequence representations including embedding, one-hot, and physicochemical encodings within a single deep learning framework [30].
The table below summarizes the key methodological characteristics of these tools:
Table 1: Methodological Comparison of Ubiquitination Site Prediction Tools
| Tool | Core Algorithm | Feature Engineering | Architecture | Species Focus |
|---|---|---|---|---|
| Ubigo-X | Ensemble Learning | AAC, AAindex, one-hot, k-mer, structural features | ResNet34 + XGBoost + Weighted Voting | Species-neutral |
| EUP | Conditional Variational Autoencoder | ESM2 protein language model embeddings | cVAE + Residual DNN | Multi-species (Animals, Plants, Microbes) |
| DeepMVP | CNN + Bidirectional GRU | Sequence-based features from PTMAtlas | Ensemble CNN-BiGRU | Human and viral proteomes |
| MMUbiPred | Deep Learning | Embedding, one-hot, physicochemical encodings | Unified Deep Network | General, Human-specific, Plant-specific |
Experimental Protocols and Training Methodologies
Understanding the experimental design behind tool development is crucial for appropriate application:
Ubigo-X Training Protocol:
- Data Source: 53,338 ubiquitination and 71,399 non-ubiquitination sites from PLMD 3.0 after CD-HIT filtering (<30% sequence identity) [24]
- Feature Extraction: Sequence-based (AAC, AAindex, one-hot, k-mer), structure-based (secondary structure, solvent accessibility), function-based (signal peptide cleavage sites) [24]
- Model Training: Three separate sub-models with image-transformed features for deep learning components [24]
- Validation: Independent testing on PhosphoSitePlus data (65,421 ubiquitination and 61,222 non-ubiquitination sites) [24]
EUP Development Workflow:
- Data Acquisition: 182,120 ubiquitination sites from CPLM 4.0 across multiple species [28]
- Feature Generation: ESM2 embeddings for lysine sites followed by conditional variational inference for latent space representation [28]
- Data Balancing: Random under-sampling combined with Neighborhood Cleaning Rule for denoising [28]
- Cross-species Validation: Separate evaluation on animals, plants, and microbes [28]
DeepMVP Data Curation:
- MS Data Reanalysis: Systematic reprocessing of 241 public PTM-enriched MS/MS datasets with strict FDR control (<1% at both PSM and site levels) [29]
- PTMAtlas Construction: 397,524 high-confidence PTM sites across six modification types, including 106,777 ubiquitination sites [29]
- Model Optimization: Genetic algorithm for architecture search with ensemble strategy for robustness [29]
Performance Comparison and Benchmarking
Rigorous evaluation across standardized metrics reveals the relative strengths of each approach:
Table 2: Performance Comparison of Ubiquitination Site Prediction Tools
| Tool | AUC | Accuracy | MCC | Testing Dataset | Key Advantage |
|---|---|---|---|---|---|
| Ubigo-X | 0.85 (balanced) 0.94 (imbalanced) | 0.79 (balanced) 0.85 (imbalanced) | 0.58 (balanced) 0.55 (imbalanced) | PhosphoSitePlus (65,421 ubiquitination sites) | Robust to class imbalance |
| EUP | >0.87 (cross-species) | N/R | N/R | Independent test set (1,191 sites) | Cross-species generalization |
| DeepMVP | Substantial improvement over existing tools | N/R | N/R | Literature-curated variants and cancer proteogenomic datasets | Multi-PTM prediction |
| MMUbiPred | 0.87 | N/R | N/R | Independent tests | Unified model for specific taxa |
N/R: Not explicitly reported in the available literature
Performance analysis indicates that ensemble strategies like Ubigo-X demonstrate particular robustness when handling naturally imbalanced data (1:8 positive-to-negative ratio), achieving AUC of 0.94 under such conditions [24]. EUP excels in cross-species prediction, identifying conserved and species-specific ubiquitination patterns across animals, plants, and microbes [28]. DeepMVP establishes new performance standards across six PTM types, benefiting from its high-quality training data from systematic MS reanalysis [29].
Research Reagent Solutions: Experimental and Computational Tools
Table 3: Essential Research Reagents and Resources for Ubiquitination Studies
| Resource | Type | Function | Example Applications |
|---|---|---|---|
| Linkage-specific Antibodies | Experimental Reagent | Enrichment of specific ubiquitin chain types (K48, K63, M1, etc.) | Immunoprecipitation, Western blotting [25] |
| TUBEs (Tandem-repeated Ub-binding Entities) | Experimental Reagent | High-affinity capture of endogenous ubiquitinated proteins | Proteomic analysis without genetic manipulation [25] |
| Epitope-tagged Ubiquitin | Experimental Reagent | Affinity purification of ubiquitinated substrates | His-, Strep-, or FLAG-tagged ubiquitin systems [25] |
| PTMAtlas | Computational Resource | Curated compendium of 397,524 PTM sites from MS reanalysis | Training high-performance predictors [29] |
| CPLM 4.0 / PLMD 3.0 | Data Repository | Experimentally verified ubiquitination sites | Benchmarking computational predictions [24] [28] |
| ESM2 Protein Language Model | Computational Resource | Pre-trained deep learning model for protein sequence representation | Feature extraction for ubiquitination site prediction [28] |
Integration Pathways: Experimental and Computational Workflows
The most powerful applications combine computational prediction with experimental validation through structured workflows:
Diagram 1: Integrated Ubiquitination Site Discovery Workflow
The evolution of ubiquitination site prediction has progressed from rudimentary feature-based classifiers to sophisticated deep learning systems that leverage protein language models and ensemble strategies. Contemporary tools like Ubigo-X, EUP, and DeepMVP demonstrate markedly improved performance across balanced and imbalanced datasets while offering cross-species prediction capabilities.
For researchers selecting appropriate tools, consideration should include:
- Species focus: EUP excels for cross-species applications, while DeepMVP provides exceptional performance on human proteomes
- Data characteristics: Ubigo-X shows particular robustness with imbalanced data distributions
- Interpretability needs: EUP identifies conserved features across evolutionary lineages
- Multi-PTM requirements: DeepMVP simultaneously predicts six modification types
Future development will likely focus on integrating structural predictions, enhancing interpretability, and improving performance on rare ubiquitin chain types. The continued synergy between experimental method development and computational innovation will further accelerate the mapping of the ubiquitin landscape and its therapeutic applications.
Algorithm Architectures and Implementation Strategies
Ubiquitination, the process by which a ubiquitin protein attaches to a lysine residue on a substrate protein, is a fundamental post-translational modification (PTM) with critical roles in cellular regulation, protein degradation, and disease pathogenesis [24] [31]. Experimental identification of ubiquitination sites is resource-intensive, driving the development of computational prediction tools [32] [10]. Among these, traditional machine learning (ML) models remain pivotal for their interpretability, efficiency, and robust performance. This guide objectively compares the performance of three dominant traditional ML algorithms—Random Forest (RF), Support Vector Machine (SVM), and eXtreme Gradient Boosting (XGBoost)—in predicting ubiquitination sites, providing researchers with actionable insights for their computational workflows.
Core Methodologies in Ubiquitination Site Prediction
The predictive accuracy of any ML model hinges on a structured experimental pipeline. The following workflow outlines the standard protocols used in benchmark studies for ubiquitination site prediction.
Data Sourcing and Preprocessing
Benchmark datasets are typically curated from public repositories such as PLMD, dbPTM, and CPLM [24] [28] [10]. A standard preprocessing protocol involves using CD-HIT to remove sequences with >30-40% similarity, reducing homology bias [24] [33]. Positive samples are short sequence fragments (e.g., windows of 27 or 41 amino acids) centered on experimentally verified ubiquitinated lysine residues. Negative samples comprise similar fragments centered on non-ubiquitinated lysines from the same protein sequences, often filtered to avoid high similarity with positive samples [24] [33].
Feature Extraction and Selection
Effective feature engineering is critical. Common feature extraction methods include:
- Sequence-based features: Binary Encoding (BE), Composition of k-spaced Amino Acid Pairs (CKSAAP), and Position Weight Matrix (PWM) [32] [33].
- Evolutionary information: Position-Specific Scoring Matrix (PSSM) [33].
- Physicochemical properties: Hundreds of amino acid indices (AAindex) or a curated set of 31 properties [32] [31]. To mitigate dimensionality and overfitting, feature selection methods like LASSO (Least Absolute Shrinkage and Selection Operator), mRMR (Minimum Redundancy - Maximum Relevance), and Null Importances are employed to identify the most informative feature subset [32] [33].
Model Training and Evaluation Metrics
Models are typically trained using k-fold cross-validation (e.g., 5-fold or 10-fold) to ensure robustness [34]. Performance is evaluated on independent test sets not used during training. Key metrics include:
- AUC (Area Under the ROC Curve): Measures overall ranking performance.
- Accuracy (ACC): Proportion of correct predictions.
- MCC (Matthews Correlation Coefficient): A balanced measure for imbalanced datasets.
- F1-Score: Harmonic mean of precision and recall.
Performance Comparison of RF, SVM, and XGBoost
The following table synthesizes quantitative performance data for RF, SVM, and XGBoost from recent benchmark studies.
Table 1: Comparative Performance of Traditional ML Classifiers for Ubiquitination Site Prediction
| Classifier | Species / Dataset | AUC | Accuracy | MCC | F1-Score | Key Features Used | Source |
|---|---|---|---|---|---|---|---|
| Random Forest (RF) | Homo sapiens | 0.950 | - | 0.781 | - | BE, CKSAAP, EAAC, PWM, AA531, PSSM | [33] |
| Random Forest (RF) | Arabidopsis thaliana | 0.977 | - | 0.827 | - | BE, CKSAAP, EAAC, PWM, AA531, PSSM | [33] |
| XGBoost | Homo sapiens | - | 0.8198 | - | 0.902 | Hybrid (Sequence + Hand-crafted) | [10] |
| Support Vector Machine (SVM) | Multiple Datasets (Set1, Set2, Set3) | 0.9998, 0.8887, 0.8481 | 98.33%, 81.12%, 76.90% | - | - | BE, PseAAC, CKSAAP, PSPM (with LASSO) | [32] |
| SVM | Arabidopsis thaliana | 0.868 | 81.56% | - | - | AAC, CKSAAP | [10] |
Analysis of Comparative Performance
Random Forest (RF) demonstrates top-tier performance, particularly in conjunction with comprehensive feature fusion and selection. The UbNiRF model, which combines RF with the Null Importances feature selection method, achieved exceptionally high MCC scores (0.827 for A. thaliana, 0.781 for H. sapiens), indicating superior balance between sensitivity and specificity on imbalanced data [33]. RF's ensemble nature, which aggregates many decision trees, makes it robust against overfitting and effective at capturing complex feature interactions.
Support Vector Machine (SVM) is a well-established performer in ubiquitination prediction. The UbiSitePred model, which used LASSO for feature selection before SVM classification, reported near-perfect AUC (0.9998) and accuracy (98.33%) on one dataset, showcasing its potential with optimized feature sets [32]. SVM excels in high-dimensional spaces and is particularly effective when a clear margin of separation exists in the data. Its performance can be highly dependent on the kernel choice and feature preprocessing.
eXtreme Gradient Boosting (XGBoost) represents the gradient boosting approach, which builds trees sequentially to correct errors from previous ones. In a broad comparison of ten ML methods for human ubiquitination sites, a hybrid deep learning model utilizing XGBoost-related frameworks achieved an F1-score of 0.902 and an accuracy of 81.98%, highlighting the strength of gradient-boosting-derived architectures [10]. XGBoost is known for its speed, scalability, and high performance, especially on structured data.
Table 2: Key Resources for Ubiquitination Site Prediction Research
| Resource Name | Type | Primary Function in Research | Example/Reference |
|---|---|---|---|
| PLMD / CPLM / dbPTM | Data Repository | Source of experimentally verified ubiquitination sites for model training and testing. | [24] [28] [10] |
| CD-HIT & CD-HIT-2D | Bioinformatics Tool | Reduces sequence redundancy in datasets to prevent model overfitting. | [24] [33] |
| Amino Acid Indices (AAindex) | Feature Database | Provides numerical representations of physicochemical properties for feature extraction. | [24] [31] |
| Position-Specific Scoring Matrix (PSSM) | Evolutionary Feature | Encodes evolutionary conservation information from multiple sequence alignments. | [33] |
| LASSO / mRMR / Null Importances | Feature Selection Algorithm | Identifies optimal, non-redundant feature subsets to improve model performance and interpretability. | [32] [35] [33] |
| SMOTE | Data Sampling Technique | Addresses class imbalance by generating synthetic samples of the minority class (ubiquitinated sites). | [33] |
The evaluation of traditional machine learning approaches reveals a nuanced performance landscape for ubiquitination site prediction. Random Forest consistently achieves high MCC and AUC, establishing it as a robust and reliable choice, particularly when combined with advanced feature selection. Support Vector Machine remains a powerful and often top-performing model, especially with careful feature engineering, as demonstrated by UbiSitePred. XGBoost and related gradient boosting methods show excellent accuracy and F1-scores, making them strong contenders in the ML toolkit. The choice of algorithm is interdependent with feature engineering and data preprocessing strategies. For researchers, this comparative data supports RF and SVM as proven, high-performance solutions for building ubiquitination site predictors, with the selection often boiling down to the specific dataset characteristics and the desired balance between different performance metrics.
Ubiquitination is a crucial post-translational modification (PTM) that regulates diverse cellular functions, including protein degradation, signal transduction, DNA repair, and cell cycle progression [36] [31]. Accurate identification of ubiquitination sites is essential for understanding disease mechanisms and developing therapeutic strategies. While traditional experimental methods for ubiquitination site detection are expensive and time-consuming, deep learning architectures have emerged as powerful computational alternatives, offering unprecedented accuracy and efficiency [24] [10]. This review provides a comprehensive comparison of convolutional neural networks (CNNs), ResNet architectures, and hybrid models for ubiquitination site prediction, evaluating their performance, methodologies, and applicability to different research scenarios.
Core Architectural Components in Ubiquitination Prediction
Convolutional Neural Networks (CNNs) represent a foundational architecture that applies convolutional filters to extract local sequence patterns from protein data. These models excel at identifying position-invariant features in amino acid sequences through their hierarchical structure of convolutional and pooling layers [10]. For ubiquitination site prediction, CNNs typically process sequence embeddings such as one-hot encoding or physicochemical properties to identify motifs around lysine residues.
ResNet (Residual Networks) introduce skip connections that enable the training of substantially deeper networks by mitigating the vanishing gradient problem. In ubiquitination prediction, ResNet architectures allow for more complex feature hierarchies while maintaining training stability [37] [31]. The residual blocks typically incorporate multi-kernel convolutions to capture features at different scales simultaneously, significantly enhancing pattern recognition capabilities.
Hybrid Models combine architectural components from multiple deep learning approaches to leverage their complementary strengths. Common hybridizations include CNN-Bidirectional GRU for spatiotemporal feature extraction [38], CNN-Transformer for integrating local and global sequence contexts [31], and ensemble methods that fuse predictions from multiple specialized sub-models [24]. These architectures demonstrate superior performance by capturing both short-range motifs and long-range dependencies in protein sequences.
Quantitative Performance Comparison
Table 1: Performance comparison of deep learning architectures for ubiquitination site prediction
| Architecture | Model Name | Accuracy | Precision | Recall | AUC | MCC |
|---|---|---|---|---|---|---|
| CNN-Based | DeepUbi [10] | - | - | - | 0.99 | - |
| ResNet-Based | ResUbiNet [36] [31] | 0.819 | 0.879 | 0.915 | 0.902 | - |
| Hybrid | Ubigo-X (Balanced) [24] | 0.79 | - | - | 0.85 | 0.58 |
| Hybrid | Ubigo-X (Imbalanced) [24] | 0.85 | - | - | 0.94 | 0.55 |
| Hybrid | CNN-LSTM (Plants) [39] | 0.81 | - | - | - | - |
Table 2: Architectural components and their functional benefits in ubiquitination prediction
| Component | Function | Advantage |
|---|---|---|
| Multi-Head Attention [31] | Captures long-range dependencies in sequences | Identifies relationships between distant residues |
| Multi-Kernel Convolution [31] | Parallel convolutions with different receptive fields | Extracts motifs of varying lengths simultaneously |
| Squeeze-and-Excitation [31] | Recalibrates channel-wise feature responses | Enhances important features, suppresses less useful ones |
| Residual Connections [37] [31] | Creates skip connections between layers | Enables training of very deep networks |
| Weighted Voting Ensemble [24] | Combines predictions from multiple sub-models | Improves robustness and generalization |
Experimental Protocols and Methodologies
Benchmark Datasets and Preprocessing Standards
High-quality datasets form the foundation for training effective ubiquitination prediction models. The most widely adopted benchmark datasets include experimentally verified ubiquitination sites from UniProt, dbPTM, and PLMD 3.0 [31] [10]. Standard preprocessing involves extracting sequence fragments with the ubiquitinated lysine residue at the center, typically using window sizes of 25-31 amino acids [39] [31]. To ensure model generalization, researchers apply redundancy reduction techniques such as CD-HIT with 30% sequence identity threshold and use CD-HIT-2d to remove negative samples with high similarity to positive samples [24].
Data imbalance presents a significant challenge in ubiquitination prediction, as non-ubiquitinated sites vastly outnumber ubiquitinated sites. Advanced approaches address this through hybrid resampling techniques combining adaptive random undersampling with GAN-based oversampling [38]. Studies have demonstrated that proper handling of class imbalance significantly improves model performance, with Ubigo-X achieving 0.94 AUC on imbalanced test data compared to 0.85 AUC on balanced data [24].
Sequence Representation and Feature Encoding
Effective feature representation is critical for model performance. Modern architectures employ multiple encoding strategies:
Evolutionary features include BLOSUM62 matrices that capture substitution patterns and position-specific scoring matrices (PSSM) derived from multiple sequence alignments [31]. These features provide information about evolutionary constraints on specific sequence positions.
Physicochemical properties from databases like AAindex incorporate biochemical characteristics of amino acids, including hydrophobicity, charge, and structural properties [31]. ResUbiNet utilizes 31 carefully selected AAindex properties that have proven informative for ubiquitination prediction [31].
Embedding-based features represent a paradigm shift in sequence representation. Protein language models like ProtTrans generate context-aware embeddings by pre-training on millions of protein sequences [31]. These embeddings capture complex semantic relationships between amino acids and have demonstrated superior performance compared to traditional encoding schemes.
Innovative representations include the transformation of sequence features into image-like formats, enabling the application of advanced computer vision architectures. Ubigo-X converts AAC, AAindex, and one-hot encodings into 2D representations processed by ResNet34 [24].
Architectural Implementation Details
ResUbiNet exemplifies a modern integrated architecture, processing three parallel input streams: ProtTrans embeddings, AAindex properties, and BLOSUM62 matrices [31]. The model incorporates transformer blocks with multi-head attention to capture long-range dependencies, followed by residual blocks with multi-kernel convolutions to extract features at multiple scales. Squeeze-and-excitation blocks dynamically recalibrate feature importance, and residual connections enable stable training of deep networks [31].
Ubigo-X employs an ensemble strategy with three specialized sub-models: Single-Type sequence-based features (SBF), k-mer sequence-based features (Co-Type SBF), and structure-based and function-based features (S-FBF) [24]. The model combines predictions through weighted voting, with image-transformed sequence features processed by ResNet34 and structural features processed by XGBoost.
CNN-GRU Hybrids for IIoT security applications demonstrate architectural patterns applicable to ubiquitination prediction, featuring convolutional layers for local pattern extraction followed by gated recurrent units (GRUs) for capturing temporal dependencies in sequential data [38]. These architectures have proven particularly effective for handling sequential network traffic data with inherent temporal patterns.
Diagram 1: Architectural comparison of CNN, ResNet, and Hybrid models for ubiquitination site prediction
Research Reagent Solutions and Computational Tools
Table 3: Essential research reagents and computational tools for ubiquitination site prediction
| Tool/Resource | Type | Function | Access |
|---|---|---|---|
| PTMAtlas [29] | Database | Curated compendium of 397,524 PTM sites from systematic MS reprocessing | Publicly available |
| DeepMVP [29] | Software | Deep learning framework for predicting 6 major PTM types including ubiquitination | http://deepmvp.ptmax.org |
| ProtTrans [31] | Embedding | Protein language model generating context-aware sequence representations | Publicly available |
| Ubigo-X [24] | Web Tool | Species-neutral ubiquitination predictor with image-based feature representation | http://merlin.nchu.edu.tw/ubigox/ |
| CD-HIT [24] | Software | Sequence clustering to reduce redundancy in training datasets | Publicly available |
| ResUbiNet [36] [31] | Model | Integrated architecture with ProtTrans, transformer, and residual components | Code not specified |
Diagram 2: Experimental workflow for developing deep learning models in ubiquitination site prediction
The comparative analysis of deep learning architectures for ubiquitination site prediction reveals distinct advantages for different research scenarios. CNN-based models provide a solid foundation for initial investigations, offering interpretable feature learning with relatively low computational requirements. ResNet architectures excel in scenarios requiring deep feature hierarchies and demonstrate superior performance in capturing complex ubiquitination patterns. Hybrid models represent the state-of-the-art, achieving the highest performance metrics by leveraging complementary architectural components and ensemble strategies.
For researchers selecting appropriate architectures, we recommend CNN-based approaches for preliminary studies with limited data or computational resources. ResNet architectures are ideal for detailed investigations requiring high accuracy on complex datasets. Hybrid models should be employed for production-grade prediction tools where maximum performance is essential. Future directions include developing unified frameworks for multiple PTM predictions, incorporating protein structural information, and creating more interpretable models that provide biological insights beyond prediction accuracy.
The integration of these deep learning approaches with experimental validation will accelerate our understanding of ubiquitination mechanisms and facilitate the development of targeted therapies for ubiquitination-related diseases.
The effective identification of ubiquitination sites is a critical step in deciphering the molecular mechanisms of protein regulation and their roles in diseases such as cancer and neurological disorders. While experimental methods like mass spectrometry exist, they are often time-consuming, expensive, and labor-intensive [40] [41]. Computational prediction methods have emerged as indispensable alternatives, with feature engineering representing the fundamental component that determines their success. This guide provides a systematic comparison of feature engineering strategies—sequence-based, structural, and physicochemical properties—for ubiquitination site prediction, offering researchers a framework for selecting and implementing these approaches within their ubiquitination research workflows.
Comparative Analysis of Feature Engineering Strategies
The table below summarizes the core characteristics, advantages, and limitations of the three primary feature engineering strategies used in ubiquitination site prediction.
Table 1: Comparison of Feature Engineering Strategies for Ubiquitination Site Prediction
| Strategy | Key Features | Representative Tools | Performance Highlights | Advantages | Limitations |
|---|---|---|---|---|---|
| Physicochemical Properties (PCPs) | Hydrophobicity, polarity, charge, and other biochemical attributes of amino acids [40]. | UbiPred [40] [24], ESA-UbiSite [24] | UbiPred: 84.44% accuracy (LOOCV) using 31 informative PCPs [40]. | High interpretability; captures direct biochemical context; effective even with smaller datasets [40] [41]. | Requires feature selection to avoid redundancy from 500+ properties [40] [42]. |
| Sequence-Based Features | Amino acid composition (AAC), k-spaced amino acid pairs (CKSAAP), pseudo amino acid composition (PseAAC) [24]. | CKSAAP_UbSite [24], Ubigo-X [24] | Ubigo-X (ensemble): AUC 0.85 on balanced test data [24]. | Simple to compute; does not require structural data; effective for deep learning models [24]. | Lacks 3D structural context; may miss structural determinants of ubiquitination. |
| Structural & Evolutionary Information | Secondary structure, solvent accessibility, evolutionary conservation from PSSM [43] [44]. | SSUbi [43] [44], TransDSI [45] | SSUbi: Enhanced accuracy for species with small sample sizes [43] [44]. TransDSI: AUROC 0.83 for DUB-substrate interaction prediction [45]. | Captures crucial spatial and evolutionary constraints; improves model generalizability [43] [45]. | Structural data not always available; computationally intensive to generate [43] [44]. |
Detailed Methodologies and Experimental Protocols
Protocol 1: Informative Physicochemical Property Mining
The UbiPred protocol exemplifies a rigorous approach to selecting the most informative PCPs from a large pool of candidates [40].
- Data Preparation: Construct a benchmark dataset of protein sequences containing confirmed ubiquitylation sites (positive samples) and non-ubiquitylation sites (negative samples) from databases like UbiProt.
- Feature Extraction: For each lysine residue and its surrounding sequence window, calculate values for all 531 physicochemical properties from the AAindex database. The value for a property across the window is typically the average of that property's values for all amino acids in the window [41].
- Feature Selection: Implement an algorithm like the Informative Physicochemical Property Mining Algorithm (IPMA). This method uses a bi-objective genetic algorithm to select a subset of properties that maximizes the prediction accuracy of a classifier (e.g., SVM) via cross-validation [40].
- Model Training and Validation: Train a Support Vector Machine (SVM) classifier using the selected subset of PCPs. Validate the model using rigorous methods like Leave-One-Out Cross-Validation (LOOCV) and evaluate performance with metrics such as accuracy and Area Under the ROC Curve (AUC) [40]. The study achieved 72.19% accuracy using all 531 properties, which was improved to 84.44% after selecting an informative subset of 31 properties [40].
Protocol 2: Integrating Sequence and Structural Information
The SSUbi model demonstrates a modern deep-learning approach that integrates multiple data types for species-specific prediction [43] [44].
- Data Curation and Species-Specific Partitioning: Collect ubiquitination site data from resources like the Protein Lysine Modification Database (PLMD). Partition the data into species-specific sets (e.g., Homo sapiens, Mus musculus) to train dedicated models [44].
- Multi-Dimensional Feature Extraction:
- Sequence Feature Extraction: Encode sequences using methods like one-hot encoding or k-mer composition [24].
- Structural Feature Prediction: Use tools like NetSurfP-3.0 to predict secondary structure features (helix, strand, coil) and solvent accessibility (RSA/ASA) for each amino acid in the sequence [44].
- Feature Integration and Model Training: Develop a deep learning architecture with separate sub-modules for sequence and structural features. SSUbi uses convolutional operations and a channel attention mechanism to extract multi-dimensional features from both data types. These features are then integrated and fed into a capsule network for final classification [43] [44].
- Performance Evaluation: Evaluate the model on held-out test sets for each species, reporting metrics like AUC, accuracy, and MCC. Compare its performance against general prediction models to demonstrate the advantage of the species-specific, structure-integrated approach [44].
Protocol 3: Deep Transfer Learning for Interaction Prediction
The TransDSI framework addresses the challenge of predicting Deubiquitinase-Substrate Interactions (DSIs) with limited training data [45].
- Network Construction: Represent the human proteome as a Sequence Similarity Network (SSN), where proteins are nodes and edges represent significant sequence similarity based on BLAST scores [45].
- Self-Supervised Pre-training: Pre-train a Graph Convolutional Network (GCN) encoder on the SSN using a Variational Graph Autoencoder (VGAE) framework. This step allows the model to learn rich, general-purpose protein representations without using labeled DSI data [45].
- Model Fine-tuning: Transfer the pre-trained GCN encoder to the specific task of DSI prediction. The model is fine-tuned on a limited set of known DUB-substrate pairs. The embeddings of a DUB and a substrate are concatenated and processed by a multilayer perceptron (MLP) to predict the probability of interaction [45].
- Interpretation and Validation: Use an explainable AI module (e.g., PairExplainer) to identify critical regions in the protein sequences that contribute most to the prediction. Experimentally validate high-confidence predictions, such as interactions between USP11/USP20 and FOXP3, using wet-lab methods [45].
The following diagram illustrates the logical workflow of the TransDSI framework:
Table 2: Key Research Reagents and Computational Tools
| Resource Name | Type | Primary Function in Research | Relevant Context |
|---|---|---|---|
| AAindex Database [40] [24] | Database | A comprehensive repository of 531+ physicochemical and biochemical properties of amino acids and pairs. | Foundational resource for feature extraction in PCP-based methods like UbiPred. |
| PLMD (Protein Lysine Modification Database) [44] [24] | Database | A curated database of protein lysine modifications, including ubiquitination sites across multiple species. | Primary data source for training and testing species-specific models like SSUbi and Ubigo-X. |
| NetSurfP-3.0 [44] | Software Tool | Predicts protein secondary structure and solvent accessibility directly from amino acid sequences. | Used to generate structural features for models that integrate structural information, such as SSUbi. |
| PhosphoSitePlus [24] | Database | A richly annotated resource of post-translational modification sites, including ubiquitination. | Commonly used as an independent test set to validate the performance of new prediction tools. |
| CD-HIT [24] | Software Tool | A tool for clustering biological sequences to reduce redundancy in datasets. | Critical for pre-processing training data to avoid overfitting and create non-redundant benchmark datasets. |
The evolution of feature engineering for ubiquitination site prediction demonstrates a clear trajectory from reliance on single data types to the sophisticated integration of multiple features. Initial strategies based on physicochemical properties proved powerful and interpretable, while contemporary methods leverage deep learning to combine sequence, evolutionary, and predicted structural information, significantly boosting predictive power, especially for species-specific tasks and complex interaction predictions. As the field progresses, the effective integration of these diverse feature engineering strategies will continue to be paramount in unlocking a deeper, systems-level understanding of the ubiquitin code.
Protein ubiquitination, a fundamental post-translational modification (PTM), regulates virtually all cellular processes including cell cycle progression, apoptosis, transcription regulation, and DNA damage repair [46] [47]. The ubiquitin-proteasome system (UPS) mediates approximately 80%-85% of protein degradation in eukaryotic organisms, and its dysregulation can lead to loss of cell cycle control and ultimately carcinogenesis [46] [47]. Mass spectrometry (MS)-based ubiquitinomics has emerged as a powerful technology for system-level understanding of ubiquitin signaling by enabling global profiling of ubiquitination events through immunoaffinity purification and MS-based detection of diglycine-modified peptides (K-ε-GG) generated by tryptic digestion of ubiquitin-modified proteins [46] [47] [48].
The acquisition methodology employed in LC-MS/MS experiments significantly impacts the depth, accuracy, and reproducibility of ubiquitinome analyses. Currently, two main data acquisition strategies dominate proteomics: Data-Dependent Acquisition (DDA) and Data-Independent Acquisition (DIA). This review provides a comprehensive comparison of these approaches specifically for ubiquitinome profiling, focusing on their technical principles, performance characteristics, and applications in drug discovery and basic research.
Technical Principles: DDA vs. DIA Acquisition Strategies
Data-Dependent Acquisition (DDA) Fundamentals
In conventional DDA, the mass spectrometer performs a survey scan (MS1) to identify all precursor peptide ions, then selects a predefined number of the most intense precursors ("top N") for isolation and fragmentation, with MS/MS spectra acquired sequentially for each selected peptide [49] [50]. This intensity-based precursor selection introduces inherent stochastic sampling, where low-abundance precursors may be consistently overlooked in complex mixtures. In DDA, quantification primarily relies on extracted ion chromatograms (XICs) built from MS1 spectra, while MS2 spectra are used predominantly for identification [51] [50]. The stochastic nature of precursor selection often results in significant missing values across sample series, complicating statistical analysis in large-scale experiments [49] [52].
Data-Independent Acquisition (DIA) Fundamentals
DIA, also known as Sequential Window Acquisition of All Theoretical Mass Spectra (SWATH-MS), operates on a fundamentally different principle. Instead of selecting individual precursors, DIA cycles through predefined, consecutive isolation windows that cover the entire m/z range of interest (e.g., 400-1200 m/z), fragmenting all precursors within each window simultaneously [49] [53] [50]. This approach eliminates the stochastic precursor selection of DDA, ensuring that all eluting peptides are systematically fragmented and recorded regardless of intensity [49]. The resulting MS2 spectra are highly multiplexed, containing fragment ions from all co-eluting peptides within each isolation window [52]. Deconvolution of these complex spectra requires specialized computational approaches, typically using spectral libraries for peptide identification and quantification [49] [53].
Table 1: Fundamental Characteristics of DDA and DIA Acquisition Methods
| Feature | Data-Dependent Acquisition (DDA) | Data-Independent Acquisition (DIA) |
|---|---|---|
| Precursor Selection | Intensity-based ("top N") | Systematic, all precursors in predefined windows |
| Fragmentation | Sequential for selected precursors | Parallel for all precursors in isolation window |
| Quantification Basis | Primarily MS1 extracted ion chromatograms | Both MS1 and MS2 extracted ion chromatograms |
| Data Complexity | Discrete MS2 spectra | Highly multiplexed MS2 spectra |
| Stochastic Effects | High (missing values across runs) | Low (consistent data acquisition) |
| Data Analysis | Direct database search | Spectral library-based or direct analysis |
Figure 1: Fundamental Workflow Differences Between DDA and DIA Acquisition Methods
Performance Comparison for Ubiquitinome Analysis
Identification Depth and Quantitative Performance
Recent methodological advances have demonstrated the superior performance of DIA for ubiquitinome profiling. Steger et al. (2021) developed a scalable workflow combining improved sample preparation with DIA-MS and neural network-based data processing specifically optimized for ubiquitinomics [46]. Compared to DDA, their method more than tripled identification numbers to approximately 70,000 ubiquitinated peptides in single MS runs while significantly improving robustness and quantification precision [46]. Similarly, Hansen et al. (2021) devised a sensitive DIA-based ubiquitinome workflow that identified 35,000 distinct diGly peptides in single measurements of proteasome inhibitor-treated cells—nearly double the number and quantitative accuracy achieved with DDA [48].
The reproducibility of DIA significantly outperforms DDA in ubiquitinome applications. Hansen et al. reported that in replicate analyses, 45% of diGly peptides identified by DIA had coefficients of variation (CVs) below 20%, compared to only 15% with DDA [48]. Furthermore, the six DIA experiments yielded almost 48,000 distinct diGly peptides, while corresponding DDA experiments resulted in only 24,000 diGly peptides [48]. This enhanced reproducibility stems from DIA's comprehensive acquisition scheme, which minimizes missing values across sample series—a well-documented challenge in DDA-based analyses [49] [52].
Table 2: Performance Comparison of DDA vs. DIA for Ubiquitinome Profiling
| Performance Metric | Data-Dependent Acquisition (DDA) | Data-Independent Acquisition (DIA) | Improvement Factor |
|---|---|---|---|
| Typical Ubiquitinated Peptide IDs (Single Run) | 20,000-21,434 [46] [48] | 35,000-68,429 [46] [48] | 1.7x to 3.2x |
| Reproducibility (CV < 20%) | 15% of peptides [48] | 45% of peptides [48] | 3x improvement |
| Missing Values | Up to 51% across samples [49] | As low as 1.6% across samples [49] | ~30x reduction |
| Quantitative Dynamic Range | Limited by stochastic sampling | 4-5 orders of magnitude [49] | Significant expansion |
| Required Protein Input | Higher (typically >2mg) [46] | Lower (can work with 500μg) [46] | ~4x reduction |
Analytical Sensitivity and Dynamic Range
DIA methods provide significant advantages in detecting low-abundance ubiquitinated peptides due to the elimination of stochastic precursor selection. The even sampling across the m/z range ensures consistent detection of low-intensity precursors that might be overlooked in DDA analyses [49] [50]. This is particularly important for ubiquitinome studies where modification stoichiometries are often low, and critical regulatory ubiquitination events may occur on low-abundance proteins.
The dynamic range of DIA quantification spans 4-5 orders of magnitude, significantly expanding the detectable range of ubiquitination events compared to conventional DDA [49]. Furthermore, DIA enables combined use of both MS1 and MS2 quantitative information, providing orthogonal verification of peptide abundance. Recent research demonstrates that statistical procedures incorporating both MS1 and MS2 signals improve the detection of differentially abundant proteins, particularly for comparisons with low fold changes and limited replicates [51].
Experimental Design and Methodological Considerations
Sample Preparation and Enrichment Protocols
Robust ubiquitinome profiling requires specialized sample preparation to address the low stoichiometry of ubiquitination. Key improvements include:
Lysis Buffer Optimization: Steger et al. developed a sodium deoxycholate (SDC)-based lysis protocol supplemented with chloroacetamide (CAA) for rapid cysteine alkylation [46]. This approach yielded 38% more K-GG peptides than conventional urea buffer (26,756 vs. 19,403) without compromising enrichment specificity [46]. The immediate boiling of samples after lysis with high CAA concentrations rapidly inactivates cysteine ubiquitin proteases, improving ubiquitin site coverage [46].
diGly Peptide Enrichment: Immunoaffinity purification using antibodies targeting the diGly remnant motif is crucial for ubiquitinome depth. Hansen et al. optimized the antibody-to-peptide input ratio, determining that enrichment from 1 mg of peptide material using 31.25 μg of anti-diGly antibody provides optimal results [48]. For proteasome inhibitor-treated samples, separating fractions containing the highly abundant K48-linked ubiquitin-chain derived diGly peptide prevents competition for antibody binding sites and improves detection of co-eluting peptides [48].
Peptide Fractionation Strategies: Deep spectral library generation typically requires extensive fractionation. Hansen et al. separated peptides by basic reversed-phase chromatography into 96 fractions, concatenated into 8 fractions, with the K48-peptide pool processed separately [48]. This approach identified more than 67,000 and 53,000 diGly peptides in MG132-treated HEK293 and U2OS cell lines, respectively [48].
Mass Spectrometry Acquisition Parameters
DIA Method Optimization: Hansen et al. systematically optimized DIA parameters for ubiquitinome analysis, recognizing that impeded C-terminal cleavage of modified lysine residues frequently generates longer peptides with higher charge states [48]. Their optimized method used 46 precursor isolation windows with MS2 resolution of 30,000, improving diGly peptide identification by 13% compared to standard full proteome methods [48].
Spectral Library Generation: Comprehensive spectral libraries are critical for DIA data analysis. Both project-specific libraries (generated through fractionation of representative samples) and public reference libraries can be employed [49] [53]. Hybrid approaches that combine DDA-derived libraries with direct identification from DIA data further enhance coverage [48] [54]. Steger et al. demonstrated that DIA-NN processing in "library-free" mode (searching against a sequence database without an experimental spectral library) identified 68,429 K-GG peptides—triple the number obtained with DDA [46].
Figure 2: Optimized DIA-MS Workflow for Comprehensive Ubiquitinome Profiling
Computational Tools for DIA Data Analysis
The analysis of DIA ubiquitinome data requires specialized computational tools to deconvolute multiplexed MS2 spectra. Several software solutions have emerged with distinct approaches:
DIA-NN utilizes deep neural networks to significantly increase proteomic depth and quantitative accuracy for DIA data [46]. The software includes a specialized scoring module for confident identification of modified peptides, including K-GG peptides [46]. In benchmark analyses, DIA-NN identified approximately 40% more K-GG peptides than alternative processing software [46].
MSFragger-DIA implements a novel approach by conducting database searches of DIA MS/MS spectra prior to feature detection and peak tracing [54]. This fragment ion indexing-based strategy leverages the unmatched search speed of MSFragger, enabling direct peptide identification from DIA data that blurs the distinction between DIA and DDA analysis [54].
Spectronaut employs a peptide-centric approach with sophisticated interference correction for both MS1 and MS2 quantitative signals [51] [52]. The software fully implements MS1 and MS2 data for identification and quantification, providing robust performance across diverse sample types [51].
FragPipe provides an integrated computational platform that combines MSFragger-DIA for identification with DIA-NN for quantification, creating a seamless workflow from peptide identification to protein quantification [54]. This integrated approach has demonstrated superior performance in affinity proteomics applications, resulting in a larger number of proteins quantified without missing values and lower coefficients of variation for measured protein quantities [52].
Table 3: Computational Tools for DIA Ubiquitinome Data Analysis
| Software Tool | Analysis Approach | Key Features | Performance Characteristics |
|---|---|---|---|
| DIA-NN [46] [54] | Deep neural network-based | Library-free and library-based modes; specialized K-GG peptide scoring | 40% more K-GG peptide IDs than alternatives [46] |
| MSFragger-DIA [54] | Fragment ion indexing | Direct database search of DIA MS/MS spectra; extremely fast search times | Enhanced sensitivity for post-translational modifications |
| Spectronaut [51] [52] | Peptide-centric with interference correction | Combined MS1 and MS2 quantification; robust statistical analysis | Excellent quantitative precision (CV < 20%) |
| FragPipe [52] [54] | Integrated workflow platform | Combines MSFragger-DIA and DIA-NN; streamlined analysis | Reduced missing values and lower CV in affinity proteomics |
Applications in Biological Research and Drug Discovery
Mode-of-Action Studies for DUB Inhibitors
The enhanced performance of DIA ubiquitinome profiling enables rapid mode-of-action characterization for drugs targeting deubiquitinases (DUBs) and ubiquitin ligases. Steger et al. applied their DIA workflow to profile the response to USP7 inhibition, simultaneously recording ubiquitination changes and abundance changes for more than 8,000 proteins at high temporal resolution [46]. This comprehensive analysis revealed that while ubiquitination of hundreds of proteins increased within minutes of USP7 inhibition, only a small fraction underwent degradation, thereby dissecting the scope of USP7 action and distinguishing regulatory ubiquitination leading to protein degradation from non-degradative events [46].
Circadian Biology and Signaling Pathways
DIA-based ubiquitinome profiling has uncovered novel regulatory mechanisms in diverse biological processes. Hansen et al. applied their optimized workflow to investigate ubiquitination dynamics across the circadian cycle, discovering hundreds of cycling ubiquitination sites and dozens of cycling ubiquitin clusters within individual membrane protein receptors and transporters [48]. This systems-wide analysis highlighted new connections between metabolism and circadian regulation, demonstrating how comprehensive ubiquitinome profiling can reveal previously unrecognized regulatory mechanisms [48].
When applied to TNFα signaling, the DIA workflow comprehensively captured known ubiquitination sites while adding many novel ones, providing a more complete picture of this biologically important signaling pathway [48]. The method's enhanced sensitivity and reproducibility enabled detection of dynamic ubiquitination events that were previously obscured by technical variability in DDA-based approaches.
The Scientist's Toolkit: Essential Research Reagents and Materials
Table 4: Key Research Reagents for DIA-Based Ubiquitinome Profiling
| Reagent/Resource | Function | Application Notes |
|---|---|---|
| anti-diGly Antibody [48] | Immunoaffinity enrichment of ubiquitinated peptides | Optimal ratio: 31.25 μg antibody per 1 mg peptide input [48] |
| Sodium Deoxycholate (SDC) [46] | Lysis buffer surfactant for efficient protein extraction | Yields 38% more K-GG peptides vs. urea buffer [46] |
| Chloroacetamide (CAA) [46] | Cysteine alkylating agent | Preferred over iodoacetamide to avoid di-carbamidomethylation artifacts [46] |
| Proteasome Inhibitors (MG-132) [46] [48] | Enhances ubiquitinated peptide detection | Treatment increases K48-linked chain abundance; requires fraction adjustment [48] |
| Spectral Libraries [53] [48] | Reference for DIA data analysis | Project-specific (≈90,000 diGly peptides) or public repositories [48] |
| High-pH Reversed-Phase Fractions [48] | Peptide fractionation for deep library generation | 96 fractions concatenated to 8; K48-peptide pool separated [48] |
DIA-MS has emerged as the superior technology for comprehensive ubiquitinome profiling, offering significant advantages over conventional DDA approaches in identification depth, quantitative accuracy, and reproducibility. The method's ability to consistently quantify tens of thousands of ubiquitination sites across diverse sample sets enables researchers to address complex biological questions with unprecedented precision.
Future developments in DIA ubiquitinomics will likely focus on further enhancing sensitivity for limited sample amounts, expanding the dynamic range for detecting low-abundance modifications, and improving computational workflows for data analysis. Integration with other omics technologies and single-cell approaches will open new avenues for understanding ubiquitin signaling in complex biological systems and disease contexts. As the technology continues to mature, DIA-based ubiquitinome profiling is poised to become the gold standard for studying the ubiquitin-proteasome system in basic research and drug discovery applications.
In bottom-up mass spectrometry (MS)-based proteomics, the reliability and reproducibility of results fundamentally hinge on well-executed protein extraction and digestion protocols [55]. This is particularly critical in ubiquitination research, where the study of post-translational modifications (PTMs) adds layers of complexity to sample processing. The versatility of ubiquitination—ranging from single ubiquitin moieties attached to target proteins to complex chains containing ubiquitin-like proteins (Ubls) or chemical modifications—creates a complex "Ub code" that necessitates highly optimized sample preparation methodologies [56]. Experimental identification of ubiquitination sites remains challenging due to rapid turnover of ubiquitinated proteins and the large size of the ubiquitin modifier [3]. Furthermore, the dynamic range of ubiquitinated species and the lability of ubiquitin modifications demand specialized enrichment techniques and preservation strategies throughout sample processing. This guide systematically compares established and emerging methodologies for sample preparation, lysis protocols, and enrichment techniques, providing researchers with experimental data to inform their ubiquitination study designs.
Comparative Analysis of Sample Preparation Methodologies
Protein Extraction and Digestion Protocols
The initial steps of protein extraction and digestion establish the foundation for successful ubiquitination analysis. Systematic comparisons of established digestion methods reveal distinct performance characteristics.
Table 1: Comparison of Protein Digestion Methods for Proteomics
| Method | Key Principle | Performance Metrics | Advantages | Limitations |
|---|---|---|---|---|
| Filter-Assisted Sample Preparation (FASP) [55] | Detergent depletion, concentration, and washing on molecular weight cutoff membranes | Identified 80% of proteins with CV <25%; superior peptide/protein IDs | Efficient detergent removal; compatible with detergent-solubilized samples | Requires specialized filter units; multiple processing steps |
| In-Solution Digestion [55] | Direct enzymatic digestion in solution without solid support | Median inter-day CV of 10%; 72% of proteins with CV <25% | Simple execution; low cost; unbiased results | Potential incomplete digestion; detergent interference; requires desalting |
| In-Gel Digestion [55] | Separation by SDS-PAGE followed by in-gel proteolysis | Median inter-day CV of 8%; 78% of proteins with CV <25% | Cost-effective; efficient contaminant removal; sample fractionation | Does not eliminate need for desalting; potential for incomplete extraction |
| Single-Pot, Solid-Phase-Enhanced Sample Preparation (SP3) [57] | Paramagnetic bead-based protein capture and cleanup | Highest number of quantified proteins (e.g., 6,131 for HeLa cells); 84.6% peptides with no missed cleavages | High efficiency; rapid; compatible with detergents; scalable | Requires paramagnetic beads; optimization needed for sample types |
For bacterial proteomics, SDT lysis buffer (4% SDS, 100 mM DTT, 100 mM Tris-HCl) combined with boiling and ultrasonication (SDT-B-U/S) has demonstrated superior performance, identifying 16,560 peptides for E. coli and 10,575 peptides for S. aureus in data-dependent acquisition (DDA) mode, with the highest technical replicate correlation (R² = 0.92) in data-independent acquisition (DIA) analysis [58]. This method particularly enhanced extraction of membrane proteins and proteins within key molecular weight ranges (20-30 kDa for E. coli; 10-40 kDa for S. aureus) [58].
Lysis Buffer Systems and Their Applications
The choice of lysis buffer significantly impacts protein extraction efficiency and downstream compatibility.
Table 2: Comparison of Lysis Buffer Systems for Protein Extraction
| Lysis Buffer | Key Components | Optimal Sample Types | Performance Characteristics | Downstream Considerations |
|---|---|---|---|---|
| RIPA Buffer [55] | Multiple detergents (SDC, SDS, NP-40) | Tissue samples (e.g., liver) | More efficient protein extraction from tissues; enhanced proteome coverage | Requires detergent removal methods (FASP, SP3) |
| SDC-Based Buffer [55] | Sodium deoxycholate only | Cell lines (e.g., macrophages) | Effective for detergent-free lysis systems; compatible with various digestion methods | Easier removal than other detergents |
| SDS-Based Buffer [57] | 1-4% Sodium dodecyl sulfate | Difficult-to-lyse samples; membrane proteins | Strong solubilization power; effective for membrane proteins | Interferes with LC-MS; requires complete removal |
| GnHCl-Based Buffer [57] | Guanidinium hydrochloride | Broad applications (cells, plasma) | Strong chaotrope; doesn't interfere with LC-MS analysis; MS-compatible | May require buffer exchange for some applications |
For tissue proteomics, both manual lysis and lyophilization present similar proteome coverage and reproducibility, but extraction efficiency depends heavily on lysis buffer selection, with RIPA buffer demonstrating superior results [55]. In comparative studies, the SP3 protocol using either SDS or GnHCl-based buffers achieved the highest number of quantified proteins in both HeLa cells (6,131 ± 20 for SP3/SDS) and plasma samples, significantly outperforming in-solution digestion (ISD) with GnHCl (4,851 ± 44 proteins) [57].
Specialized Enrichment Techniques for Ubiquitination Studies
Affinity Enrichment and Chemical Biology Approaches
Studying the "Ub code" requires specialized enrichment techniques that can capture specific ubiquitin architectures while preserving labile ubiquitin modifications.
The affinity enrichment mass spectrometry (AE-MS) approach utilizes defined Ub variants as affinity matrices to enrich interacting proteins, which are subsequently identified by high-resolution MS/MS [56]. This approach has been pioneered using chemical biology tools such as:
- Genetic Code Expansion (GCE): Incorporates non-canonical amino acids (ncAAs) for site-specific incorporation of PTMs or non-hydrolyzable analogs into Ub using amber stop codon suppression [56].
- Click Chemistry (CuAAC): Enables generation of linkage-defined diubiquitin through copper(I)-catalyzed alkyne-azide cycloaddition, creating triazole linkages that resist hydrolysis while resembling native isopeptide bonds [56].
- Thiol Chemistry: Site-specifically functionalizes ubiquitin through cysteine modification, enabling incorporation of chemical moieties for subsequent conjugation [56].
These approaches have enabled the identification of 70 interactors for K27 chains, 44 for K29 chains, and 37 for K33 chains, revealing linkage-specific ubiquitin interactomes [56].
Tandem Ubiquitin-Binding Entities (TUBEs) for Linkage-Specific Analysis
Chain-specific Tandem Ubiquitin Binding Entities (TUBEs) with nanomolar affinities for polyubiquitin chains enable investigation of ubiquitination dynamics in high-throughput formats [59]. These specialized affinity matrices facilitate precise capture of chain-specific polyubiquitination events on native target proteins with high sensitivity.
Application of TUBE technology has demonstrated specific capture of endogenous RIPK2 ubiquitination: inflammatory agent L18-MDP stimulated K63 ubiquitination was captured using K63-TUBEs or pan-selective TUBEs but not K48-TUBEs, while PROTAC-mediated ubiquitination was captured using K48-TUBEs and pan-selective TUBEs but not K63-TUBEs [59]. This specificity enables researchers to differentiate context-dependent linkage-specific ubiquitination events in physiological conditions.
Serial Enrichment of Multiple PTMs
The SCASP-PTM (SDS-cyclodextrin-assisted sample preparation-post-translational modification) approach enables tandem enrichment of ubiquitinated, phosphorylated, and glycosylated peptides from a single sample in a serial manner without intermediate desalting [23]. This methodology:
- Allows comprehensive PTM profiling from limited sample material
- Eliminates need for separate processing for different PTM analyses
- Maintains compatibility with standard MS analysis after final cleanup
- Reduces sample-to-sample variability in multi-PTM studies
Integrated Workflows and Experimental Design
Optimized Multi-Omics Sample Preparation
For integrated molecular profiling, monophasic extraction using paramagnetic beads with shortened incubation time has proven to be the most reproducible, efficient, and cost-effective solution for in-house multi-omics workflows in HepG2 cells [60]. This approach enables simultaneous analysis of metabolites, lipids, and proteins from the same sample, minimizing confounding effects from biological variability and ensuring cross-layer consistency.
The monophasic method utilizes n-butanol:ACN (3:1, v:v) with unmodified silica beads (400 nm or 700 nm) for concurrent extraction of metabolites and lipids, coupled with on-bead protein aggregation and accelerated tryptic digestion (40 minutes to overnight) [60]. This integrated approach eliminates the need for separate processing for different omics layers and enhances correlation between molecular datasets.
Computational Prediction Tools for Ubiquitination Sites
To complement experimental approaches, computational prediction tools have been developed to identify potential ubiquitination sites from protein sequences:
- UbPred [3]: Random forest predictor with class-balanced accuracy of 72%, area under ROC curve at 80%. Based on sequence biases and structural preferences around known ubiquitination sites that indicate properties similar to intrinsically disordered protein regions.
- Ubigo-X [27]: Ensemble learning approach with image-based feature representation and weighted voting, achieving AUC of 0.85, accuracy of 0.79, and MCC of 0.58 on balanced independent test data.
- EUP [61]: ESM2-based ubiquitination site prediction using pretrained protein language models and conditional variational inference, enabling cross-species prediction with identification of conserved and species-specific patterns.
These tools are particularly valuable for prioritizing candidate sites for experimental validation and interpreting ubiquitination data from proteomic studies.
Ubiquitination Proteomics Workflow: This diagram outlines the key decision points in a typical ubiquitination proteomics workflow, from sample preparation through data acquisition.
The Scientist's Toolkit: Essential Research Reagents
Table 3: Key Research Reagent Solutions for Ubiquitination Studies
| Reagent/Category | Specific Examples | Function/Application | Considerations |
|---|---|---|---|
| Lysis Buffers | RIPA, SDC, SDS, GnHCl-based | Protein extraction and solubilization | Compatibility with downstream steps; efficient disruption |
| Digestion Kits | FASP kits, SP3 paramagnetic beads | Protein digestion and cleanup | Efficiency, reproducibility, throughput |
| Enrichment Tools | TUBEs (K48, K63, Pan-specific), Ubiquitin antibodies | Affinity capture of ubiquitinated proteins | Linkage specificity, affinity, application format |
| Chemical Biology Tools | Non-canonical amino acids, click chemistry reagents | Generation of defined Ub variants | Synthetic accessibility, structural fidelity |
| Protease Inhibitors | cOmplete protease inhibitor cocktail | Preservation of ubiquitin modifications | Broad-spectrum protection, MS compatibility |
| Computational Tools | UbPred, Ubigo-X, EUP webserver | Ubiquitination site prediction | Species specificity, accuracy metrics, accessibility |
The expanding toolkit for ubiquitination research offers multiple pathways for experimental design, each with distinct advantages and limitations. Method selection should be guided by sample type, specific research questions, and available resources. For most applications, SP3 methodology provides superior performance in protein quantification and digestion efficiency, while FASP remains valuable for detergent-heavy lysis conditions. The emergence of chain-specific TUBEs and serial PTM enrichment protocols enables increasingly sophisticated studies of ubiquitin signaling in physiological contexts. As computational prediction tools continue to evolve, integration of experimental and bioinformatic approaches will further accelerate deciphering of the complex Ub code, with significant implications for understanding disease mechanisms and developing targeted therapeutics.
Addressing Computational and Experimental Challenges
In the field of bioinformatics, particularly in ubiquitination site prediction, researchers frequently encounter class imbalance—a scenario where the number of negative examples (non-ubiquitination sites) significantly outweighs the positive examples (authentic ubiquitination sites). This imbalance presents a substantial challenge for machine learning models, which may become biased toward the majority class, thereby compromising predictive accuracy for the critical minority class [62] [63]. In real-world ubiquitination datasets, the positive-to-negative ratio can be as severe as 1:8 or higher, mirroring the natural rarity of these modification sites within proteomes [24] [27]. This article objectively compares the performance of various class imbalance strategies within the specific context of evaluating database search algorithms for ubiquitination site research, providing experimental data and methodologies relevant to researchers, scientists, and drug development professionals.
The fundamental difficulty with severely imbalanced datasets is that standard training batches may contain insufficient minority class examples for the model to learn meaningful patterns [62]. When a model is presented with batches where minority class examples are absent or extremely rare, it effectively learns to ignore the minority class, treating its signals as noise. Furthermore, standard evaluation metrics like accuracy become misleading; a model that simply always predicts "negative" can achieve high accuracy yet be practically useless for research applications [63].
Core Strategies for Managing Class Imbalance
Data-Level Strategies: Resampling
Resampling techniques directly adjust the composition of the training dataset to create a more balanced class distribution.
Undersampling: This method reduces the number of majority class examples. Random undersampling removes examples randomly, while informed methods like the Tomek link algorithm remove majority class examples that are "too close" to minority examples, effectively cleaning the decision boundary [64] [63]. A key advantage is reduced computational cost and faster training due to the smaller dataset size [62]. The primary risk is the loss of potentially useful information from the discarded majority examples.
Oversampling: This method increases the number of minority class examples. The simplest approach is random oversampling with replacement, which can lead to overfitting [63]. The Synthetic Minority Oversampling Technique (SMOTE) is a more sophisticated alternative that generates synthetic minority examples by interpolating between existing ones in feature space, promoting better generalization [64] [63]. The downside is increased computational cost and the potential for creating unrealistic synthetic examples.
Combined Sampling: Advanced protocols, such as the one used in the EUP predictor, integrate multiple techniques. EUP employed random under-sampling of the majority class combined with the Neighbourhood Cleaning Rule (NCR) for data denoising, constructing a more robust and balanced dataset for training [28].
Algorithm-Level Strategies
These strategies modify the learning algorithm itself to compensate for the class imbalance.
Cost-Sensitive Learning: This approach assigns a higher misclassification cost to the minority class. During training, the algorithm is penalized more heavily for errors on minority class examples, forcing it to pay more attention to them. Many classifiers in popular libraries like scikit-learn offer a
class_weightparameter that can be set to 'balanced' to automatically adjust costs inversely proportional to class frequencies [64].Ensemble Methods: These methods combine multiple models to improve overall performance. The BalancedBaggingClassifier is an extension of standard ensemble methods that incorporates additional balancing during training. It creates an ensemble where each base classifier is trained on a resampled subset of the data that is more balanced [63]. Other specialized ensembles like EasyEnsemble and RUSBoost are also designed specifically for imbalanced data [64].
Specialized Algorithms and Hybrid Models: Some tools are built with inherent mechanisms to handle imbalance. For instance, DeepMVP, a deep learning framework for PTM site prediction, was trained on a large, high-quality dataset (PTMAtlas) which, through systematic curation, helped mitigate inherent data biases [29]. The Ubigo-X predictor used an ensemble of three sub-models combined via a weighted voting strategy, which can inherently balance the influence of different class predictions [24] [27].
Strategic Workflow for Imbalance Mitigation
The following diagram illustrates the logical relationships and pathways for implementing the different strategies discussed, from data handling to algorithm-level adjustments.
Experimental Comparison in Ubiquitination Research
Performance Metrics for Imbalanced Data
When evaluating models on imbalanced data, moving beyond simple accuracy is crucial. The following metrics provide a more nuanced view [64] [63]:
- Precision: The accuracy of positive predictions (how many predicted ubiquitination sites are real).
- Recall (Sensitivity): The ability to identify all actual positive examples (how many real ubiquitination sites are found).
- F1-Score: The harmonic mean of precision and recall, providing a single balanced metric.
- Matthews Correlation Coefficient (MCC): A more robust metric that considers true and false positives and negatives, and is reliable even on imbalanced datasets.
- Area Under the ROC Curve (AUC-ROC): Measures the model's ability to distinguish between classes across all classification thresholds.
Quantitative Comparison of Strategy Performance
The table below summarizes the performance of various ubiquitination site prediction tools that employed different imbalance strategies, as reported in independent tests.
Table 1: Performance of Ubiquitination Site Predictors Using Different Imbalance Strategies
| Predictor / Strategy | Strategy Category | Reported AUC | Reported Accuracy | Reported MCC | Test Data Imbalance Ratio (Pos:Neg) |
|---|---|---|---|---|---|
| Ubigo-X [24] [27] | Ensemble with Weighted Voting | 0.94 | 0.85 | 0.55 | 1:8 (Imbalanced) |
| Ubigo-X [24] [27] | Ensemble with Weighted Voting | 0.85 | 0.79 | 0.58 | ~1:1 (Balanced) |
| DeepMVP [29] | Specialized DL on Curated Data (PTMAtlas) | Outperformed existing tools | - | - | - |
| EUP [28] | Combined Sampling (Undersampling + NCR) | Superior cross-species performance | - | - | - |
| Hybrid DL Model [10] | Deep Learning with Hand-Crafted Features | - | 0.8198 | - | - |
Analysis of Comparative Data
The experimental data reveals critical insights. The Ubigo-X tool demonstrates a notable trade-off: when tested on a severely imbalanced dataset (1:8 ratio), it achieved a very high AUC of 0.94, but a moderate MCC of 0.55 [24] [27]. MCC, which provides a more reliable measure on imbalanced sets, was lower than the MCC of 0.58 achieved when the same model was tested on a more balanced dataset. This highlights that while an ensemble strategy is effective, performance metrics must be interpreted in the context of the underlying data distribution.
Furthermore, a broad empirical study evaluating strategies across 58 imbalanced datasets found that the effectiveness of each strategy varied significantly depending on the evaluation metric used [64]. No single strategy dominated across all metrics, underscoring the need for researchers to select strategies based on the metric most critical to their specific application (e.g., maximizing recall for a safety-critical diagnostic).
Detailed Experimental Protocols
Protocol 1: Downsampling and Upweighting
This two-step technique separates the goal of learning the features of each class from the goal of learning the true class distribution [62].
- Downsampling the Majority Class: Train on a disproportionately low percentage of the majority class examples. For example, in a dataset with a 99:1 imbalance, downsampling by a factor of 25 can create an artificial training set with an 80:20 balance. This greatly increases the probability that each training batch contains enough minority examples for the model to learn effectively.
- Upweighting the Downsampled Class: To correct the bias introduced by the artificial balance, apply a weight to the loss function for every majority class example. The weight should be equal to the factor by which it was downsampled (e.g., a factor of 25). This treats a misclassification of a majority example as more costly, ensuring the model learns the true class prevalence.
Protocol 2: Data Curation and Ensemble Workflow (Ubigo-X)
The Ubigo-X predictor exemplifies a comprehensive workflow integrating data curation and ensemble modeling [24] [27].
- Data Collection and Filtering: Source training data from specialized databases like the Protein Lysine Modification Database (PLMD). Apply redundancy reduction using CD-HIT (30% sequence identity threshold) and use CD-HIT-2d to filter negative samples with high similarity (>40%) to any positive sample, preventing interference.
- Multi-Feature Encoding:
- Single-Type SBF: Encode sequences using Amino Acid Composition (AAC), AAindex physicochemical properties, and one-hot encoding.
- Co-Type SBF: Transform Single-Type SBF features via k-mer encoding.
- S-FBF: Extract structure-based and function-based features like secondary structure and solvent accessibility.
- Model Training and Ensemble:
- Train the S-FBF model using XGBoost.
- Transform the Single-Type SBF and Co-Type SBF features into image-based formats and train using a ResNet34 deep learning architecture.
- Combine the predictions of the three sub-models using a weighted voting strategy to produce the final prediction.
Protocol 3: Combined Sampling and Deep Feature Extraction (EUP)
The EUP framework employs a modern deep learning approach combined with rigorous data cleaning [28].
- Data Acquisition and Splitting: Collect multi-species ubiquitination data from the CPLM 4.0 database. Randomly split the data into training and test sets in a 7:3 ratio.
- Feature Extraction with ESM2: Use the ESM2 (Evolutionary Scale Model), a large pre-trained protein language model, to extract rich, contextual feature representations for each lysine site in a sequence. This captures evolutionary and structural information more effectively than hand-crafted features.
- Data Balancing and Denoising:
- Apply random under-sampling to the majority class (non-ubiquitination sites).
- Use the Neighbourhood Cleaning Rule (NCR) to remove noisy majority class examples that confuse the classification boundary.
- Dimensionality Reduction and Modeling: Use a Conditional Variational Autoencoder (cVAE) to reduce the high-dimensional ESM2 features to a lower-dimensional latent representation. Train a downstream deep neural network on this latent space for final ubiquitination site prediction.
For researchers developing or applying ubiquitination site prediction tools, the following resources are fundamental.
Table 2: Key Research Reagents and Computational Tools
| Item / Resource | Type | Function / Application in Research |
|---|---|---|
| PLMD (Protein Lysine Modification Database) [24] | Data Repository | A key source of experimentally verified ubiquitination and other lysine modification sites for training and benchmarking predictive models. |
| PhosphoSitePlus (PSP) [24] [29] | Data Repository | A widely used PTM database containing ubiquitination sites; often used as an independent test set to validate model performance. |
| CPLM 4.0 [28] | Data Repository | A compendium of protein lysine modifications that provides multi-species ubiquitination data for building cross-species predictors. |
| CD-HIT / CD-HIT-2d [24] | Computational Tool | Used for sequence redundancy reduction and to filter negative samples, preventing overfitting and data leakage between positive and negative sets. |
| ESM2 (Evolutionary Scale Model) [28] | Computational Tool | A state-of-the-art protein language model used to generate powerful, context-aware feature representations from raw amino acid sequences. |
| SMOTE [64] [63] | Computational Algorithm | A synthetic oversampling technique used to generate new minority class instances and balance training datasets. |
| XGBoost [24] [27] | Computational Algorithm | A powerful gradient boosting algorithm frequently used to train sub-models in ensemble predictors for PTM site prediction. |
| ResNet (Residual Network) [24] [27] | Computational Algorithm | A deep convolutional neural network architecture effective for learning from complex, image-transformed feature representations of sequences. |
The management of class imbalance is not a one-size-fits-all problem. Based on the experimental evidence and protocols reviewed, the following recommendations can be made for ubiquitination site research:
- For High-Dimensional Data: Strategies like EUP that leverage large pre-trained models (ESM2) combined with sophisticated data cleaning (NCR) and balancing show great promise, especially for cross-species prediction [28].
- For Robust Performance: Ensemble methods, as demonstrated by Ubigo-X, consistently deliver strong performance across both balanced and imbalanced test sets, making them a reliable choice [24] [27].
- For Metric Selection: Prioritize MCC and F1-score over accuracy for a truthful evaluation of model performance on imbalanced data [24] [63].
- For Data Curation: The quality and curation of the training data, as emphasized in DeepMVP's PTMAtlas, are as critical as the choice of algorithm. Rigorous de-redundancy and negative set filtering are essential steps [29].
In conclusion, the choice between using a balanced training set (via resampling) or learning directly from an imbalanced set (via cost-sensitive or specialized methods) depends on the specific research goals, data characteristics, and computational resources. A hybrid approach, combining data-level and algorithm-level strategies, often yields the most robust and generalizable models for identifying ubiquitination sites and advancing biomedical discovery.
In the field of proteomics, particularly in the study of post-translational modifications such as ubiquitination, the choice of lysis buffer is a critical determinant of experimental success. Efficient protein extraction and solubilization are prerequisites for comprehensive analysis, yet researchers face significant challenges in selecting appropriate methodologies that balance extraction efficiency with compatibility with downstream mass spectrometry (MS) analysis. This comparison guide objectively evaluates two commonly used lysis buffers—sodium deoxycholate (SDC) and urea—within the specific context of ubiquitination site research. As the scientific community strives to characterize the ubiquitinome with increasing precision, the optimization of sample preparation protocols becomes paramount. The broader thesis of evaluating database search algorithms for ubiquitination research is fundamentally connected to initial sample preparation; the quality and depth of data generated by these algorithms are directly contingent upon the initial protein extraction and digestion efficiency. This guide provides researchers, scientists, and drug development professionals with experimental data and detailed protocols to inform their methodological decisions, ultimately contributing to more robust and reproducible ubiquitination studies.
Background and Principles of Lysis Buffers
Protein lysis buffers function by disrupting cellular membranes and denaturing proteins to make them accessible for enzymatic digestion. The mechanism of action differs significantly between detergent-based and chaotrope-based buffers, leading to distinct practical implications for proteomic workflows. SDC is an anionic detergent that solubilizes proteins and lipids through its amphiphilic nature, possessing a hydrophobic steroid backbone and a hydrophilic carboxyl group. This structure allows SDC to effectively disrupt lipid-lipid and lipid-protein interactions, making it particularly effective for membrane protein extraction [57]. A key advantage of SDC is its compatibility with high-temperature incubations (e.g., 95°C), which significantly enhances protein extraction efficiency, especially from challenging sample types like formalin-fixed paraffin-embedded (FFPE) tissues [65].
In contrast, urea is a chaotropic agent that denatures proteins by disrupting hydrogen bonds and the hydrophobic effect, thereby unfolding protein structures without directly solubilizing membranes. Urea is typically used at high concentrations (8 M) in lysis buffers for effective protein denaturation [66]. However, a critical limitation of urea is its incompatibility with heat; at elevated temperatures, urea can decompose to form cyanate, which carbamylates primary amines on lysine residues and peptide N-termini, leading to artificial modifications that complicate MS analysis and database searching [66] [65]. This is particularly problematic in ubiquitination studies where lysine modifications are the primary focus of investigation.
The tryptic digestion of ubiquitinated proteins produces a characteristic di-glycyl remnant (K-ε-GG) on modified lysine residues, which serves as the key diagnostic feature for ubiquitination site identification [66] [25]. The efficiency with which proteins are extracted and digested directly impacts the number of ubiquitination sites that can be identified and quantified, making lysis buffer selection a fundamental consideration in ubiquitinome studies.
Performance Comparison: SDC vs. Urea
Quantitative Performance Metrics
Recent comparative studies have provided quantitative data on the performance of SDC and urea buffers in proteomic preparations. The following table summarizes key findings from direct comparisons:
Table 1: Direct comparison of SDC and urea lysis buffer performance in bottom-up proteomics
| Performance Metric | SDC-Based Method | Urea-Based Method | Experimental Context | Source |
|---|---|---|---|---|
| Protein Identifications | Highest protein counts | Lower than SDC | HeLa S3 cells, 100μg protein input | [67] |
| Peptide Identifications | Highest peptide counts | Lower than SDC | HeLa S3 cells, 100μg protein input | [67] |
| Peptide Recovery Consistency | High | N/A | Compared to commercial kits | [67] |
| Digestion Efficiency | 84.6% peptides with no missed cleavages | 77.5% peptides with no missed cleavages | HeLa cells, SP3 protocol | [57] |
| Heat Compatibility | Compatible with 95°C incubation | Incompatible with heat due to carbamylation | FFPE tissue protein extraction | [65] |
| Membrane Protein Coverage | Enhanced membrane proteome identification | Lower membrane protein coverage | HeLa cells, SP3 protocol | [57] |
A comprehensive evaluation of cell lysis and protein digestion protocols for bottom-up proteomics using HeLa S3 cells revealed that the choice of digestion method had a much more significant impact on protein identifications than the homogenization method [67]. This study assessed two physical disruption methods—sonication and BeatBox—alongside four digestion protocols, including urea-based and SDC-based in-solution digestion. The results clearly indicated that SDC digestion yielded the highest protein and peptide counts among the methods tested [67].
Further evidence supporting SDC's performance advantages comes from a methodological comparison that evaluated the efficiency of different lysis buffers and sample preparation methods for liquid chromatography-mass spectrometry analysis. This research demonstrated that the SP3 (single-pot, solid-phase-enhanced sample preparation) protocol with SDS/SDC buffer achieved superior digestion efficiency, with 84.6% of peptides containing no missed cleavages compared to 77.5% with SP3/GnHCl (a similar chaotrope to urea) [57]. The same study also found that SP3/SDS-SDC methods identified approximately 17% more proteins than in-solution digestion with chaotropic buffers, with particular advantages for membrane protein identification [57].
Compatibility with Ubiquitination Site Analysis
For ubiquitination site analysis specifically, specialized urea lysis buffers have been developed and optimized. A commonly used formulation for ubiquitinome studies includes:
- 8 M urea
- 50 mM Tris HCl (pH 8.0)
- 150 mM NaCl
- 1 mM EDTA
- Protease inhibitors
- Deubiquitinase inhibitors (e.g., 50 μM PR-619)
- Alkylating agents (e.g., 1 mM chloroacetamide or iodoacetamide) [66]
A critical requirement emphasized in the protocol is that urea lysis buffer should always be prepared fresh to prevent protein carbamylation, which would create artificial modifications that complicate the detection of true ubiquitination sites [66]. This requirement represents a significant practical consideration for large-scale ubiquitinome studies where multiple samples must be processed simultaneously.
The heat compatibility of SDC provides distinct advantages for certain applications. In studies of FFPE tissues, where heat-induced antigen retrieval is essential for reversing formaldehyde cross-links, the combination of SDC buffer with high-temperature incubation (95°C) enabled protein extraction efficiency that reached the same level as extraction from frozen sections [65]. The researchers noted that compared to the conventional method using urea buffer, their method using phase-transfer surfactant (PTS) buffer containing SDC at 95°C showed better agreement of peptide peak areas between FFPE and fresh samples [65].
Experimental Protocols
SDC-Based Lysis and Digestion Protocol
The following protocol for SDC-based protein extraction and digestion is adapted from established methodologies [67] [65] [57]:
Table 2: Key reagents for SDC-based ubiquitination studies
| Reagent | Function | Considerations for Ubiquitination Studies |
|---|---|---|
| SDC Lysis Buffer (1% SDC, 100 mM Tris-HCl, pH 8.5) | Protein solubilization and denaturation | Compatible with heat; effective for membrane proteins |
| Tris(2-carboxyethyl)phosphine (TCEP) | Disulfide bond reduction | Use at 500 mM stock; final concentration ~5 mM |
| Chloroacetamide (CAA) | Cysteine alkylation | Preferred over iodoacetamide for ubiquitination studies [66] |
| Trypsin/Lys-C Mix | Proteolytic digestion | Lys-C activity maintained in SDC; more efficient than trypsin alone |
| Trifluoroacetic Acid (TFA) | Digestion termination and SDC precipitation | Acidification to pH <2 precipitates SDC |
| C18 Desalting Columns | Peptide cleanup and SDS removal | Essential prior to LC-MS/MS analysis |
- Cell Lysis: Resuspend cell pellets in SDC lysis buffer (1% SDC, 100 mM Tris-HCl, pH 8.5). Add universal nuclease to digest nucleic acids and reduce viscosity.
- Homogenization: Perform sonication on ice (10 cycles of 5s pulse/10s rest at 25% power) or use a homogenization system like BeatBox (10 min twice on high setting).
- Protein Quantification: Determine protein concentration using BCA assay.
- Aliquot Preparation: Aliquot 100 μg protein per sample.
- Reduction: Add TCEP to 5 mM final concentration; incubate at 37°C for 20 min with shaking (750 rpm).
- Alkylation: Add CAA to 15 mM final concentration; incubate in the dark for 15 min at room temperature.
- Dilution and Digestion: Add 5 μL of 100 mM CaCl₂ and trypsin/Lys-C protease mix (1:30 enzyme-to-protein ratio). Digest overnight at 37°C with shaking (750 rpm).
- Termination and SDC Removal: Stop digestion with 20% TFA to achieve pH <2. Centrifuge at 13,000×g for 10 min to pellet precipitated SDC.
- Peptide Cleanup: Transfer supernatant to C18 desalting columns; elute with 70% acetonitrile, 0.2% formic acid.
- Sample Concentration: Dry samples in a vacuum concentrator and reconstitute in MS loading solvent.
Urea-Based Lysis and Digestion Protocol
For ubiquitination site analysis, the following urea-based protocol has been specifically optimized [66]:
- Fresh Buffer Preparation: Prepare urea lysis buffer (8 M urea, 50 mM Tris HCl pH 8.0, 150 mM NaCl, 1 mM EDTA) immediately before use.
- Inhibitor Supplementation: Add protease inhibitors (2 μg/mL aprotinin, 10 μg/mL leupeptin), deubiquitinase inhibitors (50 μM PR-619), and alkylating agents (1 mM chloroacetamide) immediately before cell lysis.
- Cell Lysis: Lyse cells in urea lysis buffer; vortex thoroughly.
- Protein Quantification: Determine protein concentration using BCA assay.
- Reduction and Alkylation: Add DTT to 1 mM final concentration; incubate at 37°C for 30 min. Then add iodoacetamide to 5.5 mM final concentration; incubate in the dark for 15 min.
- Dilution and Digestion: Dilute urea concentration to 2 M using 50 mM HEPES. Add trypsin/Lys-C (1:50 enzyme-to-protein ratio); digest overnight at 37°C.
- Peptide Cleanup: Desalt using C18 solid-phase extraction.
- K-ε-GG Enrichment: Enrich ubiquitinated peptides using anti-K-ε-GG antibody prior to LC-MS/MS analysis.
Application in Ubiquitination Site Research
The integration of SDC and urea lysis methods into ubiquitination site research requires special considerations for optimal results. For large-scale ubiquitinome profiling that aims to identify thousands of ubiquitination sites, the urea-based protocol has been thoroughly validated and enables routine detection of >10,000 distinct ubiquitination sites from cell lines or tissue samples [66]. This approach benefits from the well-characterized compatibility of urea with the anti-K-ε-GG antibody enrichment workflow, which specifically isolates peptides containing the di-glycyl remnant left after tryptic digestion of ubiquitinated proteins [66] [25].
For challenging sample types such as FFPE tissues or samples rich in membrane proteins, SDC-based lysis offers significant advantages. The ability to use heat-assisted extraction (95°C) with SDC buffer enables efficient protein recovery from FFPE specimens, with quantitative accuracy comparable to fresh samples [65]. This is particularly valuable for clinical ubiquitination studies where FFPE biobank samples may be the primary material available.
Recent advances in machine learning approaches for ubiquitination site prediction have created additional implications for sample preparation. As computational methods achieve increasingly high accuracy (e.g., 99.88% as reported in one study [34]), the quality of training data becomes paramount. Comprehensive coverage of the ubiquitinome, including membrane-associated proteins and low-abundance regulators, requires optimized wet-lab methodologies that minimize biases in protein extraction and digestion. Deep learning models have been shown to outperform classical machine learning methods, particularly when using both raw amino acid sequences and hand-crafted features [2], but these models depend on high-quality experimental data for training.
The biological context of ubiquitination also influences method selection. Research has revealed that different branches of the ubiquitin machinery—the ubiquitin-proteasome system versus the ubiquitin trafficking system—may be unevenly perturbed by experimental conditions [68]. Studies using lysineless ubiquitin (K0 Ub) found that many enriched substrates were membrane-associated or involved in cellular trafficking, with associated chains enriched for Lys63 linkages over Lys48 linkages [68]. For researchers focusing on membrane protein ubiquitination or specific linkage types, SDC-based protocols may provide more comprehensive coverage.
The comparison between SDC and urea lysis buffers reveals a nuanced landscape where each reagent offers distinct advantages for specific applications in ubiquitination research. Urea-based lysis remains the thoroughly validated choice for traditional ubiquitinome profiling using anti-K-ε-GG enrichment, particularly when following established protocols that emphasize fresh buffer preparation and proper inhibitor cocktails to stabilize ubiquitin conjugates. Conversely, SDC-based lysis demonstrates superior performance for membrane proteome coverage, heat-compatible applications such as FFPE tissue analysis, and overall protein/peptide identification numbers in standard bottom-up proteomics.
The broader thesis of evaluating database search algorithms for ubiquitination site research is intrinsically connected to these sample preparation considerations. The depth and quality of data generated by computational approaches—whether conventional machine learning or advanced deep learning models—are fundamentally constrained by the initial protein extraction and digestion efficiency. As the field progresses toward more comprehensive ubiquitinome mapping and clinical applications, researchers must carefully select lysis protocols based on their specific biological questions, sample types, and analytical goals. The experimental data and detailed methodologies presented in this comparison guide provide a foundation for making these critical methodological decisions, ultimately contributing to more robust, reproducible, and comprehensive characterization of protein ubiquitination.
The accurate identification of ubiquitination sites (Ubi-sites) is a critical challenge in molecular biology and drug development, as this post-translational modification regulates essential cellular processes including protein degradation, DNA repair, and signal transduction [10] [61]. While traditional experimental methods like mass spectrometry remain costly and time-consuming, computational prediction tools have emerged as vital alternatives [24] [10]. Among these, ensemble methods that leverage weighted voting strategies have demonstrated remarkable performance improvements over single-model approaches by synthesizing the strengths of diverse algorithms [24] [69]. This guide provides an objective comparison of ensemble methods for Ubi-site prediction, focusing on their underlying architectures, experimental performance, and implementation requirements to assist researchers in selecting appropriate tools for their investigations.
These ensemble systems address a fundamental limitation of single-model approaches: their varying and often complementary performance across different data characteristics and species [70] [61]. By strategically combining multiple machine learning models through optimized weighting schemes, ensemble methods achieve enhanced robustness and predictive accuracy, making them particularly valuable for classifying ubiquitination sites across diverse biological contexts [24] [69].
Key Weighted Voting Architectures
The Ubigo-X Framework: Integrated Feature Processing
The Ubigo-X framework employs a sophisticated weighted voting strategy that integrates three specialized sub-models processing different feature types. This architecture demonstrates how feature diversity complements model diversity in advanced ensemble systems [24] [27].
- Single-Type Sequence-Based Features (Single-Type SBF): This component utilizes amino acid composition (AAC), amino acid index (AAindex), and one-hot encoding to represent fundamental sequence properties.
- k-mer Sequence-Based Features (Co-Type SBF): This sub-model extends the Single-Type SBF approach through k-mer encoding, capturing more complex sequence patterns.
- Structure-Based and Function-Based Features (S-FBF): This branch incorporates structural characteristics including secondary structure, relative solvent accessibility (RSA), absolute solvent-accessible area (ASA), and signal peptide cleavage sites.
The S-FBF sub-model is trained using XGBoost, while the sequence-based features (Single-Type SBF and Co-Type SBF) are transformed into image-based representations and processed through Resnet34 deep learning networks. Ubigo-X ultimately combines predictions from these three specialized models using a performance-weighted voting strategy [24].
Performance-Weighted Voting Model
This ensemble architecture, developed for cancer type classification but conceptually applicable to ubiquitination prediction, employs a mathematically rigorous weighting approach based on linear regression optimization [69].
The system integrates five base classifiers: logistic regression (LR), support vector machine (SVM), random forest (RF), XGBoost, and neural networks (NN). Rather than using equal weights or simple averaging, this method determines optimal weights for each classifier by solving linear regression functions that map base classifier predictions to actual outcomes. This approach assigns higher influence to models demonstrating superior predictive performance for specific data patterns [69].
RRMSE-Enhanced Weighted Voting
Designed specifically for regression tasks, the RRMSE (Relative Root Mean Square Error) Voting Regressor addresses a common limitation in ensemble systems: the use of uniform weights regardless of individual model performance [71] [72].
This method dynamically assigns weights to each base model based on their relative error rates, giving greater importance to models demonstrating higher accuracy. The RRMSE weighting function provides a systematic, data-driven mechanism for weight assignment that requires no prior domain knowledge, making it particularly valuable for researchers exploring novel prediction domains [71].
Experimental Performance Comparison
Quantitative Performance Metrics
Table 1: Performance Comparison of Ensemble Methods on Balanced Datasets
| Model | AUC | Accuracy | MCC | Dataset |
|---|---|---|---|---|
| Ubigo-X | 0.85 | 0.79 | 0.58 | PhosphoSitePlus (Balanced) |
| Ubigo-X | 0.81 | 0.59 | 0.27 | GPS-Uber |
| Performance-Weighted Voting | - | 0.7146 | - | TCGA Cancer Data |
| Deep Learning Model (Hybrid) | - | 0.8198 | - | dbPTM Human Proteins |
Table 2: Ubigo-X Performance on Imbalanced Data (1:8 Ratio)
| Metric | Score |
|---|---|
| AUC | 0.94 |
| Accuracy | 0.85 |
| MCC | 0.55 |
Ubigo-X demonstrates particularly strong performance on imbalanced datasets, which more closely resemble real-world biological data distributions where non-ubiquitination sites significantly outnumber positive sites [24]. The performance-weighted voting model achieved a 71.46% overall accuracy on cancer type classification, significantly outperforming its individual component classifiers (LR: 68.67%, SVM: 63.74%, RF: 54.79%, XGBoost: 62.89%, NN: 68.07%) and both hard-voting (69.06%) and soft-voting (69.66%) ensembles [69].
Independent benchmarking of deep learning approaches for human Ubi-site prediction revealed that hybrid models utilizing both raw amino acid sequences and hand-crafted features achieved an accuracy of 81.98% with an F1-score of 0.902 [10], highlighting the potential of integrated feature representation strategies.
Experimental Protocols and Methodologies
Ubigo-X Implementation Protocol:
- Data Collection: Training data sourced from PLMD 3.0 containing 53,338 ubiquitination and 71,399 non-ubiquitination sites after sequence filtering with CD-HIT and CD-HIT-2d to reduce redundancy [24].
- Feature Extraction: Multiple feature types extracted including amino acid composition, AAindex properties, one-hot encoding, k-mer representations, secondary structure, solvent accessibility, and signal peptide cleavage sites [24].
- Model Training: Three sub-models trained independently: S-FBF using XGBoost, Single-Type SBF and Co-Type SBF transformed to image-based features and trained using Resnet34 [24].
- Weighted Integration: Predictions from three sub-models combined through optimized weighted voting strategy [24].
- Validation: Independent testing performed using PhosphoSitePlus and GPS-Uber datasets [24].
Performance-Weighted Voting Methodology:
- Base Classifier Training: Five classifiers (LR, SVM, RF, XGBoost, NN) trained independently using mutation count per gene as input features [69].
- Cross-Validation: Base classifiers evaluated through cross-validation to obtain predicted results [69].
- Weight Optimization: Weights for each classifier determined based on predictive performance by solving linear regression functions [69].
- Ensemble Prediction: Final probability calculated as summation of each classifier's weight multiplied by its predicted probability [69].
Workflow Visualization
Ubigo-X Ensemble Workflow: This diagram illustrates the integrated workflow of the Ubigo-X system, showing how multiple feature types are processed by specialized sub-models before weighted voting integration.
Performance-Weighted Voting Process: This workflow details the optimization-based approach for determining model weights based on cross-validation performance.
Research Reagent Solutions
Table 3: Essential Research Resources for Ubiquitination Prediction
| Resource | Type | Function | Representative Examples |
|---|---|---|---|
| Protein Databases | Data Source | Provide experimentally verified ubiquitination sites for model training and testing | PLMD 3.0 [24], dbPTM [10], CPLM 4.0 [61], PhosphoSitePlus [24] |
| Feature Encoding Tools | Computational Methods | Transform protein sequences into machine-readable features | Amino Acid Composition (AAC) [24], AAindex [24], one-hot encoding [24], k-mer encoding [24] |
| Base Classifiers | Algorithm Components | Serve as weak learners in ensemble systems | Logistic Regression [73] [69], SVM [73] [69], Random Forest [70] [69], XGBoost [70] [69], Neural Networks [69] |
| Deep Learning Architectures | Specialized Models | Process complex feature representations | Resnet34 [24], Convolutional Neural Networks [10], Pretrained Language Models (ESM2) [61] |
| Validation Frameworks | Benchmarking Tools | Ensure fair performance comparison and prevent data leakage | Independent Test Sets [24], Cross-Validation [69], Balanced/Imbalanced Data Splits [24] |
Weighted voting ensemble methods represent a significant advancement in ubiquitination site prediction, consistently demonstrating superior performance compared to individual models and uniformly weighted ensembles across multiple benchmarking studies [24] [69]. The strategic integration of diverse algorithms and feature representations enables these systems to capture complex patterns in biological data that individual models may miss.
For researchers and drug development professionals, ensemble approaches offer particular value in scenarios requiring high prediction reliability, such as identifying therapeutic targets or understanding disease mechanisms linked to ubiquitination pathways [10]. The consistent outperformance of weighted voting strategies over uniform weighting approaches [69] underscores the importance of implementing optimized integration methods rather than simple averaging when constructing ensemble systems.
Future developments in this field will likely focus on integrating emerging protein language models [61] with traditional feature engineering approaches, further refining weighting strategies through meta-learning techniques, and enhancing model interpretability to provide biological insights alongside prediction accuracy. As these computational tools continue evolving, they will play an increasingly vital role in accelerating ubiquitination research and therapeutic development.
In the field of proteomics, data-independent acquisition (DIA) mass spectrometry has emerged as a powerful alternative to data-dependent acquisition (DDA) methods, offering superior reproducibility, quantitative accuracy, and data completeness across samples [74] [48]. However, the computational processing of DIA datasets presents significant challenges due to inherent spectral complexity and interference from co-fragmenting precursors [75]. The analysis of post-translational modifications, particularly ubiquitination, adds another layer of complexity due to the low stoichiometry of the modification and the need for specialized enrichment techniques [48].
Several software tools have been developed to address these challenges, employing different computational approaches for peptide identification and quantification. This comparison guide focuses on evaluating DIA-NN, which utilizes deep neural networks, alongside other prominent DIA data analysis tools including OpenSWATH, EncyclopeDIA, Skyline, and Spectronaut [74]. We examine their performance specifically in the context of ubiquitination site research, providing experimental data and methodologies to guide researchers in selecting appropriate tools for their proteomics workflows.
Performance Comparison of DIA Analysis Tools
Identification and Quantification Performance
Multiple studies have systematically compared the performance of DIA data analysis tools across different mass spectrometry platforms and sample types. A comprehensive 2023 evaluation assessed five tools (OpenSWATH, EncyclopeDIA, Skyline, DIA-NN, and Spectronaut) using six DIA datasets from TripleTOF, Orbitrap, and TimsTOF Pro instruments [74]. The findings revealed that library-free approaches, such as those implemented in DIA-NN, outperformed library-based methods when spectral libraries had limited comprehensiveness, though building comprehensive libraries remained advantageous for most DIA analyses [74].
Table 1: Comparison of DIA Software Tools for Proteomics Analysis
| Software | License | Key Features | Strengths | Limitations |
|---|---|---|---|---|
| DIA-NN | Free (academic) / Commercial [76] | Deep neural networks, interference correction, library-based & library-free modes [77] [75] | High speed, deep proteome coverage with fast gradients, sensitive [77] [75] | Less polished GUI, minimal built-in visualization [77] |
| Spectronaut | Commercial [77] | Advanced machine learning, extensive visualization, vendor-agnostic [77] | High performance, scalability, PTM support, considered "gold standard" for DIA [74] [77] | Significant licensing cost [77] |
| Skyline | Free, open-source [77] | Strong visualization, targeted method development, clean GUI [77] | Ideal for targeted and DIA proteomics, extensive documentation [77] | Less comprehensive for large-scale discovery proteomics [77] |
| OpenSWATH | Free, open-source [74] [77] | Modular, vendor-neutral workflows, part of OpenMS [77] | High flexibility, customizable workflows [77] | Steeper learning curve for non-programmers [77] |
| EncyclopeDIA | Free, open-source [74] | Target-decoy mode, Percolator for FDR estimation [74] | Robust FDR control, compatible with various library formats [74] | Less widely adopted than other tools [74] |
In benchmark studies using public datasets, DIA-NN demonstrated substantially better identification performance compared to other tools, with the biggest differences observed at strict false discovery rate (FDR) thresholds [75]. DIA-NN achieved more confident identifications and deeper proteome coverage even with short chromatographic gradients, identifying more precursors from a 0.5-hour acquisition than either Skyline or OpenSWATH could achieve with a 1-hour gradient on the same sample [75].
Performance in Ubiquitinome Analysis
In specialized applications like ubiquitinome analysis, DIA-NN has enabled remarkable advances. A 2021 study developed a sensitive workflow combining diGly antibody-based enrichment with optimized Orbitrap-based DIA and comprehensive spectral libraries containing more than 90,000 diGly peptides [48]. Using DIA-NN for analysis, this approach identified approximately 35,000 diGly peptides in single measurements of proteasome inhibitor-treated cells—doubling the number and quantitative accuracy achievable with data-dependent acquisition [48].
Table 2: Quantitative Performance Comparison in Ubiquitinome Analysis
| Metric | DIA-NN (DIA) | DDA | Improvement |
|---|---|---|---|
| Distinct diGly peptides | 33,409 ± 605 [48] | ~20,000 [48] | ~67% increase |
| diGly peptides with CV <20% | 45% [48] | 15% [48] | 3-fold improvement |
| diGly peptides with CV <50% | 77% [48] | Not reported | - |
| Total distinct diGly peptides across replicates | ~48,000 [48] | ~24,000 [48] | 2-fold increase |
The DIA-based diGly workflow demonstrated markedly improved reproducibility compared to DDA methods. Across six DIA experiments, nearly 48,000 distinct diGly peptides were identified, compared to 24,000 in corresponding DDA experiments [48]. Quantitative accuracy was also substantially better, with 45% of diGly peptides showing coefficients of variation (CVs) below 20% in DIA analyses compared to only 15% in DDA [48].
Experimental Protocols and Methodologies
Sample Preparation for Ubiquitinome Analysis
The high-performance ubiquitinome analysis using DIA-NN relies on optimized sample preparation protocols. The detailed methodology from the Nature Communications study on ubiquitinome analysis is as follows [48]:
Cell Treatment: Human cell lines (HEK293 and U2OS) are treated with proteasome inhibitor (10 μM MG132) for 4 hours to increase ubiquitinated protein levels.
Protein Extraction and Digestion: Proteins are extracted and digested with trypsin, generating peptides with diGly remnants from previously ubiquitinated lysine residues.
Peptide Fractionation: Peptides are separated by basic reversed-phase (bRP) chromatography into 96 fractions, which are then concatenated into 8 fractions.
K48-peptide Handling: Fractions containing the highly abundant K48-linked ubiquitin-chain derived diGly peptide are processed separately to reduce competition for antibody binding sites during enrichment.
diGly Peptide Enrichment: The resulting nine pooled fractions are enriched for diGly peptides using anti-diGly antibodies (PTMScan Ubiquitin Remnant Motif (K-ε-GG) Kit). The optimal enrichment condition uses 1 mg of peptide material with 31.25 μg of antibody.
Mass Spectrometry Analysis: Enriched diGly peptides are analyzed using DIA methods on Orbitrap mass spectrometers with optimized settings.
DIA-NN Computational Workflow
The DIA-NN software suite implements a sophisticated computational workflow that leverages deep learning for enhanced performance [75]:
Library Generation: DIA-NN begins with a peptide-centric approach based on a collection of precursor ions, which can be provided as a spectral library or automatically generated in silico from a protein sequence database (library-free mode) [76] [75].
Decoy Generation: The software generates a library of decoy precursors as negative controls [75].
Chromatogram Extraction: DIA-NN extracts chromatograms for each target and decoy precursor, identifying putative elution peaks comprised of precursor and fragment ion elution profiles [75].
Peak Scoring: Each elution peak is described by 73 distinct scores reflecting peak characteristics, including co-elution of fragment ions, mass accuracy, and similarity between observed and reference spectra [75].
Neural Network Processing: An ensemble of feed-forward fully-connected deep neural networks (with 5 tanh-activated hidden layers and a softmax output layer) is trained to distinguish between target and decoy precursors using the peak scores as input [75].
Interference Correction: DIA-NN implements an algorithm for detection and removal of interferences from tandem-MS spectra by selecting the least-affected fragment as representative of the true elution profile and subtracting interferences from other fragments [75].
Statistical Validation: The software calculates q-values using discriminant scores derived from neural network outputs to assign statistical significance to identifications [75].
DIA-NN Computational Workflow
DIA Method Optimization for Ubiquitination Sites
The unique characteristics of diGly peptides require specific optimization of DIA method settings [48]:
Window Layout Optimization: Guided by empirical precursor distributions, DIA window widths are optimized to account for longer peptides with higher charge states resulting from impeded C-terminal cleavage of modified lysine residues.
Scan Settings: Methods with relatively high MS2 resolution (30,000) and 46 precursor isolation windows have been found optimal for diGly peptide analysis.
Sample Loading: Only 25% of the total enriched diGly peptide material needs to be injected due to the improved sensitivity of DIA.
Library Strategies: Hybrid spectral libraries generated by merging DDA libraries with direct DIA searches yield the highest number of diGly site identifications (approximately 35,000 in single measurements).
Successful implementation of DIA-NN for ubiquitination site analysis requires specific reagents and computational resources. The following table details essential components of the experimental workflow:
Table 3: Essential Research Reagents and Resources for DIA Ubiquitinome Analysis
| Category | Item | Specification/Function | Application in Workflow |
|---|---|---|---|
| Biological Reagents | Cell Lines | HEK293, U2OS, or other relevant models | Source of ubiquitinated proteins for analysis [48] |
| Proteasome Inhibitor | MG132 (10 μM, 4h treatment) | Increases ubiquitinated protein levels by blocking degradation [48] | |
| Anti-diGly Antibody | PTMScan Ubiquitin Remnant Motif (K-ε-GG) Kit | Immunoaffinity enrichment of diGly-modified peptides [48] | |
| Chromatography | Basic Reversed-Phase Columns | For high-pH fractionation of peptides | Reduces sample complexity and increases coverage [48] |
| Computational Resources | DIA-NN Software | Version 2.3.0 (academic) or Enterprise | Primary data analysis tool [76] |
| Spectral Libraries | Custom-built from cell lines of interest (>90,000 diGly peptides) | Reference for peptide identification [48] | |
| Protein Sequence Databases | UniProt format FASTA files | For library-free search or library generation [76] | |
| Mass Spectrometry | High-Resolution Instrument | Orbitrap, timsTOF, or TripleTOF systems | DIA data acquisition with optimized settings for diGly peptides [74] [48] |
Experimental Workflow for Ubiquitinome Analysis
DIA-NN represents a significant advancement in DIA proteomics data analysis, particularly for challenging applications like ubiquitination site mapping. The integration of deep neural networks enables superior identification performance and quantification accuracy compared to traditional algorithms, especially when processing complex datasets with high interference or using fast chromatographic methods.
For ubiquitinome research, the combination of optimized diGly peptide enrichment protocols with DIA-NN analysis has demonstrated remarkable improvements in coverage and reproducibility, approximately doubling the number of quantifiable ubiquitination sites compared to DDA methods. While commercial alternatives like Spectronaut remain competitive, DIA-NN offers academic researchers a high-performance, cost-effective solution that continues to evolve with the growing demands of proteomics research.
The future of DIA data analysis appears poised to incorporate more machine learning approaches, with platforms like Koina emerging to democratize access to specialized models for predicting peptide properties [78]. As these tools become more accessible and integrated into standardized workflows, researchers will be better equipped to tackle the complexity of ubiquitin signaling and other post-translational modification networks at a systems level.
False Discovery Control and Validation Strategies for High-Confidence Identification
Protein ubiquitination, the covalent attachment of a small regulatory protein to substrate proteins, represents a crucial post-translational modification (PTM) governing virtually all aspects of cellular function in eukaryotic organisms [11] [10]. This modification regulates diverse cellular processes including protein degradation, DNA repair, transcription, intracellular trafficking, and cell signaling [11]. The identification of ubiquitination sites (Ubi-sites) with high confidence presents substantial analytical challenges due to the low stoichiometry of modification, the transient nature of the modification, the complexity of ubiquitin chain architectures, and the presence of isopeptide bonds that complicate mass spectrometric analysis [11].
High-throughput mass spectrometry (MS) has emerged as the predominant method for large-scale ubiquitination profiling, yet it generates complex datasets requiring sophisticated computational analysis and stringent validation [11] [10]. Without proper false discovery control, researchers risk both false positive identifications that misdirect research efforts and false negatives that obscure biologically significant modifications. This comparison guide objectively evaluates current strategies and tools for ubiquitination site identification, focusing specifically on their approaches to false discovery control and validation, thereby providing researchers with a framework for selecting appropriate methodologies based on their specific experimental needs and desired confidence levels.
Experimental Methodologies for Ubiquitination Site Identification
Mass Spectrometry-Based Workflows
Conventional experimental approaches for ubiquitination site identification traditionally relied on immunoblotting with anti-ubiquitin antibodies, followed by mutagenesis of putative ubiquitinated lysine residues [11]. While useful for validating individual proteins, this method is time-consuming and low-throughput, limiting its application in proteome-wide profiling [11]. Modern MS-based proteomics has dramatically expanded our capacity to identify ubiquitination sites through several enrichment strategies:
Ubiquitin Tagging-Based Approaches: These methods involve expressing ubiquitin containing affinity tags (such as His, Flag, or Strep tags) in living cells. Following purification using commercially available resins (Ni-NTA for His tag and Strep-Tactin for Strep-tag), ubiquitinated proteins are identified through MS analysis [11]. A key advantage is the detection of ubiquitination sites through the characteristic 114.04 Da mass shift on modified lysine residues [11]. While cost-effective and relatively straightforward, these approaches may co-purify non-ubiquitinated proteins (e.g., histidine-rich or endogenously biotinylated proteins) and potentially generate artifacts as tagged ubiquitin may not completely mimic endogenous ubiquitin behavior [11].
Antibody-Based Enrichment: This strategy utilizes anti-ubiquitin antibodies (such as P4D1, FK1/FK2) to enrich endogenously ubiquitinated substrates without genetic manipulation [11]. Linkage-specific antibodies are also available for enriching ubiquitinated proteins with specific chain linkages (M1-, K11-, K27-, K48-, K63-linkage), providing additional layer of specificity [11]. Although applicable to animal tissues or clinical samples, this method suffers from high antibody costs and potential non-specific binding [11].
Ubiquitin-Binding Domain (UBD)-Based Approaches: Proteins containing UBDs (such as some E3 ubiquitin ligases, deubiquitinases, and ubiquitin receptors) can recognize and enrich endogenously ubiquitinated proteins [11] [6]. To overcome the low affinity of single UBDs, researchers have engineered tandem-repeated UBDs, such as the GST-qUBA reagent consisting of four tandem repeats of ubiquitin-associated domain from UBQLN1 fused to a GST tag [6]. This approach enabled the identification of 294 endogenous ubiquitination sites on 223 proteins from human 293T cells without proteasome inhibitors or ubiquitin overexpression [6].
The following diagram illustrates a generalized experimental workflow for ubiquitination site identification using mass spectrometry:
Computational Prediction Tools
Traditional experimental methods for ubiquitination site identification remain costly and time-consuming, driving the development of computational prediction tools [10]. These tools primarily employ machine learning (ML) and deep learning (DL) algorithms trained on experimentally verified ubiquitination sites:
Feature-Based Conventional ML: Early approaches like UbiPred utilized random forest classifiers with sequence and structural-based features, achieving approximately 72% accuracy [10]. Other methods employed support vector machines (SVM) with physicochemical properties or composition of k-spaced amino acid pairs [24] [10].
Deep Learning Approaches: More recent tools leverage advanced neural network architectures. DeepUbi employs convolutional neural networks (CNN) with multiple sequence features and achieves a 0.99 area under the curve (AUC) [10]. DeepTL-Ubi uses transfer learning for cross-species prediction [10].
Next-Generation Predictors: The most recent tools incorporate innovative architectures. Ubigo-X (2025) combines three sub-models (Single-Type SBF, Co-Type SBF, and S-FBF) via weighted voting, transforming protein sequence features into image formats for enhanced CNN-based learning [24]. EUP (2025) leverages a pretrained protein language model (ESM2) with conditional variational inference, demonstrating superior cross-species performance [61].
Comparative Analysis of Ubiquitination Site Identification Tools
Performance Metrics and Validation Approaches
Table 1: Performance comparison of computational prediction tools
| Tool | Year | Algorithm | Key Features | Reported Accuracy | False Discovery Control |
|---|---|---|---|---|---|
| Ubigo-X [24] | 2025 | Ensemble CNN with weighted voting | Image-transformed sequence features, structure-based features | 0.79 (balanced), 0.85 (imbalanced) | Independent testing on PhosphoSitePlus data |
| EUP [61] | 2025 | ESM2 protein language model with cVAE | Pretrained protein language model, cross-species prediction | Superior cross-species performance | Conditional variational inference, data denoising protocols |
| DeepUbi [10] | 2023 | Convolutional Neural Network | One-hot encoding, physicochemical properties, CKSAAP | 0.99 AUC | Five-fold cross-validation |
| UbPred [10] | 2010 | Random Forest | Sequence and structural-based features | 72% accuracy | Five-fold cross-validation |
The performance metrics presented in scientific literature require careful interpretation, as variations in training data, testing methodologies, and evaluation criteria significantly impact reported accuracy. More recent tools generally demonstrate improved performance through advanced architectures and more comprehensive training datasets.
Experimental Validation Strategies
Table 2: Experimental validation methodologies for ubiquitination site identification
| Method | Principle | Throughput | Key Advantages | Limitations | False Discovery Control |
|---|---|---|---|---|---|
| Immunoblotting + Mutagenesis [11] | Antibody detection with site-directed mutagenesis | Low | Direct validation of specific sites | Time-consuming, low-throughput | Single-site verification |
| Ubiquitin Tagging + MS [11] | Affinity purification of tagged ubiquitin conjugates | Medium-high | Proteome-wide capability, identifies exact modification sites | Potential artifacts from tags | Target-decoy database search, FDR thresholding |
| Antibody-Based Enrichment + MS [11] [6] | Immunoaffinity purification of endogenous ubiquitinated proteins | Medium-high | Works with endogenous proteins, applicable to clinical samples | Antibody specificity issues, cost | Linkage-specific antibodies, statistical validation |
| UBD-Based Approaches + MS [6] | Affinity purification using ubiquitin-binding domains | Medium | Specific for endogenous ubiquitin signals | Optimization required for different samples | Tandem reagent design, control experiments |
Integrated Workflow for High-Confidence Identification
The most robust approach to ubiquitination site identification integrates multiple methodologies in a complementary framework. The following workflow diagram illustrates a comprehensive strategy that combines computational prediction with experimental validation and stringent false discovery control:
This integrated approach leverages the complementary strengths of different methodologies: computational tools provide candidate sites for targeted validation, mass spectrometry offers unbiased proteome-wide coverage, and multiple enrichment strategies reduce method-specific biases.
Research Reagent Solutions for Ubiquitination Studies
Table 3: Essential research reagents for ubiquitination site identification
| Reagent Category | Specific Examples | Function/Application | Considerations |
|---|---|---|---|
| Affinity Tags [11] | 6× His-tagged Ub, Strep-tagged Ub | Purification of ubiquitinated proteins | Potential structural perturbation, co-purification of non-target proteins |
| Antibodies [11] | P4D1, FK1/FK2 (pan-specific), Linkage-specific antibodies | Enrichment and detection of ubiquitinated proteins | Specificity validation required, high cost, batch-to-batch variability |
| Ubiquitin-Binding Domains [6] | GST-qUBA (tandem UBA domains) | Enrichment of endogenous ubiquitinated proteins | Engineering required for sufficient affinity, specificity profiling needed |
| Enzymes [79] | E1 (UBA1), E2 (UBE2L3, UBE2D3), E3 (HUWE1) | In vitro ubiquitination assays | Specificity and activity validation required |
| Mass Spec Standards | SILAC, TMT | Quantitative proteomics, normalization | Incorporation efficiency, cost, computational analysis complexity |
The field of ubiquitination research continues to evolve with emerging methodologies offering improved accuracy and specificity. Recent innovations include the expansion of ubiquitination beyond protein substrates to non-protein molecules [79] and the development of increasingly sophisticated computational predictors that leverage protein language models and ensemble approaches [24] [61]. For researchers seeking high-confidence identification of ubiquitination sites, we recommend adopting a multi-layered validation strategy that integrates orthogonal methods, applies stringent false discovery controls at multiple stages, and utilizes updated computational tools trained on comprehensive datasets. This approach maximizes confidence while providing a framework for interpreting discrepancies that inevitably arise between different methodologies.
Benchmarking Performance and Validation Frameworks
Evaluating the performance of classification algorithms is a critical step in bioinformatics research, particularly in specialized fields like the prediction of ubiquitination sites. The choice of evaluation metric can profoundly influence the perceived effectiveness of a model and, consequently, the biological insights derived from it. This guide provides a comparative analysis of four standardized evaluation metrics—AUC, Accuracy, MCC, and F1-Score—framed within the context of developing and validating database search algorithms for ubiquitination sites. We aim to equip researchers and drug development professionals with the knowledge to select the most appropriate metrics for their specific experimental setups, ensuring robust and clinically relevant model assessments.
Metric Definitions and Mathematical Foundations
The Confusion Matrix
All classification metrics originate from the confusion matrix, a table that summarizes the outcomes of a predictive model [80] [81]. For binary classification, such as distinguishing ubiquitinated from non-ubiquitinated sites, the matrix is a 2x2 structure based on four fundamental values:
- True Positives (TP): Ubiquitination sites correctly predicted as ubiquitinated.
- False Positives (FP): Non-ubiquitination sites incorrectly predicted as ubiquitinated.
- True Negatives (TN): Non-ubiquitination sites correctly predicted as non-ubiquitinated.
- False Negatives (FN): Ubiquitination sites incorrectly predicted as non-ubiquitinated.
Metric Formulas
The following metrics are calculated from the confusion matrix [80] [81] [82]:
- Accuracy: Measures the overall proportion of correct predictions. ( \text{Accuracy} = \frac{TP + TN}{TP + TN + FP + FN} )
- Precision: Measures the reliability of positive predictions. ( \text{Precision} = \frac{TP}{TP + FP} )
- Recall (Sensitivity or True Positive Rate): Measures the ability to identify all actual positive instances. ( \text{Recall} = \frac{TP}{TP + FN} )
- F1-Score: The harmonic mean of precision and recall. ( \text{F1-Score} = 2 \times \frac{\text{Precision} \times \text{Recall}}{\text{Precision} + \Recall} )
- Matthews Correlation Coefficient (MCC): A correlation coefficient between the observed and predicted binary classifications. ( \text{MCC} = \frac{TP \times TN - FP \times FN}{\sqrt{(TP+FP)(TP+FN)(TN+FP)(TN+FN)}} )
- AUC-ROC: The Area Under the Receiver Operating Characteristic curve plots the True Positive Rate (Recall) against the False Positive Rate at all classification thresholds [83] [84] [85].
Comparative Analysis of Metrics
Characteristics and Best Use Cases
The table below summarizes the key characteristics, strengths, and weaknesses of each metric, providing a guide for their application in ubiquitination site prediction.
| Metric | Key Characteristic | Handling Class Imbalance | Best Use Case in Ubiquitination Research | Primary Limitation |
|---|---|---|---|---|
| AUC-ROC [83] [85] | Measures model's ranking ability across all thresholds; threshold-independent. | Good, but can be optimistic with high imbalance [83] [86]. | Comparing overall discriminatory power of different algorithms before setting a final threshold. | Does not reflect a single operational point; can be misleading with severe imbalance [83] [87]. |
| Accuracy [83] [81] [82] | Proportion of total correct predictions; simple to interpret. | Poor; highly misleading on imbalanced datasets (e.g., where non-sites vastly outnumber sites) [80] [86] [82]. | Initial, coarse-grained evaluation only when the dataset of protein sequences is perfectly balanced. | Provides a false sense of high performance on imbalanced datasets common in biology. |
| MCC [86] | Correlation coefficient between observed and predicted labels; considers all four confusion matrix categories. | Excellent; produces a reliable and truthful score even on imbalanced data [86]. | The preferred metric for a single, comprehensive evaluation of model performance on an imbalanced test set. | Less intuitive for non-technical stakeholders; formula is more complex. |
| F1-Score [83] [80] [81] | Harmonic mean of precision and recall; focuses on positive class performance. | Good; more robust than accuracy for imbalanced data [80] [81]. | When the cost of both false positives (mis-predicted sites) and false negatives (missed sites) is important and needs to be balanced. | Ignores the true negatives, which can be a critical shortcoming in some applications [86]. |
Quantitative Comparison in a Simulated Use Case
Consider a benchmark experiment evaluating a novel ubiquitination site prediction algorithm against a established method. The test set is imbalanced, containing 1000 peptide sequences, with only 5% (50 samples) being confirmed ubiquitination sites (positive class). The following table illustrates how different metrics can tell different stories.
| Model | TP | FP | TN | FN | Accuracy | F1-Score | MCC | ROC-AUC |
|---|---|---|---|---|---|---|---|---|
| Model A | 40 | 30 | 920 | 10 | 0.960 | 0.696 | 0.691 | 0.95 |
| Model B | 30 | 5 | 945 | 20 | 0.975 | 0.706 | 0.702 | 0.91 |
| Random Guessing | ~25 | ~475 | ~475 | ~25 | ~0.50 | ~0.09 | ~0.00 | ~0.50 |
Analysis:
- Accuracy is misleadingly high for both models due to the class imbalance, and it incorrectly suggests Model B is superior.
- F1-Score and MCC provide a more realistic comparison. While their values are close in this example, MCC is generally considered more informative because it incorporates all four confusion matrix categories (TP, FP, TN, FN), providing a more balanced view, especially when the classes are of unequal size [86].
- ROC-AUC shows that Model A has better overall ranking capability, but this high score might not translate directly to practical performance at a useful classification threshold [83] [87]. This highlights the importance of also examining the Precision-Recall AUC (PR-AUC) for imbalanced problems, which focuses on the positive class [83].
Experimental Protocols for Metric Evaluation
To ensure the fair and reproducible evaluation of database search algorithms, the following experimental protocol is recommended.
Dataset Curation and Partitioning
- Data Source: Utilize publicly available ubiquitination databases such as dbPTM or UniProt to curate a high-confidence set of experimentally validated ubiquitination sites (positive class) and non-ubiquitinated sites (negative class) [88].
- Sequence Preprocessing: Extract fixed-length peptide windows centered on the ubiquitination site (e.g., Lysine residue). Apply careful homology reduction to remove redundant sequences and prevent over-inflation of performance metrics.
- Data Partitioning: Implement a strict hold-out validation or nested cross-validation strategy. Partition the data into training, validation (for parameter tuning), and a completely held-out test set. The test set must reflect the expected real-world class imbalance.
Model Training and Evaluation Workflow
The following diagram outlines the core experimental workflow for training and evaluating a ubiquitination site prediction algorithm.
Key Research Reagent Solutions
The table below details essential computational "reagents" and their functions in a typical ubiquitination site prediction pipeline.
| Research Reagent / Tool | Function in Experiment |
|---|---|
| Benchmark Dataset (e.g., from dbPTM) | Serves as the ground truth for training and testing algorithms; quality and non-redundancy are paramount. |
| Feature Extraction Library (e.g., ProPy) | Converts raw protein sequences into numerical feature vectors (e.g., amino acid composition, physicochemical properties). |
| Machine Learning Framework (e.g., Scikit-learn) | Provides implementations of classifiers (e.g., SVM, Random Forest) and evaluation metric functions. |
| Statistical Analysis Software (e.g., R, SciPy) | Used for performing significance tests (e.g., paired t-test) to determine if performance differences between models are statistically significant. |
Selecting the right evaluation metric is not a one-size-fits-all endeavor but a critical decision that must align with the research goals and dataset properties. For ubiquitination site prediction, where imbalanced data is the norm, relying on Accuracy is ill-advised. The F1-Score is a strong candidate when the focus is squarely on the positive class and a balance between precision and recall is desired. However, the Matthews Correlation Coefficient (MCC) often emerges as the most robust and informative single metric for a comprehensive assessment, as it accounts for all aspects of the confusion matrix and is reliable for imbalanced datasets. AUC-ROC remains valuable for evaluating a model's overall ranking capability. A robust evaluation strategy should involve reporting multiple metrics, with MCC and PR-AUC being particularly emphasized, to provide a holistic and truthful picture of algorithm performance and drive meaningful progress in the field.
Within the field of proteomics and post-translational modification (PTM) research, the precise identification of ubiquitination sites is a critical yet challenging task. Protein ubiquitination, the process whereby a ubiquitin protein attaches to a lysine residue on a target protein, serves as a vital regulator of diverse cellular functions including protein degradation, signal transduction, and DNA repair [24] [89]. Experimental identification of these sites through mass spectrometry-based methods, while effective, is often costly and time-consuming [24] [10]. This has spurred the development of computational tools designed to predict ubiquitination sites from protein sequence and structural features.
This guide provides a comparative analysis of three advanced prediction tools: Ubigo-X, DeepUni, and DeepTL-Ubi. Framed within a broader thesis on evaluating database search algorithms for ubiquitination research, we objectively assess their performance metrics, underlying methodologies, and practical applicability for researchers, scientists, and drug development professionals.
The predictive performance of any computational tool is fundamentally rooted in its design, the data it was trained on, and the algorithms it employs. Below, we detail the core methodologies for each tool.
Ubigo-X: Ensemble Learning with Image-Based Features
Ubigo-X represents a novel approach that integrates multiple feature representations and model architectures through an ensemble strategy [27] [24]. Its methodology can be broken down into several key stages:
- Data Curation and Feature Extraction: The model was trained on a large, non-redundant dataset sourced from the Protein Lysine Modification Database (PLMD 3.0), comprising 53,338 ubiquitination and 71,399 non-ubiquitination sites after rigorous filtering [27] [24]. It extracts three distinct types of features:
- Single-Type Sequence-Based Features (SBF): Includes Amino Acid Composition (AAC), Amino Acid Index (AAindex), and one-hot encoding.
- Co-Type Sequence-Based Features (Co-Type SBF): Utilizes k-mer encoding of the Single-Type SBF features.
- Structure-Based and Function-Based Features (S-FBF): Incorporates secondary structure, relative solvent accessibility (RSA), absolute solvent-accessible area (ASA), and signal peptide cleavage sites [24].
- Model Architecture and Ensemble Strategy: The S-FBF features are trained using the XGBoost algorithm. The Single-Type SBF and Co-Type SBF features are first transformed into image-based representations and then trained using a Resnet34 deep learning model. The final prediction is generated by combining the outputs of these three sub-models via a weighted voting strategy [27] [24].
DeepUni: A Convolutional Neural Network Framework
DeepUni is a deep learning predictor based on Convolutional Neural Networks (CNNs) that was developed to handle large-scale proteome data [89].
- Feature Encoding: DeepUni employs four different feature encoding schemes from protein sequences and physicochemical properties. The best performance was achieved through a hybrid of One-Hot encoding and the Composition of k-Spaced Amino Acid Pairs (CKSAAP) [89].
- Model Training and Validation: The model was trained and evaluated using k-fold cross-validation. Its architecture consists of an embedding layer, multiple convolutional and pooling layers, fully connected layers, and an output layer. This structure allows the model to automatically learn and identify complex patterns from the input features without requiring a predefined mathematical expression [89].
DeepTL-Ubi: Leveraging Transfer Learning
DeepTL-Ubi adopts a different strategy by utilizing deep transfer learning to predict ubiquitination sites across multiple species [10].
- Core Approach: The model is based on a Densely Connected Convolutional Neural Network (DCCNN). Its primary strength lies in its ability to transfer knowledge from species with a large number of known ubiquitination sites to assist in prediction for species with limited sample sizes [10].
- Input Features: The model uses one-hot encoding of protein sequence fragments as its input, allowing it to learn directly from the raw sequence data [10].
Performance Comparison and Experimental Data
A critical evaluation of these tools requires a direct comparison of their performance on standardized metrics. The following table summarizes key quantitative results as reported in their respective studies.
Table 1: Comparative Performance Metrics of Ubiquitination Site Prediction Tools
| Tool | Approach | AUC | Accuracy (ACC) | MCC | Key Test Dataset |
|---|---|---|---|---|---|
| Ubigo-X | Ensemble (XGBoost + ResNet) with Weighted Voting | 0.85 (Balanced) [27] | 0.79 (Balanced) [27] | 0.58 (Balanced) [27] | PhosphoSitePlus (balanced) |
| 0.94 (Imbalanced 1:8) [27] | 0.85 (Imbalanced 1:8) [27] | 0.55 (Imbalanced 1:8) [27] | PhosphoSitePlus (imbalanced) | ||
| DeepUni | CNN with Hybrid Features (One-Hot + CKSAAP) | 0.9066 [89] | > 0.85 [89] | 0.78 [89] | 10-fold Cross-Validation |
| DeepTL-Ubi | Densely Connected CNN (DCCNN) with Transfer Learning | Information not available in search results | Information not available in search results | Information not available in search results | Multi-species data |
Analysis of Comparative Performance
- Ubigo-X demonstrates robust and consistent performance across both balanced and naturally imbalanced datasets, which are more representative of real-world scenarios. Its high AUC of 0.94 on imbalanced data underscores the efficacy of its ensemble and image-based feature representation in minimizing false positives. The tool also reportedly outperforms existing methods in terms of Matthews Correlation Coefficient (MCC) for both data types and in AUC/Accuracy for balanced data [27].
- DeepUni shows excellent performance on its benchmark dataset, achieving a high AUC and MCC. This indicates strong predictive power, likely due to its effective combination of sequence and physicochemical features processed through a CNN architecture [89].
- DeepTL-Ubi' primary advantage is its cross-species applicability. While specific performance metrics are not available in the provided search results, its use of transfer learning is a significant innovation, particularly for predicting sites in less-studied organisms where training data is scarce [10].
Successful implementation and validation of these computational tools often rely on access to key databases and software resources. The following table details essential components of the ubiquitination research toolkit.
Table 2: Key Research Reagent Solutions for Ubiquitination Site Prediction
| Resource Name | Type | Primary Function in Research | Relevance to Tools |
|---|---|---|---|
| PLMD (Protein Lysine Modification Database) | Database | A repository of experimentally identified protein lysine modification sites, including ubiquitination [24]. | Serves as a primary source for training and benchmark datasets (e.g., used by Ubigo-X [27] [24]). |
| PhosphoSitePlus (PSP) | Database | A comprehensive resource for post-translational modifications, encompassing a vast number of ubiquitination sites [29]. | Commonly used as an independent test set to validate prediction accuracy and generalizability (e.g., used by Ubigo-X [27]). |
| CD-HIT | Software Tool | A program for clustering biological sequences to reduce data redundancy and avoid overfitting [24]. | Used in data pre-processing to filter sequences with high similarity (e.g., used by Ubigo-X and UbiComb [27] [24] [90]). |
| AAindex (Amino Acid Index Database) | Database | A compilation of numerical indices representing various physicochemical and biochemical properties of amino acids [24]. | Used for feature engineering, transforming amino acid sequences into quantitative vectors (e.g., used by Ubigo-X [24]). |
| XGBoost | Software Library | An optimized machine learning library implementing gradient boosted decision trees. | Used as one of the classifiers within ensemble models (e.g., used for the S-FBF sub-model in Ubigo-X [27] [24]). |
The comparative analysis of Ubigo-X, DeepUni, and DeepTL-Ubi reveals a dynamic landscape in ubiquitination site prediction, where different tools excel based on specific research needs. Ubigo-X stands out for its state-of-the-art performance on independent test sets and its robustness to dataset imbalance, making it a strong general-purpose predictor. DeepUni has demonstrated high accuracy on its benchmark data, showcasing the power of CNNs in this domain. DeepTL-Ubi offers a unique and valuable approach for multi-species prediction through transfer learning, addressing a critical challenge in the field.
The ongoing evolution of these tools is fueled by the creation of larger, higher-quality training datasets, such as PTMAtlas [29], and the adoption of more sophisticated deep learning architectures. For researchers, the choice of tool should be guided by the specific research context—whether the priority is highest accuracy on human proteins (favoring Ubigo-X or DeepUni), prediction for non-model organisms (favoring DeepTL-Ubi), or access to a user-friendly web server. As these computational methods continue to mature, they will become increasingly indispensable for accelerating discovery in fundamental biology and drug development.
Independent Testing and Cross-Validation Methodologies
In the field of bioinformatics, particularly for predicting protein ubiquitination sites, the development of robust machine learning models is crucial for advancing research. However, the true value of these models is determined not by their performance on training data, but by their ability to generalize to new, unseen data. Independent testing and cross-validation methodologies provide the statistical framework necessary to reliably estimate this generalization performance, allowing researchers to compare different algorithms objectively. These techniques help prevent overoptimism in overfitted models and mitigate biases associated with hyperparameter tuning and algorithm selection [91].
The challenge is particularly acute in ubiquitination site prediction, where models must handle highly imbalanced datasets, with non-ubiquitination sites vastly outnumbering ubiquitination sites, and maintain accuracy across diverse species. This article provides a comprehensive comparison of contemporary ubiquitination prediction tools, with a specific focus on their evaluation methodologies and performance metrics, to guide researchers, scientists, and drug development professionals in selecting appropriate tools for their work.
Core Principles of Model Validation
The Problem of Overfitting
Machine learning models, especially complex deep neural networks, are susceptible to overfitting, which occurs when an algorithm learns to make predictions based on features specific to the training dataset that do not generalize to new data. Consequently, the accuracy of a model's predictions on its training data is not a reliable indicator of its future performance. To avoid being misled by an overfitted model, performance must be measured on data independent of the training data [91].
Cross-Validation Fundamentals
Cross-validation (CV) is a set of data sampling methods used to avoid overoptimism in overfitted models. In CV, a dataset is partitioned multiple times into independent cohorts for training and testing. The model is trained and evaluated with each set of partitions, and the prediction error is averaged over the rounds. This process ensures that performance measurements are not biased by direct overfitting of the model to the data [91].
CV serves three main purposes in algorithm development: (1) estimating an algorithm's generalization performance, (2) selecting the best algorithm from several candidates, and (3) tuning model hyperparameters. The most appropriate CV approach for a given project depends on the intended task, dataset size, and model size [91].
Independent Testing
While cross-validation uses internal data to estimate performance, independent testing involves evaluating the final model on completely external data that was not used during any phase of model development or hyperparameter tuning. This provides the most realistic estimate of how the model will perform when deployed in real-world scenarios [27].
Prevalent Cross-Validation Strategies
Table 1: Common Cross-Validation Approaches and Their Characteristics
| Method | Description | Advantages | Disadvantages | Recommended Scenario |
|---|---|---|---|---|
| One-Time Split (Holdout) | Dataset randomly split into training and test sets once | Simple to implement; produces single model | Test set may be non-representative; susceptible to tuning to test set | Very large datasets |
| K-Fold CV | Dataset partitioned into k disjoint folds; each fold serves as test set once | More reliable performance estimation; uses data efficiently | Computationally intensive; requires careful partitioning | Medium-sized datasets; standard practice with k=5 or k=10 |
| Stratified K-Fold | Preserves class distribution in each fold | Better for imbalanced data | More complex implementation | Classification with imbalanced classes |
| Nested CV | Outer loop for performance estimation, inner loop for hyperparameter tuning | Provides unbiased performance estimation | Computationally very intensive | Small to medium datasets with hyperparameter tuning |
Special Considerations for Biological Data
When working with protein sequences and ubiquitination data, several specialized considerations apply to cross-validation. First, partitions should be created at the protein level rather than the site level to prevent information leakage, as multiple sites from the same protein are not independent. Additionally, sequence homology between proteins in training and test sets can lead to artificially inflated performance, making homology-based splitting essential for realistic performance estimation [61].
Comparative Analysis of Ubiquitination Prediction Tools
Recent advances in ubiquitination site prediction have yielded several sophisticated tools employing diverse machine learning approaches:
Ubigo-X utilizes an ensemble learning approach with image-based feature representation and weighted voting. It develops three sub-models: Single-Type sequence-based features, k-mer sequence-based features, and structure-based/function-based features. These are combined via a weighted voting strategy for final prediction [27].
EUP (ESM2-based Ubiquitination Prediction) employs a pretrained protein language model (ESM2) to extract features from amino acid sequences, then uses conditional variational inference to reduce these features to a lower-dimensional latent representation. This approach captures information related to biological structure, function, and evolutionary relationships [61].
Performance Comparison
Table 2: Performance Comparison of Ubiquitination Prediction Tools on Independent Test Sets
| Tool | AUC | Accuracy | MCC | Test Dataset | Class Ratio |
|---|---|---|---|---|---|
| Ubigo-X | 0.85 | 0.79 | 0.58 | PhosphoSitePlus (filtered) | Balanced |
| Ubigo-X | 0.94 | 0.85 | 0.55 | PhosphoSitePlus (filtered) | 1:8 (Imbalanced) |
| Ubigo-X | 0.81 | 0.59 | 0.27 | GPS-Uber data | Not specified |
| EUP | Superior performance reported | Across multiple species | Independent test from GPS-Uber | Strict de-homology applied |
The comparison reveals that Ubigo-X demonstrates strong performance on balanced datasets, with an AUC of 0.85 and MCC of 0.58 on filtered PhosphoSitePlus data. However, its performance drops significantly on GPS-Uber data (MCC of 0.27), highlighting the impact of dataset characteristics on tool performance. EUP reports superior cross-species performance, though specific metrics for direct comparison are not provided in the available literature [27] [61].
Cross-Species Performance
A critical challenge in ubiquitination prediction is maintaining accuracy across different species. EUP specifically addresses this challenge by training on data from multiple species, including Arabidopsis thaliana, Homo sapiens, Mus musculus, and Saccharomyces cerevisiae. The tool identifies both conserved and species-specific features contributing to ubiquitination prediction, enhancing its utility for researchers working with non-model organisms [61].
Experimental Protocols for Method Comparison
Dataset Preparation and Curation
Robust evaluation begins with meticulous dataset preparation. Both Ubigo-X and EUP utilized large-scale datasets from public databases:
- Source Databases: CPLM 4.0, PhosphoSitePlus, and UniProt were used as primary data sources [27] [61].
- Data Filtering: Sequences were filtered using CD-HIT and CD-HIT-2d to remove redundancy and reduce homology bias [27].
- Class Imbalance Handling: Techniques including random under-sampling of majority classes and application of the Neighbourhood Cleaning Rule were employed to address the significant imbalance between ubiquitination and non-ubiquitination sites [61].
- Data Partitioning: Standard practice involves 7:3 random splits for training and testing, with strict separation to prevent data leakage [61].
Feature Extraction Methodologies
The tools employ distinct approaches to feature extraction:
Ubigo-X uses multiple feature representations including amino acid composition, amino acid index, one-hot encoding, k-mer encoding, secondary structure, solvent accessibility, and signal peptide cleavage sites. These diverse features are transformed into image-based representations and processed using Resnet34 [27].
EUP employs the ESM2 protein language model to extract contextualized features for each lysine residue, capturing evolutionary information and structural relationships without relying on hand-engineered features [61].
Model Training and Validation Workflows
Performance Metrics and Statistical Evaluation
Comprehensive evaluation requires multiple performance metrics, each providing different insights:
- Area Under the Curve: Measures the overall discriminative ability of the model, with values closer to 1.0 indicating better performance [27].
- Accuracy: The proportion of correct predictions among all predictions, suitable for balanced datasets but potentially misleading for imbalanced data [27].
- Matthew's Correlation Coefficient: Provides a balanced measure even with imbalanced classes, with values ranging from -1 to 1, where 1 indicates perfect prediction [27].
The selection of appropriate metrics is critical, as models performing well on one metric may perform poorly on others, particularly with imbalanced datasets common in ubiquitination prediction.
The Researcher's Toolkit
Table 3: Essential Resources for Ubiquitination Prediction Research
| Resource Category | Specific Tools/Databases | Purpose and Function | Access Information |
|---|---|---|---|
| Ubiquitination Databases | CPLM 4.0, PhosphoSitePlus | Source of experimentally verified ubiquitination sites for training and testing | Publicly accessible online |
| Protein Sequence Databases | UniProt | Provides protein sequences corresponding to modification sites | Publicly accessible online |
| Sequence Analysis Tools | CD-HIT, CD-HIT-2d | Filtering sequences to reduce redundancy and homology bias | Open-source tools |
| Feature Extraction | ESM2 models, AAindex | Generating numerical representations of protein sequences | Publicly available |
| Implementation Frameworks | Python with PyTorch/TensorFlow | Developing and training deep learning models | Open-source |
| Prediction Tools | Ubigo-X, EUP | Webservers for ubiquitination site prediction | Freely accessible online |
Based on our comparative analysis of independent testing and cross-validation methodologies for ubiquitination prediction tools, several best practices emerge for researchers in this field:
First, always consider multiple performance metrics, with particular attention to Matthew's Correlation Coefficient for imbalanced datasets. Second, scrutinize the cross-validation methodology employed in tool evaluations, ensuring proper separation of training and test data at the protein level rather than the site level. Third, consider cross-species performance requirements, as tools like EUP specifically address this challenge through specialized training approaches.
The field continues to evolve with the adoption of protein language models like ESM2, which show promise for capturing evolutionary information and improving generalization across species. When selecting tools for research purposes, prioritize those with transparent evaluation methodologies, accessible web interfaces, and demonstrated performance on independent test sets rather than just cross-validation results.
In the field of proteomics research, the accurate identification of protein ubiquitination sites is critical for understanding cellular regulation and developing therapeutic interventions. The evaluation of computational tools for this task relies on benchmark studies that provide fair comparisons of different search algorithms. However, the development of these benchmarks is frequently compromised by information leakage, where knowledge from the test dataset inadvertently influences the training process, leading to optimistically biased performance estimates and invalid comparisons. This article establishes a standardized framework for benchmarking database search algorithms for ubiquitination site prediction, explicitly addressing information leakage through rigorous experimental design and data handling protocols. By implementing strict separation of training and evaluation data, along with standardized assessment metrics, researchers can ensure that performance comparisons reflect true algorithmic capabilities rather than artifacts of experimental design.
The proliferation of machine learning and deep learning approaches in recent years has dramatically increased the sophistication of ubiquitination prediction tools. Models such as Ubigo-X and DeepMVP have demonstrated remarkable performance by leveraging ensemble learning strategies and high-quality training datasets [24] [29]. Simultaneously, earlier approaches utilizing support vector machines (SVM) and convolutional neural networks (CNNs) continue to provide valuable benchmarks for comparison [24] [34]. The integration of diverse feature representations—from sequence-based attributes to structural and functional characteristics—has enabled increasingly accurate identification of ubiquitination sites, but has also complicated the benchmarking process due to the potential for data contamination across training and testing phases.
Quantitative Performance Comparison of Prediction Tools
Comprehensive benchmarking requires standardized assessment across multiple tools using consistent datasets and evaluation metrics. The performance of ubiquitination prediction algorithms varies significantly based on their architectural approaches, feature extraction methods, and training data quality. The table below summarizes the quantitative performance of prominent tools when evaluated on different testing datasets, providing a clear basis for comparison.
Table 1: Performance Comparison of Ubiquitination Site Prediction Tools
| Tool | Approach | Testing Dataset | AUC | Accuracy | MCC |
|---|---|---|---|---|---|
| Ubigo-X | Ensemble of 3 sub-models with weighted voting | Balanced PhosphoSitePlus | 0.85 | 0.79 | 0.58 |
| Ubigo-X | Ensemble of 3 sub-models with weighted voting | Imbalanced PhosphoSitePlus (1:8 ratio) | 0.94 | 0.85 | 0.55 |
| Ubigo-X | Ensemble of 3 sub-models with weighted voting | GPS-Uber | 0.81 | 0.59 | 0.27 |
| DeepMVP | CNN + Bidirectional GRU ensemble | PTMAtlas (systematically reprocessed data) | Substantially outperforms existing tools across all 6 PTM types | - | - |
| Method from [34] | Machine Learning | Dataset-I | - | 1.00 | - |
| Method from [34] | Machine Learning | Dataset-II | - | 0.9988 | - |
| Method from [34] | Machine Learning | Dataset-III | - | 0.9984 | - |
The performance metrics reveal several critical patterns. First, the testing dataset composition dramatically influences reported performance, as evidenced by Ubigo-X's higher AUC (0.94) on imbalanced data compared to balanced data (0.85) [24]. Second, the quality and processing of training data significantly impact model efficacy, with DeepMVP's use of systematically reprocessed mass spectrometry datasets contributing to its superior performance across multiple post-translational modification types [29]. Third, seemingly exceptional results, such as the perfect accuracy reported in [34], must be interpreted with caution, as they may indicate potential information leakage or insufficiently challenging test sets. These comparisons underscore the necessity of standardized benchmarking protocols to ensure fair evaluation across different algorithmic approaches.
Experimental Protocols for Benchmark Development
Data Collection and Curation Methodology
The foundation of any robust benchmark is carefully curated data with strict separation between training, validation, and testing sets. For ubiquitination site prediction, this process begins with comprehensive data collection from reliable sources. The Protein Lysine Modification Database (PLMD 3.0) serves as a primary source, containing extensive ubiquitination site information [24]. Initial datasets must undergo rigorous redundancy reduction to prevent homologous sequences from appearing in both training and testing partitions. The recommended protocol uses CD-HIT with a 30% sequence identity cutoff to cluster similar sequences, followed by CD-HIT-2d to filter out negative samples with greater than 40% similarity to positive samples, effectively minimizing potential data leakage [24].
For independent testing, researchers should employ separate datasets such as PhosphoSitePlus [24] [29]. The testing data must undergo identical filtering procedures to ensure compatibility while maintaining complete separation from training data. For ubiquitination site prediction benchmarks, it is essential to evaluate performance on both balanced and naturally imbalanced datasets, as real-world applications typically involve highly imbalanced class distributions. The experimental workflow should explicitly document all data processing steps, including the handling of missing sequences (often replaced with dummy amino acid 'X') and the specific version numbers of all databases used [24].
Feature Encoding and Model Architecture Protocols
Ubiquitination prediction tools employ diverse feature encoding strategies to represent protein sequences computationally. The benchmark should specify standardized input formats while allowing for algorithmic diversity in feature extraction:
- Sequence-based features: Include amino acid composition (AAC), amino acid index (AAindex) properties, one-hot encoding, and k-mer compositions [24].
- Structure-based features: Incorporate secondary structure predictions and relative solvent accessibility (RSA)/absolute solvent-accessible area (ASA) metrics [24].
- Function-based features: Integrate signal peptide cleavage sites and other functional motifs [24].
Modern approaches like Ubigo-X employ innovative strategies such as transforming sequence features into image-like formats for processing with convolutional neural networks like ResNet34 [24]. DeepMVP utilizes an ensemble of convolutional neural networks (CNNs) and bidirectional gated recurrent units (GRUs) optimized through a genetic algorithm [29]. The benchmarking protocol should require participants to document their architectural decisions thoroughly, including hyperparameter settings, training procedures, and ensemble methods. This documentation enables meaningful comparison beyond mere performance metrics and helps identify which architectural strategies are most effective for specific aspects of ubiquitination site prediction.
Validation and Testing Framework
To prevent information leakage and ensure reliable performance estimation, benchmarks must implement rigorous validation protocols. K-fold cross-validation (typically 10-fold) provides robust performance estimates while maintaining separation between training and validation data [34]. For final evaluation, a completely held-out test set that never participates in training or model selection is essential. The benchmark should mandate reporting of multiple performance metrics including area under the curve (AUC), accuracy (ACC), and Matthews correlation coefficient (MCC) to provide a comprehensive view of model capabilities [24]. The MCC is particularly valuable for imbalanced datasets as it considers all four categories of the confusion matrix.
For ubiquitination prediction specifically, benchmarks should evaluate performance on both site-level and protein-level prediction tasks. The site-level evaluation assesses accuracy in identifying specific modified lysine residues, while protein-level evaluation measures the ability to identify proteins that contain at least one ubiquitination site. This dual evaluation provides insights into the practical utility of different algorithms for various research scenarios, from detailed mechanistic studies to high-throughput proteomic screenings.
Signaling Pathways and Workflow Visualization
The experimental workflow for benchmarking ubiquitination prediction tools involves multiple stages with specific data handling procedures to prevent information leakage. The following diagram illustrates the complete pathway from data collection through model evaluation, highlighting critical control points where information leakage commonly occurs.
Diagram 1: Benchmark workflow with leakage prevention controls
The workflow emphasizes three critical control points where information leakage must be prevented: (1) during data splitting, where strict partitioning ensures no overlap between training, validation, and test sets; (2) during feature extraction, where preprocessing parameters must be derived from training data only; and (3) during hyperparameter tuning, where only validation data should guide model selection decisions. Implementing these controls ensures that final performance metrics on the test set provide unbiased estimates of model generalization capability.
Research Reagent Solutions for Ubiquitination Studies
The experimental validation of ubiquitination site predictions relies on specific research reagents and computational tools. The following table catalogues essential resources used in the development and validation of ubiquitination prediction benchmarks.
Table 2: Essential Research Reagents and Resources for Ubiquitination Studies
| Resource Name | Type | Primary Function | Relevance to Benchmarking |
|---|---|---|---|
| PLMD 3.0 | Database | Compiles protein lysine modification data from public sources | Primary source of training data; provides ubiquitination site annotations [24] |
| PhosphoSitePlus | Database | Repository of post-translational modification sites | Serves as independent test dataset for performance evaluation [24] [29] |
| PTMAtlas | Database | Curated compendium of PTM sites from reprocessed MS datasets | High-quality training resource; enables improved model performance [29] |
| CD-HIT | Software Tool | Sequence clustering and redundancy reduction | Prevents data leakage by removing similar sequences between splits [24] |
| MaxQuant | Software Tool | Mass spectrometry data analysis | Processes raw MS data to identify ubiquitination sites with FDR control [29] |
| Ubigo-X | Prediction Tool | Ubiquitination site prediction using ensemble learning | Benchmark competitor; represents state-of-the-art approach [24] |
| DeepMVP | Prediction Tool | Deep learning framework for multiple PTM predictions | Benchmark competitor; demonstrates multi-PTM capability [29] |
These resources form the foundation of reproducible ubiquitination prediction research. The databases provide standardized annotations, the software tools enable consistent data processing, and the prediction tools represent the current state of the art. Benchmarks should specify versions and access dates for all resources to ensure reproducibility. Additionally, researchers should document any preprocessing steps applied to these resources, as variations in data handling can significantly impact performance comparisons.
Discussion: Towards Robust Ubiquitination Prediction Benchmarks
The development of fair benchmarks for ubiquitination site prediction requires meticulous attention to experimental design, with particular emphasis on preventing information leakage. The framework presented in this article addresses this challenge through strict data partitioning, standardized evaluation metrics, and comprehensive documentation requirements. By implementing these protocols, researchers can ensure that performance comparisons genuinely reflect algorithmic capabilities rather than artifacts of experimental design.
Future benchmark development should address several emerging challenges in the field. First, the integration of multi-modal data sources—including structural information, protein-protein interaction networks, and functional annotations—will require sophisticated methods to prevent leakage across modalities. Second, the development of specialized benchmarks for specific biological contexts, such as cell-type-specific ubiquitination or disease-associated modifications, will enable more targeted algorithm development. Finally, the establishment of continuous evaluation platforms that maintain strict separation between public training data and sequestered test data will provide ongoing assessment of algorithmic advances without the risk of overfitting to static test sets.
As ubiquitination research continues to evolve, maintaining rigorous benchmarking standards will be essential for translating computational predictions into biological insights and therapeutic applications. The framework outlined here provides a foundation for these efforts, enabling fair comparison of diverse algorithmic approaches while safeguarding against the confounding effects of information leakage.
Species-Neutral Prediction vs. Organism-Specific Model Performance
The accurate prediction of ubiquitination sites is a critical challenge in proteomics and biomedical research. The scientific community has developed two primary computational strategies to address this: species-neutral models trained on data from multiple organisms to identify general patterns, and organism-specific models tailored to the unique biological and sequence characteristics of individual species. This guide provides an objective comparison of these approaches, evaluating their performance, underlying methodologies, and ideal application scenarios to assist researchers in selecting the most appropriate tool for their experimental needs.
Methodology and Technical Approaches
Species-Neutral Prediction Models
Species-neutral predictors aim to identify universal ubiquitination signals across evolutionary boundaries.
Ubigo-X employs an ensemble learning architecture that integrates three distinct sub-models through a weighted voting strategy [27] [24]:
- Single-Type SBF: Uses amino acid composition (AAC), amino acid index (AAindex), and one-hot encoding of sequence fragments.
- Co-Type SBF: Applies k-mer encoding to the Single-Type SBF features.
- S-FBF: Incorporates structural and functional features, including secondary structure, relative solvent accessibility (RSA), absolute solvent-accessible area (ASA), and signal peptide cleavage sites, trained with XGBoost.
The sequence-based features are transformed into image-based representations and processed using a Resnet34 deep learning architecture, enabling the capture of complex spatial patterns in the data [24].
EUP utilizes a fundamentally different approach based on the ESM2 protein language model, which captures evolutionary information from massive protein sequence databases [28]. The model employs a conditional variational autoencoder (cVAE) to reduce the high-dimensional ESM2 features into a lower-dimensional latent representation, upon which downstream prediction models are built. This architecture is particularly effective for cross-species generalization with limited labeled data [28].
Organism-Specific Prediction Models
Organism-specific models address the biological reality that ubiquitination mechanisms and sequence patterns can vary significantly between species.
SSUbi is designed explicitly for species with limited training data. It integrates both protein sequence and structural information using a capsule network framework [44]. The model consists of:
- A feature extraction module with two sub-modules that process sequence and structural information separately.
- Convolutional operations to extract encoding dimension features.
- A channel attention mechanism to extract feature map dimension features.
- A species-specific capsule network that converts integrated features into capsule vectors for final classification [44].
The model explicitly addresses species-specific sequence variations, as shown in the analysis of eight different species, where significant differences in amino acid enrichment around ubiquitination sites were observed [44].
Performance Comparison and Experimental Data
Quantitative Performance Metrics
The following table summarizes the performance of various species-neutral and organism-specific models under different testing conditions:
Table 1: Comparative Performance of Ubiquitination Site Prediction Tools
| Model | Model Type | Test Dataset | AUC | Accuracy | MCC | Key Strengths |
|---|---|---|---|---|---|---|
| Ubigo-X [27] [24] | Species-Neutral | Balanced PhosphoSitePlus (1:1) | 0.85 | 0.79 | 0.58 | Excellent balanced performance |
| Imbalanced PhosphoSitePlus (1:8) | 0.94 | 0.85 | 0.55 | Robust to class imbalance | ||
| GPS-Uber Data | 0.81 | 0.59 | 0.27 | Good cross-dataset generalization | ||
| EUP [28] | Species-Neutral | Multi-species CPLM 4.0 | Species-dependent | - | - | Cross-species generalization, Low inference latency |
| SSUbi [44] | Species-Specific | Homo sapiens | 0.801 | 0.734 | 0.468 | Enhanced accuracy for specific species |
| Mus musculus | 0.823 | 0.754 | 0.509 | Optimized for species with small sample sizes | ||
| Saccharomyces cerevisiae | 0.834 | 0.767 | 0.534 | Effective with limited data | ||
| DeepTL-Ubi [2] | Species-Specific | Human Proteins | - | 0.820 | - | Transfer learning advantage |
| Study by PMC [2] | Species-Neutral | Human Proteins (dbPTM) | - | 0.820 | - | Hybrid feature and sequence approach |
Performance Analysis
The experimental data reveals distinct performance patterns between the two approaches. Species-neutral models like Ubigo-X demonstrate remarkable consistency across different testing scenarios, particularly maintaining high AUC (0.94) even under significantly imbalanced data conditions [27]. This robustness makes them particularly valuable for exploratory research across multiple organisms or when studying poorly characterized species.
Organism-specific models like SSUbi show enhanced performance for their target species, with consistently high AUC scores across Homo sapiens (0.801), Mus musculus (0.823), and Saccharomyces cerevisiae (0.834) [44]. This specialized approach proves particularly advantageous for species with limited training data, where the focused learning strategy outperforms more generalized models.
The EUP framework represents an advanced hybrid approach, using protein language model representations that capture both universal and species-specific patterns, enabling effective knowledge transfer while maintaining specialization capabilities [28].
Experimental Protocols and Workflows
Model Training and Validation Procedures
Data Sourcing and Preprocessing
- Primary Databases: PLMD 3.0 [27] [24], CPLM 4.0 [28], PhosphoSitePlus [27], and dbPTM [2] serve as primary data sources.
- Sequence Redundancy Reduction: CD-HIT and CD-HIT-2D are universally employed to remove sequences with >30-40% similarity, preventing overestimation from homologous sequences [27] [24] [1].
- Fragment Extraction: Protein sequences are typically segmented into fragments with lysine (K) as the central residue, using window sizes of 2n+1 (where n represents upstream/downstream flanking amino acids) [1].
Feature Engineering and Selection
- Sequence-Based Features: Amino acid composition (AAC), k-spaced amino acid pairs (CKSAAP), one-hot encoding, and pseudo-amino acid composition [24] [18].
- Evolutionary Features: Position-Specific Scoring Matrix (PSSM) generated via BLAST against Swiss-Prot [1].
- Structural Features: Secondary structure, solvent accessibility, and protein aggregation propensity [44] [24].
- Physicochemical Properties: Selected indices from AAindex database, including isoelectric point, entropy of formation, and atom-based hydrophobic moment [18] [1].
Validation Strategies
- Cross-Validation: Standard 10-fold cross-validation is commonly employed [2] [92].
- Independent Testing: Models are tested on held-out datasets not used during training [27] [44].
- Species-Specific Evaluation: Organism-specific models are validated separately for each target species [44].
Table 2: Key Research Reagents and Computational Resources for Ubiquitination Site Prediction
| Resource Category | Specific Tool/Database | Primary Function | Application Context |
|---|---|---|---|
| Ubiquitination Databases | PLMD (Protein Lysine Modification Database) | Comprehensive repository of experimentally verified ubiquitination sites | Training data source for model development [27] [44] [24] |
| CPLM 4.0 | Collection of protein lysine modifications including ubiquitination | Multi-species model training and evaluation [28] | |
| PhosphoSitePlus | PTM database including ubiquitination sites | Independent testing and validation [27] | |
| Feature Extraction Tools | CD-HIT & CD-HIT-2D | Sequence clustering and redundancy reduction | Data preprocessing to remove homologous sequences [27] [24] [1] |
| NetSurfP-3.0 | Protein secondary structure and solvent accessibility prediction | Structural feature extraction [44] | |
| AAindex Database | Repository of amino acid physicochemical properties | Feature engineering for traditional ML models [24] [18] | |
| Computational Frameworks | ESM2 (Evolutionary Scale Model) | Protein language model for feature representation | State-of-the-art sequence representation learning [28] |
| XGBoost | Gradient boosting framework | Handling structural and functional features [27] [24] | |
| ResNet34 | Deep convolutional neural network | Image-based feature learning from sequence representations [27] [24] |
The comparative analysis reveals that the choice between species-neutral and organism-specific prediction models should be guided by specific research objectives and constraints.
Species-neutral models like Ubigo-X and EUP are recommended for:
- Exploratory research across multiple species
- Studies involving poorly characterized organisms
- Scenarios with limited species-specific training data
- Applications requiring robust performance on imbalanced datasets [27] [28]
Organism-specific models like SSUbi are preferable for:
- Focused research on well-studied model organisms
- Applications demanding maximum accuracy for specific species
- Scenarios where species-specific sequence patterns significantly impact ubiquitination [44]
The emerging trend of leveraging protein language models like ESM2 suggests a promising future direction where the distinction between these approaches may blur, enabling models that automatically adapt to both universal and species-specific characteristics of ubiquitination [28].
For drug development professionals, species-neutral models offer broader screening capabilities, while organism-specific models provide enhanced accuracy for target validation in specific model systems. The selection should align with the specific stage of the drug discovery pipeline and the biological context of the target pathway.
Conclusion
The evaluation of database search algorithms for ubiquitination site prediction reveals that integrated approaches combining multiple feature types and algorithmic strategies deliver superior performance. Deep learning methods consistently outperform traditional machine learning, particularly when handling entire protein sequences and incorporating both raw sequences and hand-crafted features. The emergence of advanced mass spectrometry techniques, particularly DIA-MS with neural network processing, has dramatically improved coverage, reproducibility, and quantitative precision in experimental validation. Future directions should focus on developing standardized benchmarks for fair comparison, creating more sophisticated hybrid models that leverage both computational prediction and experimental validation, and advancing species-transferable algorithms. These improvements will accelerate drug discovery targeting the ubiquitin-proteasome system and enhance our understanding of ubiquitination in disease mechanisms, particularly in cancer and neurodegenerative disorders. The integration of robust computational prediction with high-throughput experimental validation represents the most promising path forward for comprehensive ubiquitinome mapping.
References
- 1. Large-scale prediction of protein ubiquitination using... sites [https://bmcsystbiol.biomedcentral.com/articles/10.1186/s12918-018-0628-0]
- 2. Machine learning-based approaches for ubiquitination site ... [https://pmc.ncbi.nlm.nih.gov/articles/PMC10683244/]
- 3. Identification, Analysis and Prediction of Protein Ubiquitination ... [https://pmc.ncbi.nlm.nih.gov/articles/PMC3006176/]
- 4. Multi-dimensional feature recognition model based on capsule network... [https://peerj.com/articles/14427/]
- 5. mUbiSiDa: A Comprehensive Database for Protein Ubiquitination ... [https://journals.plos.org/plosone/article?id=10.1371/journal.pone.0085744]
- 6. A Data Set of Human Endogenous Protein Ubiquitination ... [https://www.sciencedirect.com/science/article/pii/S1535947620302292]
- 7. Towards more accurate prediction of ubiquitination sites... [https://research.monash.edu/en/publications/towards-more-accurate-prediction-of-ubiquitination-sites-a-compre/]
- 8. GitHub - NctuICLab/ESA-UbiSite: ESA-UbiSite: accurate prediction of... [https://github.com/NctuICLab/ESA-UbiSite]
- 9. (PDF) Prediction of Ubiquitination Using UbiNets Sites [https://www.academia.edu/88159221/Prediction_of_Ubiquitination_Sites_Using_UbiNets]
- 10. Machine learning-based approaches for ubiquitination site ... [https://bmcbioinformatics.biomedcentral.com/articles/10.1186/s12859-023-05581-w]
- 11. Current methodologies in protein ubiquitination ... [https://pmc.ncbi.nlm.nih.gov/articles/PMC9373315/]
- 12. dbPTM in 2022: an updated database for exploring ... [https://pmc.ncbi.nlm.nih.gov/articles/PMC8728263/]
- 13. dbPTM [https://biomics.lab.nycu.edu.tw/dbPTM/]
- 14. PLMD: An updated data resource of protein lysine ... [https://www.sciencedirect.com/science/article/abs/pii/S1673852717300747]
- 15. PhosphoSitePlus® PTM Database [https://www.cellsignal.com/learn-and-support/phosphositeplus-ptm-database?srsltid=AfmBOoooR6iRqhSBARCwAHU5aURF27vnyK7n9TcI_KfP6QoYnXh7z-bI]
- 16. PhosphoSitePlus: a comprehensive resource for ... [https://pmc.ncbi.nlm.nih.gov/articles/PMC3245126/]
- 17. Studying PTMs and Disease Variants with PhosphoSitePlus [https://blog.cellsignal.com/studying-post-translationally-modified-sites-and-disease-variants-with-phosphositeplus]
- 18. Large-scale prediction of protein ubiquitination sites using a ... [https://pmc.ncbi.nlm.nih.gov/articles/PMC6249717/]
- 19. PTMNavigator: interactive visualization of differentially ... [https://www.nature.com/articles/s41467-024-55533-y]
- 20. Level Immunoaffinity Peptide Enhances Ubiquitination... Enrichment [https://pmc.ncbi.nlm.nih.gov/articles/PMC3879610/]
- 21. Tandem Mass Spectrometry (MS/MS) [https://nationalmaglab.org/user-facilities/icr/techniques/fragmentation-techniques/tandem-ms]
- 22. Tandem mass spectrometry [https://en.wikipedia.org/wiki/Tandem_mass_spectrometry]
- 23. Protocol for tandem enrichment of ubiquitinated, ... [https://www.sciencedirect.com/science/article/pii/S2666166725003508]
- 24. Ubigo-X: Protein ubiquitination site prediction using ... [https://pmc.ncbi.nlm.nih.gov/articles/PMC12303043/]
- 25. Current methodologies in protein ubiquitination characterization [https://cellandbioscience.biomedcentral.com/articles/10.1186/s13578-022-00870-y]
- 26. Global, site-resolved analysis of ubiquitylation occupancy ... [https://www.sciencedirect.com/science/article/pii/S0092867424003155]
- 27. Ubigo-X: Protein ubiquitination site prediction using ... [https://www.sciencedirect.com/science/article/pii/S2001037025002910]
- 28. EUP: Enhanced cross-species prediction of ubiquitination ... [https://journals.plos.org/ploscompbiol/article?id=10.1371/journal.pcbi.1013268]
- 29. DeepMVP: deep learning models trained on high-quality ... [https://www.nature.com/articles/s41592-025-02797-x]
- 30. New deep learning model for ubiquitination site prediction [https://www.linkedin.com/posts/iscb---international-society-for-computational-biology_httpsdoiorg101093bioadvvbaf200-activity-7383811502169837568-801a]
- 31. ResUbiNet: A Novel Deep Learning Architecture for ... [https://pmc.ncbi.nlm.nih.gov/articles/PMC12606654/]
- 32. UbiSitePred: A novel method for improving the accuracy of ... [https://www.sciencedirect.com/science/article/abs/pii/S0169743918305227]
- 33. UbNiRF: A Hybrid Framework Based on Null Importances ... [https://www.imrpress.com/journal/FBL/29/5/10.31083/j.fbl2905197/htm]
- 34. Predictive modeling for ubiquitin proteins through ... [https://www.sciencedirect.com/science/article/pii/S2405844024085487]
- 35. Identification and validation of ubiquitination-related ... [https://www.aging-us.com/article/205198/text]
- 36. A Novel Deep Learning Architecture for Ubiquitination Site ... [https://pubmed.ncbi.nlm.nih.gov/41235098/]
- 37. An optimized hybrid deep learning model to detect ... [https://www.nature.com/articles/s41598-025-14169-8]
- 38. Next-generation IIoT security: Comprehensive comparative ... [https://www.sciencedirect.com/science/article/abs/pii/S0950705125003843]
- 39. A Hybrid Deep Learning Model for Predicting Plant ... [https://pmc.ncbi.nlm.nih.gov/articles/PMC8151217/]
- 40. Computational identification of ubiquitylation sites from protein... [https://bmcbioinformatics.biomedcentral.com/articles/10.1186/1471-2105-9-310]
- 41. Computational methods for ubiquitination site prediction using ... [https://bmcbioinformatics.biomedcentral.com/articles/10.1186/s12859-016-0959-z]
- 42. Comparative Study on Feature Selection in Protein ... [https://pmc.ncbi.nlm.nih.gov/articles/PMC9578875/]
- 43. Species-specific model based on sequence and structural ... [https://pubmed.ncbi.nlm.nih.gov/39245319/]
- 44. Species-specific model based on sequence and structural ... [https://www.sciencedirect.com/science/article/abs/pii/S0022283624004017]
- 45. A protein sequence - based deep transfer... | Nature Communications [https://www.nature.com/articles/s41467-024-48446-3?error=cookies_not_supported&code=fd6c6e7f-bda4-43b4-9a50-702517b1036c]
- 46. Time-resolved in vivo ubiquitinome by profiling - DIA reveals... MS [https://www.nature.com/articles/s41467-021-25454-1?error=cookies_not_supported&code=636437d9-8baa-4ed3-a190-62aa3bba229c]
- 47. DIA-MS Ubiquitinome Analysis Services [https://www.creative-proteomics.com/ngpro/dia-ms-ubiquitinome-analysis-services.html]
- 48. Data-independent acquisition method for ubiquitinome ... [https://www.nature.com/articles/s41467-020-20509-1]
- 49. Data-independent acquisition mass spectrometry ( DIA - MS ) for... [https://pubs.rsc.org/en/content/articlehtml/2021/mo/d0mo00072h]
- 50. Data-dependent vs. Data-independent... | Technology Networks [https://www.technologynetworks.com/proteomics/lists/data-dependent-vs-data-independent-proteomic-analysis-331712]
- 51. Combining Precursor and Fragment Information for Improved Detection... [https://pmc.ncbi.nlm.nih.gov/articles/PMC7000113/]
- 52. Interrogating data-independent acquisition LC– MS / MS for affinity... [https://link.springer.com/article/10.1007/s42485-024-00166-4]
- 53. Acquisition and Analysis of DIA-Based Proteomic Data [https://pmc.ncbi.nlm.nih.gov/articles/PMC10847697/]
- 54. Analysis of DIA proteomics data using MSFragger-DIA and ... [https://www.nature.com/articles/s41467-023-39869-5]
- 55. Robust assessment of sample preparation protocols for ... [https://www.sciencedirect.com/science/article/abs/pii/S1570963924000372]
- 56. Investigating the Interaction Profile of Unconjugated Ubiquitin [https://pmc.ncbi.nlm.nih.gov/articles/PMC12447379/]
- 57. Comparing Efficiency of Lysis Buffer Solutions and Sample ... [https://www.mdpi.com/1420-3049/27/11/3390]
- 58. Evaluation of protein extraction methodologies on bacterial ... [https://pmc.ncbi.nlm.nih.gov/articles/PMC12312612/]
- 59. Unraveling chain specific ubiquitination in cells using ... [https://www.nature.com/articles/s41598-025-07242-9]
- 60. comparative evaluation of extraction protocols for HepG2 ... [https://link.springer.com/article/10.1007/s00216-025-06235-x]
- 61. EUP: Enhanced cross-species prediction of ubiquitination ... [https://pmc.ncbi.nlm.nih.gov/articles/PMC12266453/]
- 62. Class-imbalanced datasets | Machine Learning [https://developers.google.com/machine-learning/crash-course/overfitting/imbalanced-datasets]
- 63. Handling Imbalanced Data for Classification [https://www.geeksforgeeks.org/machine-learning/handling-imbalanced-data-for-classification/]
- 64. An empirical evaluation of imbalanced data strategies from ... [https://www.sciencedirect.com/science/article/abs/pii/S0957417424017305]
- 65. Establishment and validation of highly accurate formalin ... [https://www.nature.com/articles/s41598-020-68245-2]
- 66. Large-Scale Identification of Ubiquitination Sites by Mass ... [https://pmc.ncbi.nlm.nih.gov/articles/PMC4725055/]
- 67. In-Depth Comparison of Reagent-Based Digestion ... [https://pmc.ncbi.nlm.nih.gov/articles/PMC11923677/]
- 68. A Perturbed Ubiquitin Landscape Distinguishes Between ... [https://www.sciencedirect.com/science/article/pii/S1535947620302541]
- 69. Performance-weighted-voting model: An ensemble ... [https://pmc.ncbi.nlm.nih.gov/articles/PMC8320732/]
- 70. Ensemble Machine Learning to “Boost” Ubiquitination-sites ... [https://www.fortunejournals.com/articles/ensemble-machine-learning-to--ubiquitinationsites-prediction.html]
- 71. RRMSE-enhanced weighted voting regressor for improved ensemble regression | PLOS One [https://journals.plos.org/plosone/article?id=10.1371/journal.pone.0319515]
- 72. RRMSE-enhanced weighted voting regressor for improved ensemble regression - PMC [https://pmc.ncbi.nlm.nih.gov/articles/PMC11913277/]
- 73. An Optimized Weighted-Voting-Based Ensemble Learning Approach for Fake News Classification [https://www.mdpi.com/2227-7390/13/3/449]
- 74. A Comparative Analysis of Data Analysis Tools for Data ... [https://pmc.ncbi.nlm.nih.gov/articles/PMC10458344/]
- 75. DIA-NN: Neural networks and interference correction enable deep proteome coverage in high throughput - PMC [https://pmc.ncbi.nlm.nih.gov/articles/PMC6949130/]
- 76. GitHub - vdemichev/DiaNN: DIA-NN - a universal automated software suite for DIA proteomics data analysis. [https://github.com/vdemichev/DiaNN]
- 77. Choosing the Right Proteomics Data Analysis Software [https://www.metwarebio.com/proteomics-software-comparison-lc-msms-lfq-tmt-silac-dia/]
- 78. Koina: Democratizing machine learning for proteomics ... [https://www.nature.com/articles/s41467-025-64870-5]
- 79. Selective ubiquitination of drug-like small molecules by the ... [https://www.nature.com/articles/s41467-025-63442-x]
- 80. Mastering the F1 Score: A Practical Guide for Machine ... [https://www.lightly.ai/blog/f1-score]
- 81. Classification: Accuracy, recall, precision, and related metrics [https://developers.google.com/machine-learning/crash-course/classification/accuracy-precision-recall]
- 82. Evaluation Metrics in Machine Learning [https://www.geeksforgeeks.org/machine-learning/metrics-for-machine-learning-model/]
- 83. F1 Score vs ROC AUC vs Accuracy vs PR AUC: Which Evaluation Metric Should You Choose? [https://neptune.ai/blog/f1-score-accuracy-roc-auc-pr-auc]
- 84. Understanding F1 Score, Accuracy, ROC-AUC & PR- ... [https://www.deepchecks.com/f1-score-accuracy-roc-auc-and-pr-auc-metrics-for-models/]
- 85. 9 Accuracy Metrics for ML Engineers to Evaluate AI Model [https://galileo.ai/blog/accuracy-metrics-ai-evaluation]
- 86. The advantages of the Matthews correlation coefficient (MCC) over F1 score and accuracy in binary classification evaluation | BMC Genomics | Full Text [https://bmcgenomics.biomedcentral.com/articles/10.1186/s12864-019-6413-7]
- 87. class imbalance - ROC vs PR-score and imbalanced datasets - Data Science Stack Exchange [https://datascience.stackexchange.com/questions/131105/roc-vs-pr-score-and-imbalanced-datasets]
- 88. Evaluation metrics in medical imaging AI [https://www.sciencedirect.com/science/article/pii/S3050577125000283]
- 89. DeepUbi: a deep learning framework for prediction of ... [https://bmcbioinformatics.biomedcentral.com/articles/10.1186/s12859-019-2677-9]
- 90. UbiComb: A Hybrid Deep Learning Model for Predicting ... [https://www.mdpi.com/2073-4425/12/5/717]
- 91. A Guide to Cross-Validation for Artificial Intelligence in ... [https://pmc.ncbi.nlm.nih.gov/articles/PMC10388213/]
- 92. Predictive modeling for ubiquitin proteins through advanced ... [https://pmc.ncbi.nlm.nih.gov/articles/PMC11225741/]