MES vs. MOPS Buffer: A Researcher's Guide to Resolving Polyubiquitin Chains by Immunoblotting
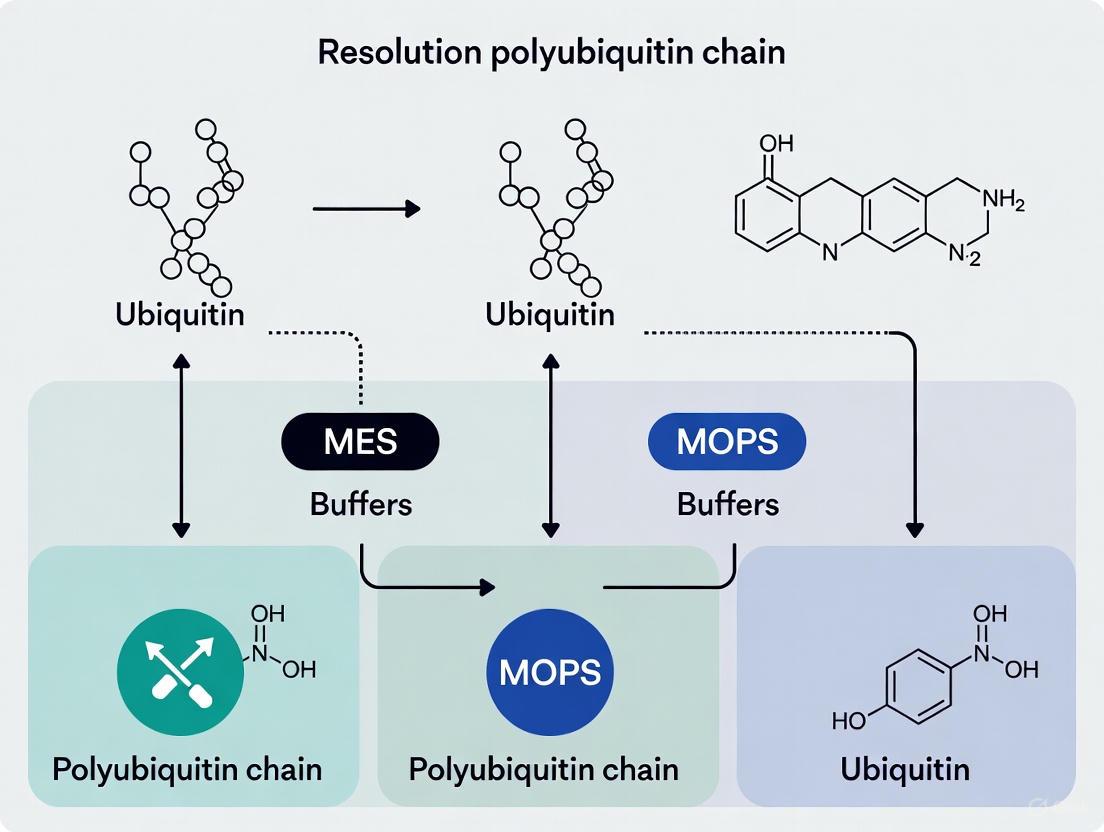
This article provides a comprehensive methodological guide for researchers and drug development professionals on leveraging MES and MOPS SDS-PAGE buffer systems to resolve polyubiquitin chains.
MES vs. MOPS Buffer: A Researcher's Guide to Resolving Polyubiquitin Chains by Immunoblotting
Abstract
This article provides a comprehensive methodological guide for researchers and drug development professionals on leveraging MES and MOPS SDS-PAGE buffer systems to resolve polyubiquitin chains. It covers the foundational principles of ubiquitin chain complexity, detailed protocols for buffer selection and application, troubleshooting for common issues like smearing, and validation strategies using linkage-specific deubiquitinases (DUBs) and mass spectrometry. The content synthesizes current best practices to enable accurate interpretation of ubiquitin signals, which is critical for understanding their roles in signaling, proteasomal degradation, and disease pathogenesis.
Understanding Polyubiquitin Chain Complexity and the Critical Role of Electrophoresis
The ubiquitin code represents one of the most sophisticated and versatile post-translational modification systems in eukaryotic cells, governing virtually all cellular processes through a complex language of covalent modifications. At its core, this system employs a 76-amino acid protein, ubiquitin, which can be conjugated to substrate proteins to alter their fate, function, or localization [1] [2]. The remarkable functional diversity of ubiquitin signaling stems from the ability of ubiquitin itself to form polymeric chains through connections between its own amino acid residues. Ubiquitin contains seven lysine residues (K6, K11, K27, K29, K33, K48, K63) and an N-terminal methionine (M1) that can each form distinct linkage types with the C-terminus of another ubiquitin molecule [1] [3]. These linkages create structurally distinct polymers that are recognized differently by cellular machinery, enabling specific biological outcomes ranging from proteasomal degradation to activation of signaling pathways [1] [2].
The complexity of the ubiquitin code extends beyond simple linkage specificity to include chain length and architecture. Ubiquitin chains can be homogenous (homotypic), containing a single linkage type, or heterogeneous (heterotypic), comprising multiple linkage types either in tandem (mixed) or with branch points where a single ubiquitin molecule is modified at two different sites (branched) [1] [4]. Furthermore, the length of ubiquitin chains adds another critical dimension to the code, with different chain lengths exhibiting distinct binding affinities for ubiquitin-binding proteins and consequently triggering different cellular responses [5]. This multi-layered regulatory system creates an extensive vocabulary of signals that allows precise control over cellular physiology, with disruptions in ubiquitin signaling implicated in numerous diseases including cancer, neurodegenerative disorders, and inflammatory conditions [1] [2].
Ubiquitin Linkage Types and Their Functions
The eight ubiquitin linkage types generate structurally distinct chains that recruit specific effector proteins, thereby directing modified substrates to particular cellular pathways. Each linkage type adopts a unique three-dimensional conformation that determines its interactions with ubiquitin-binding domains (UBDs) present in downstream effector proteins [2]. This structural specificity enables the transmission of precise biological information, transforming a simple protein modification into a sophisticated signaling system.
Table 1: Ubiquitin Linkage Types and Their Primary Cellular Functions
| Linkage Type | Structural Features | Primary Biological Functions | Key E3 Ligases |
|---|---|---|---|
| K48-linked | Compact structure | Major signal for proteasomal degradation [1] | Multiple RING and HECT E3s |
| K63-linked | Extended, open conformation | NF-κB signaling, DNA repair, endocytosis [1] [2] | TRAF6, UBC13-UEV1A |
| M1-linked (Linear) | Rigid, extended structure | NF-κB activation, inflammation, cell death [2] | LUBAC (HOIP/HOIL-1/SHARPIN) |
| K11-linked | Compact conformation | Cell cycle regulation, ER-associated degradation [1] | APC/C, UBE2S |
| K29-linked | - | Proteasomal degradation, kinase regulation [5] | UBR4, UBR5 |
| K33-linked | - | Kinase regulation, TCR signaling [5] | - |
| K27-linked | - | Mitophagy, protein secretion, autophagy [5] | - |
| K6-linked | - | DNA damage response, mitophagy [1] | Parkin, HUWE1 |
The most well-characterized ubiquitin linkages are K48 and K63, which represent the classic degradative and non-degradative signals, respectively. K48-linked chains, which account for the majority of ubiquitin conjugates in cells, predominantly target proteins for destruction by the 26S proteasome [1]. In contrast, K63-linked chains function as scaffolding elements in numerous signaling pathways, including NF-κB activation, DNA damage repair, and endocytic trafficking [1] [2]. M1-linked or linear chains, which are uniquely formed by the linear ubiquitin chain assembly complex (LUBAC), play specialized roles in regulating inflammatory signaling and cell death pathways [2]. The remaining atypical chains (K6, K11, K27, K29, K33) are less well understood but are increasingly recognized as important regulators of diverse cellular processes, with K11-linked chains playing particularly important roles in cell cycle regulation [1].
Recent research has revealed that branched ubiquitin chains, in which a single ubiquitin molecule is modified at two different sites, represent a distinct class of ubiquitin signals with unique functions. For example, K11/K48-branched chains synthesized by the APC/C regulator during mitosis enhance substrate degradation by the proteasome [1] [4]. Similarly, K48/K63-branched chains formed through collaboration between TRAF6 and HUWE1 during NF-κB signaling stabilize K63 linkages and facilitate proteasomal degradation of K63-modified substrates [1] [6]. K29/K48-branched chains promote efficient degradation of ubiquitin fusion degradation (UFD) substrates in yeast [6]. These branched chains exhibit properties distinct from their homotypic counterparts, including altered susceptibility to deubiquitinating enzymes (DUBs) and unique interactions with ubiquitin-binding proteins, enabling them to transmit biological information not encoded by simple homotypic chains [1] [4].
The Significance of Ubiquitin Chain Length
While ubiquitin linkage type determines the qualitative nature of the ubiquitin signal, chain length provides a quantitative dimension that further modulates downstream responses. The length of a ubiquitin chain influences its affinity for ubiquitin-binding proteins, with many effector proteins exhibiting marked preferences for chains of specific lengths [5]. This length dependency adds a crucial regulatory layer to ubiquitin signaling, allowing cells to fine-tune responses based on the extent of substrate modification.
Table 2: Chain Length-Dependent Processes in Ubiquitin Signaling
| Process/Component | Minimum Chain Length | Functional Consequence | Reference |
|---|---|---|---|
| Proteasomal Targeting | 4 ubiquitins (K48) | Efficient degradation signal [5] | Thrower et al., 2000 |
| USP5 Affinity | 4 ubiquitins | Highest binding affinity [5] | - |
| UCH-L3 Specificity | Shorter chains | Preferential cleavage [5] | - |
| K27-linkage Readers | 6+ ubiquitins | 64-70% of significant interactions [5] | - |
| K29-linkage Readers | 6+ ubiquitins | 64-70% of significant interactions [5] | - |
| K33-linkage Readers | 6+ ubiquitins | 64-70% of significant interactions [5] | - |
Research has demonstrated that for K48-linked chains, a minimum of four ubiquitin moieties is typically required to constitute an efficient degradation signal for the 26S proteasome [5]. However, recent evidence suggests this requirement is adaptive, with shorter chains sometimes sufficient to promote degradation of certain substrates [5]. The deubiquitinating enzyme USP5 shows dramatically enhanced affinity for ubiquitin tetramers compared to dimers, while UCH-L3 preferentially cleaves shorter chains over longer polymers [5]. Proteome-wide studies have revealed that for the less common linkage types (K27, K29, and K33), 64-70% of significant interactions with ubiquitin-binding proteins occur exclusively with longer chains (Ub6+), indicating that length sensitivity is a general feature of ubiquitin chain recognition [5]. This preference for longer chains likely reflects their ability to adopt a greater diversity of conformations and present multiple binding epitopes for effector proteins.
The length of ubiquitin chains is dynamically regulated through the opposing actions of ubiquitin chain elongating enzymes and deubiquitinating enzymes. This dynamic regulation allows cells to rapidly modulate the strength or outcome of ubiquitin signals in response to changing conditions. For example, the Cdc48/p97 complex in yeast regulates ubiquitin chain length in a manner that influences substrate fate [6]. Understanding how chain length controls ubiquitin signaling requires specialized methodologies, as conventional techniques often fail to resolve length heterogeneity, particularly for endogenous substrates modified at multiple sites with chains of heterogeneous lengths [6].
Experimental Resolution of Ubiquitin Chains: MES vs MOPS Buffer Systems
The resolution of polyubiquitin chains by SDS-PAGE is strongly influenced by the choice of running buffer, with MES (2-[N-morpholino]ethanesulfonic acid) and MOPS (3-[N-morpholino]propanesulfonic acid) buffers offering distinct advantages for different experimental needs. These morpholine-based buffers differ in their side chain structures (MES has an ethyl sulfonic acid group while MOPS has a propyl sulfonic acid group) and consequently exhibit different buffering ranges (MES: pH 5.5-6.7; MOPS: pH 6.5-7.9) [7]. This variation in chemical properties translates to differential resolution capabilities for ubiquitin chains of different sizes.
MES buffer provides superior resolution for smaller ubiquitin chains, particularly those comprising 2-5 ubiquitin units [3] [8]. When using pre-poured gradient gels, MES buffer enables clear separation of relatively small ubiquitin oligomers, making it ideal for experiments focusing on short-chain ubiquitination or mono-ubiquitination [3]. In contrast, MOPS buffer offers improved resolution for longer polyubiquitin chains containing eight or more ubiquitin molecules [3] [8]. The extended separation range of MOPS buffer makes it particularly valuable for detecting the high-molecular weight smears characteristic of extensively polyubiquitinated proteins. For comprehensive analysis across a broad size range, Tris-glycine buffers with 8% acrylamide gels can provide good separation of ubiquitin chains containing up to 20 ubiquitin units, while higher percentage gels (12%) improve resolution of smaller chains at the expense of separation in the high molecular weight range [3].
Diagram 1: Experimental workflow for ubiquitin chain resolution showing critical decision points in buffer selection for optimal separation of different chain sizes. The choice between MES and MOPS buffers depends on the specific chain lengths of interest.
Essential Methodologies for Ubiquitin Code Analysis
Sample Preparation and Preservation
The successful analysis of ubiquitin chains requires careful sample preparation to preserve the native ubiquitination state of proteins. Two critical considerations include inhibition of deubiquitinating enzymes (DUBs) and proteasome inhibitors. DUB activity must be blocked during cell lysis to prevent the hydrolysis of ubiquitin chain linkages. This requires including both EDTA or EGTA to chelate metal ions essential for metalloproteinase DUBs, and cysteine-directed alkylating agents such as N-ethylmaleimide (NEM) or iodoacetamide (IAA) to inhibit cysteine protease DUBs [3] [8]. While standard protocols often recommend 5-10 mM NEM, some ubiquitin linkages (particularly K63 and M1 chains) require up to 10-fold higher concentrations (50-100 mM) for complete preservation [3]. For mass spectrometry applications, NEM is preferred over IAA as IAA creates an adduct identical in mass to the Gly-Gly dipeptide remnant used to identify ubiquitination sites [3].
Proteasome inhibition is equally critical, as proteins modified with most ubiquitin linkage types (except K63 and M1) can be targeted to the 26S proteasome for degradation. MG132 is the most widely used proteasome inhibitor and is essential for preserving the ubiquitylated forms of proteins destined for degradation [3] [8]. However, prolonged treatment (12-24 hours) with MG132 can induce cytotoxic effects and stress responses that may alter ubiquitination patterns, so shorter incubation times are generally recommended [3]. For complete preservation of ubiquitin conjugates, cells should be pre-treated with MG132 prior to lysis, and DUB inhibitors should be included in the lysis buffer.
UbiCRest for Linkage Determination
The UbiCRest (Ubiquitin Chain Restriction) assay is a powerful qualitative method for determining ubiquitin linkage types and chain architecture using linkage-specific deubiquitinating enzymes (DUBs) [9]. This approach exploits the intrinsic linkage preferences of specific DUBs to digest particular ubiquitin chain types in parallel reactions, followed by gel-based analysis of the cleavage products. The pattern of digestion reveals the linkage composition of the ubiquitin chains in the sample.
Table 3: Linkage-Specific DUBs for UbiCRest Analysis
| DUB Enzyme | Preferred Linkage Specificity | Working Concentration | Additional Notes |
|---|---|---|---|
| USP21 | Non-specific (all linkages) | 1-5 µM | Positive control |
| vOTU | Non-specific (except M1) | 0.5-3 µM | Positive control, does not cleave M1 |
| OTUD3 | K6, K11 | 1-20 µM | Cleaves K6 and K11 equally |
| Cezanne | K11 | 0.1-2 µM | Very active, non-specific at high concentrations |
| OTUD2 | K11, K27, K29, K33 | 1-20 µM | Prefers longer K11 chains |
| TRABID | K29, K33 | 0.5-10 µM | Cleaves K29 and K33 equally |
| OTUB1 | K48 | 1-20 µM | Highly specific, not very active |
| OTUD1 | K63 | 0.1-2 µM | Very active, non-specific at high concentrations |
| OTULIN | M1 | 0.1-2 µM | Linear chain specificity |
The UbiCRest procedure begins with the preparation of ubiquitinated substrates, which can be in vitro ubiquitylation reactions, immunopurified ubiquitinated proteins, or purified ubiquitin chains. The substrate is divided into multiple aliquots for parallel digestion with a panel of DUBs with known linkage specificities [9]. Reactions are typically performed in appropriate buffers at 37°C for 1-2 hours, then terminated by adding SDS-PAGE loading buffer. The digestion products are resolved by SDS-PAGE using the appropriate buffer system (MES or MOPS depending on the chain sizes of interest) and analyzed by immunoblotting with ubiquitin-specific antibodies [9]. Interpretation of results involves comparing the digestion patterns across the different DUB treatments—complete digestion by a linkage-specific DUB indicates the presence of that linkage type, while partial digestion suggests heterogeneous chain types or branched architectures [9]. For example, resistance of a ubiquitin smear to OTUB1 (K48-specific) but sensitivity to OTUD1 (K63-specific) would indicate predominantly K63-linked chains.
Diagram 2: UbiCRest experimental workflow for determining ubiquitin chain linkage types using linkage-specific deubiquitinating enzymes (DUBs). Parallel digestion with different DUBs reveals chain composition through distinctive cleavage patterns.
Mass Spectrometry-Based Approaches
Mass spectrometry-based methods provide the most comprehensive and quantitative analysis of ubiquitin linkages. The Ub-AQUA/PRM (Ubiquitin-Absolute Quantification/Parallel Reaction Monitoring) method enables direct and highly sensitive measurement of all eight ubiquitin linkage types simultaneously [6]. This approach uses isotopically labeled signature peptides (AQUA peptides) for each linkage type as internal standards for absolute quantification [6]. Trypsin digestion of ubiquitin chains generates characteristic signature peptides specific to particular linkage types, which can be quantified by liquid chromatography-tandem mass spectrometry (LC-MS/MS) using parallel reaction monitoring (PRM) for enhanced sensitivity and accuracy [6].
For branched ubiquitin chains, specialized approaches are required. The R54A ubiquitin mutant strategy enables detection of K48/K63 branched chains by removing the trypsin cleavage site at R54, preserving both K48 and K63 Gly-Gly modifications on the same tryptic peptide for MS analysis [4]. Similarly, UbiChEM-MS (Ubiquitin Chain Enrichment Middle-Down Mass Spectrometry) uses limited trypsinolysis to cleave C-terminal di-Gly residues while preserving the ubiquitin backbone, generating Ub1-74 fragments that differentiate non-branched (GG-Ub1-74) from branched (2xGG-Ub1-74) ubiquitin species [4]. These methods have revealed that approximately 3-4% of total ubiquitin exists as K11/K48 branched chains during mitotic arrest [4].
To measure ubiquitin chain length, the Ub-ProT (Ubiquitin Chain Protection from Trypsinization) method employs a "chain protector" protein that binds ubiquitin chains and protects them from complete tryptic digestion, followed by limited digestion and quantitative MS analysis to determine chain length distributions [6]. This approach is particularly valuable for analyzing endogenous substrates that may be modified at multiple sites with chains of heterogeneous lengths.
The Scientist's Toolkit: Essential Research Reagents
Table 4: Essential Reagents for Ubiquitin Research
| Reagent Category | Specific Examples | Concentration/Application | Function/Purpose |
|---|---|---|---|
| DUB Inhibitors | N-ethylmaleimide (NEM) | 10-100 mM in lysis buffer | Alkylates active site cysteine of DUBs |
| Iodoacetamide (IAA) | 10-100 mM in lysis buffer | Alternative cysteine alkylating agent | |
| EDTA/EGTA | 1-10 mM in lysis buffer | Chelates metal ions for metalloprotease DUBs | |
| Proteasome Inhibitors | MG132 | 10-50 µM pretreatment | Reversible proteasome inhibitor |
| SDS-PAGE Buffers | MES | 50 mM, pH 6.5-7.0 | Optimal resolution of small ubiquitin chains (2-5 units) |
| MOPS | 50 mM, pH 7.0-7.5 | Optimal resolution of large ubiquitin chains (8+ units) | |
| Tris-glycine | Standard concentration | General purpose ubiquitin chain separation | |
| Linkage-Specific DUBs | OTUB1 | 1-20 µM (UbiCRest) | K48-linkage specific cleavage |
| OTUD1 | 0.1-2 µM (UbiCRest) | K63-linkage specific cleavage | |
| OTULIN | 0.1-2 µM (UbiCRest) | M1-linkage specific cleavage | |
| Cezanne | 0.1-2 µM (UbiCRest) | K11-linkage specific cleavage | |
| Ubiquitin Variants | R54A ubiquitin | Replacement strategy | Detection of K48/K63 branched chains |
| TEV-FLAG ubiquitin | Insertion at G53/E64 | Distinguishes branched from mixed chains | |
| Affinity Tools | TUBEs (Tandem-repeated Ubiquitin-Binding Entities) | Variable | Enrichment of ubiquitinated proteins |
| Linkage-specific antibodies | Manufacturer's dilution | Detection of specific linkage types |
This collection of specialized reagents enables researchers to address specific questions about ubiquitin chain architecture, abundance, and function. The choice of specific reagents depends on the experimental goals, with buffer selection (MES vs. MOPS) determined by the size range of ubiquitin chains of interest, and inhibitor cocktails tailored to preserve the specific ubiquitin linkages under investigation [3] [7] [8]. For discovery-based approaches, mass spectrometry methods coupled with specialized ubiquitin variants provide the most comprehensive analysis, while targeted questions about specific linkage types can be addressed with UbiCRest or linkage-specific antibodies [6] [4] [9].
The ubiquitin code represents a multi-layered signaling system that integrates information from linkage type, chain length, and architecture to direct diverse cellular outcomes. The resolution of polyubiquitin chains using specialized buffer systems like MES and MOPS provides a foundation for deciphering this complex code, enabling researchers to separate and analyze the different ubiquitin chain species present in biological samples. When combined with sophisticated analytical techniques such as UbiCRest and mass spectrometry-based approaches, these methods reveal the remarkable complexity of ubiquitin signaling, from the canonical K48-degradation signals to the emerging roles of atypical and branched chains. As our understanding of the ubiquitin code continues to expand, so too does our appreciation of its importance in health and disease, highlighting the potential of targeting ubiquitin signaling for therapeutic intervention.
Ubiquitinated proteins frequently present as smears rather than distinct bands on western blots, creating significant challenges for researchers studying this crucial post-translational modification. This application note explores the electrophoretic principles underlying this phenomenon and demonstrates how buffer system selection—specifically MES versus MOPS—dramatically impacts resolution of polyubiquitin chains. We provide optimized protocols for sample preparation, electrophoresis, and transfer to address the unique physicochemical properties of ubiquitinated proteins, enabling clearer data interpretation for researchers and drug development professionals working in ubiquitin biology.
The characteristic smear of ubiquitinated proteins in SDS-PAGE stems from fundamental properties of the ubiquitin-protein conjugates themselves. Each ubiquitin moiety adds approximately 8 kDa to the molecular weight of the modified protein [8]. However, this modification does not occur uniformly—a protein population can exhibit substantial heterogeneity in both the number of ubiquitin molecules attached (from mono-ubiquitination to chains containing dozens of ubiquitins) and the specific linkage types between ubiquitin molecules (K48, K63, M1, etc.) [10] [11]. This generates a continuum of molecular weights during electrophoresis rather than discrete bands.
The linkage-specific architecture of polyubiquitin chains further complicates separation. Different chain types (K48, K63, etc.) may adopt distinct conformations that interact uniquely with the gel matrix, affecting migration patterns [11]. Additionally, the inherent stability of ubiquitin chains during sample preparation influences band appearance, as chains can be partially degraded by deubiquitinases (DUBs) if proper inhibitors are not used [10] [8]. Understanding these factors is essential for developing strategies to minimize smearing and obtain interpretable data.
Buffer Chemistry and Polyubiquitin Chain Resolution
The choice of electrophoresis buffer system significantly impacts the resolution of polyubiquitinated proteins due to differences in running pH, buffer capacity, and separation characteristics [12] [8].
Table 1: Electrophoresis Buffer Systems for Ubiquitin Chain Separation
| Buffer System | Optimal Resolution Range | pH | Key Applications | Advantages/Limitations |
|---|---|---|---|---|
| MES | 2-5 ubiquitin units (~16-40 kDa) | ~6.5 | Analysis of short-chain ubiquitination; mono-ubiquitination | Superior resolution for smaller ubiquitin chains [8] |
| MOPS | >8 ubiquitin units (>64 kDa) | ~7.5 | Analysis of long polyubiquitin chains; proteomic profiling | Maintains resolution for high molecular weight conjugates [8] |
| Tris-Glycine | Broad range separation | 8.3-9.5 | General ubiquitination screening; standard western blotting | Versatile but may compress high molecular weight species [8] |
The MES buffer system provides excellent resolution in the lower molecular weight range ideal for resolving shorter ubiquitin chains, while MOPS buffer maintains superior separation for longer polyubiquitin chains that would typically compress in the resolving gel with other buffer systems [8]. This differential resolution capacity directly addresses the electrophoretic challenge of ubiquitin smearing by providing tools tailored to specific chain length ranges of interest.
Table 2: Gel Percentage Recommendations for Ubiquitin Chain Separation
| Gel Percentage | Separation Range | Recommended Buffer | Typical Applications |
|---|---|---|---|
| 8-10% | Long chains (>8 ubiquitins) | MOPS | Capturing full spectrum of polyubiquitination; degradation studies |
| 12% | Short to medium chains (2-8 ubiquitins) | MES | Linkage-specific analysis; signaling studies |
| Gradient (4-20%) | Entire range (mono- to poly-ubiquitin) | MOPS or Tris-Glycine | Initial screening; samples with unknown ubiquitination status |
Experimental Protocols
Sample Preparation for Ubiquitination Studies
Proper sample preparation is critical for preserving ubiquitin signals and minimizing artifactual smearing.
Materials & Reagents:
- Lysis buffer (50 mM Tris-HCl, pH 7.5, 150 mM NaCl, 1% NP-40)
- Protease inhibitors (complete mini tablets)
- Deubiquitinase inhibitors (10-100 mM N-ethylmaleimide [NEM])
- Proteasome inhibitors (10-50 μM MG132)
- Phosphatase inhibitors (as required)
- N-ethylmaleimide (NEM) at 50-100 mM for K63 chain preservation [8]
Procedure:
- Pre-chill all equipment and keep samples on ice throughout procedure
- Prepare fresh lysis buffer containing:
- 50 mM N-ethylmaleimide (NEM) for K63 linkage preservation
- 10 μM MG132 proteasome inhibitor
- Complete protease inhibitor cocktail
- 5 mM EDTA/EGTA
- Lyse cells using brief sonication (3 × 5-second pulses) or mechanical homogenization
- Centrifuge at 16,000 × g for 15 minutes at 4°C
- Transfer supernatant to fresh pre-chilled tubes
- Determine protein concentration using BCA or Bradford assay
- Prepare samples with 2× Laemmli buffer, heat at 70°C for 10 minutes (avoid boiling)
Key Considerations: NEM concentration is critical—standard protocols using 5-10 mM NEM are insufficient for preserving K63-linked chains, which require 50-100 mM concentrations [8]. Avoid boiling samples as this can cause aggregation of ubiquitinated proteins.
In Vitro Ubiquitination Assay Protocol
Materials & Reagents:
- E1 activating enzyme (5 μM stock)
- E2 conjugating enzyme (25 μM stock)
- E3 ligase (10 μM stock)
- 10× E3 ligase reaction buffer (500 mM HEPES, pH 8.0, 500 mM NaCl, 10 mM TCEP)
- Ubiquitin (1.17 mM, 10 mg/mL)
- MgATP solution (100 mM)
- Substrate protein (5-10 μM)
- Termination reagents: 2× SDS-PAGE sample buffer or 500 mM EDTA/1 M DTT
Procedure:
- Assemble reaction on ice in the following order for a 25 μL total volume:
- 2.5 μL 10× E3 ligase reaction buffer (1× final)
- 1 μL Ubiquitin (~100 μM final)
- 2.5 μL MgATP solution (10 mM final)
- X μL Substrate protein (5-10 μM final)
- 0.5 μL E1 enzyme (100 nM final)
- 1 μL E2 enzyme (1 μM final)
- X μL E3 ligase (1 μM final)
- dH₂O to 25 μL total volume
Incubate at 37°C for 30-60 minutes in a water bath
Terminate reaction based on downstream application:
- For direct analysis: Add 25 μL 2× SDS-PAGE sample buffer
- For downstream applications: Add 0.5 μL 500 mM EDTA (20 mM final) or 1 μL 1 M DTT (100 mM final)
Analyze products by SDS-PAGE followed by Coomassie staining or western blotting [13]
Controls: Include negative control reactions without MgATP to distinguish specific ubiquitination from non-specific modifications [13].
Electrophoresis and Transfer Optimization
Materials & Reagents:
- MES or MOPS running buffer (depending on application)
- Pre-cast or hand-cast polyacrylamide gels (8-12% or gradient)
- PVDF membrane (0.2 μm pore size)
- Transfer buffer (25 mM Tris, 192 mM glycine, 20% methanol)
- Standard western blotting equipment
Electrophoresis Procedure:
- Select appropriate gel percentage and buffer system based on target chain size (refer to Tables 1 & 2)
- Load pre-stained molecular weight markers and samples
- Run electrophoresis at constant voltage:
- 100V for stacking through MES/MOPS gels
- 150V for Tris-glycine gels
- Monitor dye front until sufficient separation achieved
Transfer Optimization for Ubiquitinated Proteins:
- Activate PVDF membrane in 100% methanol for 1 minute
- Equilibrate gel and membrane in transfer buffer for 15 minutes
- Transfer at 30V for 2.5 hours at 4°C
- Critical: Avoid faster transfer protocols which cause incomplete unfolding of ubiquitin chains and reduce antibody accessibility [8]
- Verify transfer efficiency using Ponceau S staining
The Scientist's Toolkit: Essential Research Reagents
Table 3: Key Research Reagent Solutions for Ubiquitination Studies
| Reagent/Category | Specific Examples | Function/Application |
|---|---|---|
| Deubiquitinase Inhibitors | N-ethylmaleimide (NEM; 50-100 mM) | Preserves labile ubiquitin chains during lysis [8] |
| Proteasome Inhibitors | MG132, Bortezomib | Prevents degradation of ubiquitinated proteins [8] |
| Linkage-Specific Binders | TUBEs (K48-, K63-specific), linkage-specific antibodies | Enrichment and detection of specific chain types [11] |
| Ubiquitin Enzymes | E1, E2, E3 enzymes (Boston Biochem) | In vitro reconstitution of ubiquitination cascades [13] |
| Specialized Buffers | MES, MOPS SDS-PAGE buffers | Optimized separation of different ubiquitin chain lengths [8] |
| Detection Membranes | PVDF (0.2 μm pore size) | Enhanced retention of small ubiquitin modifications [8] |
Workflow and Pathway Visualizations
Experimental Workflow for Ubiquitination Analysis
Molecular Basis of Ubiquitin Smearing
The electrophoretic smearing of ubiquitinated proteins in SDS-PAGE, while challenging, can be systematically addressed through understanding of the underlying molecular principles and implementation of optimized protocols. The strategic selection between MES and MOPS buffer systems provides researchers with targeted approaches for resolving specific ubiquitin chain length ranges of interest. When combined with appropriate sample preservation methods, gel percentage optimization, and careful transfer conditions, these techniques transform uninterpretable smears into resolvable data, advancing research in ubiquitin signaling and targeted protein degradation therapeutics.
The resolution of complex protein mixtures, particularly polyubiquitin chains and their conjugated proteins, is a cornerstone of modern molecular biology and proteomics research. The choice of electrophoresis buffer system is not merely a technical detail but a fundamental parameter that dictates the success of these separations. Among the available options, MES (2-(N-morpholino)ethanesulfonic acid) and MOPS (3-(N-morpholino)propanesulfonic acid) have emerged as critical buffers for contemporary protein analysis, especially when using Bis-Tris gels. These chemically distinct buffers create different electrophoretic environments, leading to significant variations in protein migration patterns and separation efficiency [14]. For researchers investigating the ubiquitin-proteasome system—where resolving proteins modified by ubiquitin chains of varying lengths and linkages is essential—understanding and selecting the appropriate buffer system is paramount. This application note details the chemical properties, separation characteristics, and optimal employment of MES and MOPS buffers, providing structured protocols and data to guide researchers in leveraging these systems for superior protein resolution, with a specific focus on applications in ubiquitin research.
Chemical Properties and Separation Mechanisms
MES and MOPS are both morpholine-based buffers optimized for SDS-PAGE under denaturing conditions, yet their subtle structural differences confer distinct electrophoretic properties. The primary distinction lies in their carbon chain length; MES possesses a two-carbon chain, while MOPS has a three-carbon chain. This structural difference directly impacts their pKa values—approximately 6.2 for MES and 7.2 for MOPS—which in turn dictates the pH of the running buffer and the subsequent electrophoretic environment [15] [14].
The operating pH affects the charge distribution of the counter-ions in the running buffer. This distribution governs the net electric field experienced by the SDS-protein micelles during electrophoresis. In the MES system (typically run at pH ~8.0), the ion concentration and charge environment create a relatively stronger net field, resulting in faster migration speeds for proteins. Conversely, the MOPS buffer (typically run at pH ~7.7) generates a different charge environment with more negative charge, which slows the mobility of the SDS-protein complexes. This reduced velocity provides a longer residence time within the gel matrix, enhancing the resolution of larger molecular weight species [15] [14]. The specific selection between these buffers is therefore not arbitrary but a strategic decision based on the target protein's size and the required resolution.
Visualizing the Buffer Selection Workflow
The following diagram outlines the logical decision process for selecting between MES and MOPS buffers based on experimental goals, summarizing the key principles discussed.
Quantitative Comparison of MES and MOPS Performance
The differential migration patterns between MES and MOPS buffers translate into concrete, measurable differences in protein separation ranges. These differences are critical for experimental planning and interpretation. The table below summarizes the key performance characteristics of each buffer system, providing a direct comparison to guide selection.
Table 1: Performance Comparison of MES and MOPS SDS Running Buffers
| Parameter | MES SDS Running Buffer | MOPS SDS Running Buffer |
|---|---|---|
| Chemical Name | 2-(N-morpholino)ethanesulfonic acid | 3-(N-morpholino)propanesulfonic acid |
| Typical Running Buffer pH | ~8.0 [15] | ~7.7 [14] |
| pKa | ~6.2 [15] | ~7.2 [15] |
| Relative Migration Speed | Faster [14] | Slower [14] |
| Optimal Separation Range | Smaller proteins; superior resolution of short ubiquitin oligomers (2-5 ubiquitins) [3] | Medium to large proteins (40-400 kDa); superior resolution of long polyubiquitin chains (8+ ubiquitins) [3] [14] |
| Key Feature | Faster run time due to stronger net electric field [15] [14] | Enhanced resolution of larger proteins due to reduced migration velocity and longer residence time in gel [3] [14] |
The separation of polyubiquitin chains serves as an excellent example of these principles in action. A single ubiquitin moiety has a molecular weight of approximately 8.5 kDa. Chains can consist of two (di-Ub, ~17 kDa), five (penta-Ub, ~42.5 kDa), or even more ubiquitins, easily pushing the molecular weight into the high range. As confirmed in methodological studies, MES buffer provides improved resolution for smaller ubiquitin oligomers comprising 2-5 ubiquitins, while MOPS buffer is superior for resolving polyubiquitin chains containing eight or more ubiquitins [3]. This makes MOPS particularly valuable for studying extensively ubiquitylated proteins or for analyzing the topology of long ubiquitin chains, which are common in signaling pathways regulating processes like protein degradation and DNA damage response [16] [17].
Detailed Experimental Protocols
Protocol 1: SDS-PAGE Using Pre-cast Bis-Tris Gels with MES or MOPS Buffer
This protocol describes the standard procedure for running denaturing SDS-PAGE using commercially available pre-cast Bis-Tris gels with either MES or MOPS SDS Running Buffer.
I. Research Reagent Solutions
Table 2: Essential Reagents for SDS-PAGE with MES/MOPS Buffers
| Reagent / Material | Function / Description | Example / Notes |
|---|---|---|
| NuPAGE Bis-Tris Pre-cast Gels | Gel matrix for protein separation. Stable at neutral pH, offering longer shelf life and improved protein stability vs. traditional Tris-Glycine gels. | Available in various percentages (e.g., 4-12%, 10%). The neutral pH avoids aspartate-proline bond cleavage. |
| MES or MOPS SDS Running Buffer (20X) | Concentrated running buffer providing the ions and pH for electrophoresis and protein separation. | Dilute to 1X in distilled water before use. Catalog numbers: NP0002 (MES) or NP0001 (MOPS). |
| LDS Sample Buffer (4X) | Sample preparation buffer containing Lithium Dodecyl Sulfate (LDS) for denaturation. | Preferred over SDS buffer for neutral pH systems. Contains a reducing agent. |
| Sample Reducing Agent | Typically DTT, used to reduce disulfide bonds in proteins. | Critical: Add fresh just before loading; it is not stable in storage [14]. |
| Molecular Weight Marker | Pre-stained or unstained protein standards for estimating molecular weight and monitoring run progress. | |
| Antioxidant | Added to the running buffer when running reduced samples to prevent re-oxidation of proteins during electrophoresis. | NuPAGE Antioxidant [14]. |
II. Step-by-Step Workflow
Sample Preparation:
- Mix your protein sample with 4X LDS Sample Buffer to a final 1X concentration.
- Add a fresh reducing agent (e.g., DTT) to the recommended final concentration (e.g., 50 mM).
- Heat the samples at 70°C for 10 minutes to fully denature the proteins [14].
- Centrifuge briefly to collect condensation.
Gel and Buffer Setup:
- Dilute the 20X MES or MOPS SDS Running Buffer to 1X with distilled water. For example, add 25 mL of 20X buffer to 475 mL of water to make 500 mL of 1X buffer.
- Remove the pre-cast Bis-Tris gel from its packaging, rinse the wells with distilled water, and place it in the electrophoresis chamber.
- If running reduced samples, add 500 µL of NuPAGE Antioxidant to the 1X running buffer in the upper (cathode) chamber only [14].
- Pour the 1X running buffer into the inner and outer chambers of the gel apparatus.
Loading and Running:
- Load prepared samples and molecular weight markers into the wells.
- Assemble the lid and connect to a power supply.
- Run the gel at a constant voltage (e.g., 150-200 V) for approximately 45-60 minutes, or until the dye front has migrated to the bottom of the gel. The MES buffer will result in a faster run time compared to MOPS.
Protocol 2: Analysis of Protein Ubiquitylation Using MOPS Buffer
This specific protocol is optimized for resolving high molecular weight polyubiquitylated proteins, a common application where MOPS buffer excels.
I. Additional Specialized Reagents
- Lysis Buffer with DUB Inhibitors: To preserve the labile ubiquitin modifications, cell lysis must be performed in the presence of potent deubiquitylase (DUB) inhibitors. A recommended buffer is RIPA or similar, supplemented with 50-100 mM N-ethylmaleimide (NEM) or Iodoacetamide (IAA) to alkylate the active site cysteine of DUBs [3]. EDTA/EGTA should also be included to chelate metal ions required by metalloproteinase DUBs.
- Proteasome Inhibitor (e.g., MG132): To prevent the degradation of polyubiquitylated proteins (typically K48- or K11-linked) after inhibition of the proteasome, allowing for their accumulation and detection [3] [17].
II. Step-by-Step Workflow
Cell Treatment and Lysis:
- If studying endogenous ubiquitylation, treat cells with a proteasome inhibitor like MG132 (e.g., 10-20 µM for 4-6 hours) prior to harvesting to enrich for ubiquitylated species [3] [17].
- Lyse cells directly in pre-heated SDS lysis buffer containing 1% SDS and high concentrations of DUB inhibitors (e.g., 50-100 mM NEM) to instantly denature proteins and inhibit DUBs. Immediate heating at 95°C for 5-10 minutes is recommended [3].
Sample Preparation and Gel Electrophoresis:
- Dilute the lysate with LDS Sample Buffer containing DTT. The high SDS concentration from the lysis buffer may require adjustment to maintain the final 1X LDS concentration.
- Heat samples at 70°C for 10 minutes.
- Load samples onto a Bis-Tris gel and run using 1X MOPS SDS Running Buffer as described in Protocol 1. The use of MOPS is crucial here for resolving the high molecular weight smears or ladders characteristic of polyubiquitylated proteins, which can often exceed 200 kDa [3].
Downstream Analysis:
- Following electrophoresis, transfer the proteins to a nitrocellulose or PVDF membrane for western blotting.
- Probe the blot with antibodies specific for your protein of interest to see a high molecular weight smear, or with ubiquitin-specific antibodies (e.g., anti-ubiquitin, anti-K48-linkage specific, anti-K63-linkage specific).
Troubleshooting and Best Practices
Problem: Poor resolution of high molecular weight proteins or polyubiquitin smears. Solution: Switch from MES to MOPS SDS Running Buffer. The slower migration and different charge environment of MOPS are specifically designed to improve resolution in the higher molecular weight range (>40 kDa) [3] [14].
Problem: Loss of ubiquitin signal or disappearance of high molecular weight species. Solution: Ensure that potent DUB inhibitors (NEM/IAA) are freshly prepared and added at high concentrations (up to 100 mM) to the lysis buffer. Avoid long incubation times on ice; rapid lysis with hot SDS buffer is most effective [3].
Problem: Precipitated sample buffer. Solution: LDS or SDS sample buffers can precipitate when stored at 4°C. Warm the buffer to room temperature and vortex until the precipitate is fully dissolved before use. For convenience, aliquots can be stored at room temperature [14].
Problem: Excessive heat generation during electrophoresis. Solution: Ensure the gel apparatus is not run at excessive power levels and that the cooling system (if available) is functioning. The neutral pH of these systems can generate more heat than traditional Tris-Glycine systems.
The strategic selection between MES and MOPS buffer systems is a critical determinant for successful protein separation, particularly in complex applications like the analysis of protein ubiquitylation. MES buffer, with its faster migration and superior resolution of lower molecular weight proteins and short ubiquitin chains, is ideal for many routine applications. In contrast, MOPS buffer, characterized by its slower migration and enhanced resolution of high molecular weight proteins and long polyubiquitin chains, is indispensable for ubiquitin researchers characterizing the extensive ubiquitylation of substrate proteins. By following the detailed protocols, leveraging the comparative data, and adhering to the troubleshooting guidance provided in this note, researchers can make informed decisions and optimize their electrophoresis conditions to achieve clear, reproducible, and high-quality results in their studies of the ubiquitin-proteasome system and beyond.
Protein ubiquitination is a versatile post-translational modification that regulates virtually all cellular processes, from targeted degradation via the proteasome to activation of signaling cascades [9]. The diversity of ubiquitin signals stems from the ability to form polyubiquitin chains through eight distinct linkage types (Met1, Lys6, Lys11, Lys27, Lys29, Lys33, Lys48, Lys63), which can be assembled into homotypic, mixed, or branched architectures [9] [18]. This complexity presents significant challenges for biochemical analysis, particularly when separating ubiquitinated proteins using gel electrophoresis. The choice of running buffer system—specifically MES (2-(N-morpholino)ethanesulfonic acid) versus MOPS (3-(N-morpholino)propanesulfonic acid)—profoundly impacts the resolution of different ubiquitin chain types and consequently shapes research outcomes and interpretations.
The migration behavior of ubiquitin chains on SDS-PAGE gels does not strictly correlate with molecular weight due to ubiquitin's resistance to complete denaturation, which affects chain conformation and mobility [9] [8]. This technical nuance means that buffer selection must align with the specific research objectives—whether focused on degradative ubiquitin signals (typically shorter Lys48-linked chains) or non-degradative signaling pathways (often involving longer chains of atypical linkages). This application note examines how buffer choice directs experimental outcomes in ubiquitin research and provides optimized protocols for investigating ubiquitin signaling versus degradation.
Buffer Chemistry and Separation Characteristics
The differential migration of ubiquitin chains in MES and MOPS buffers stems from their distinct electrophoretic properties and how they interact with the ubiquitin protein's structure. MES buffer provides superior resolution for smaller ubiquitin chains (2-5 units) due to its higher conductivity and sharper band separation in the lower molecular weight range [8]. Conversely, MOPS buffer is ideal for resolving longer ubiquitin chains (≥8 units) that are characteristic of signaling complexes, as it maintains better separation efficiency for higher molecular weight species [8].
Table 1: Comparison of MES and MOPS Buffer Systems for Ubiquitin Research
| Parameter | MES Buffer | MOPS Buffer |
|---|---|---|
| Optimal Resolution Range | 2-5 ubiquitin units [8] | ≥8 ubiquitin units [8] |
| Preferred Application | Degradation studies (shorter chains) [8] | Signaling analysis (longer chains) [8] |
| Typical Gel Percentage | 12% SDS-PAGE [8] | 8% SDS-PAGE [8] |
| Chain Linkages Resolved | Lys48, Lys11 (shorter chains) [8] | Met1, Lys63, mixed linkages (longer chains) [8] |
| Transfer Conditions | 30V for 2.5 hours (optimized to prevent unfolding) [8] | 30V for 2.5 hours (optimized to prevent unfolding) [8] |
| Membrane Type | PVDF (0.2µm for smaller chains) [8] | PVDF (standard pore size) [8] |
The differential migration patterns observed in these buffer systems are not merely technical artifacts but reflect fundamental differences in ubiquitin chain architecture and compaction. The conformation of ubiquitin chains, especially those involving Met1 (linear) or Lys63 linkages, responds differently to the electrophoretic conditions of each buffer system, enabling researchers to selectively resolve chain types relevant to their biological questions.
Research Applications: Signaling Versus Degradation Studies
MOPS Buffer for Signaling Analysis
The MOPS buffer system is particularly valuable for investigating non-degradative ubiquitin signaling in innate immunity, NF-κB activation, and inflammatory pathways. Recent research on STING (Stimulator of Interferon Genes) pathway activation demonstrates the utility of MOPS-based separations, as STING activation induces the formation of both M1- and K63-linked ubiquitin chains that recruit signaling complexes [19]. These signaling-associated ubiquitin chains often form extensive polymers that require the extended separation range provided by MOPS buffers.
The LUBAC complex (Linear Ubiquitin Assembly Complex), comprising HOIP and other components, generates Met1-linked ubiquitin chains that activate NF-κB signaling [19]. These linear ubiquitin chains can form extensive polymers that create signaling platforms for the recruitment of downstream effectors. MOPS buffer enables clear resolution of these high molecular weight complexes, facilitating the study of their assembly and regulation. Similarly, K63-linked ubiquitin chains involved in kinase activation and protein trafficking often form longer chain structures that are better resolved in MOPS-based electrophoresis systems [19] [18].
Figure 1: MOPS Buffer Applications in Ubiquitin Signaling Pathways. MOPS buffer optimally resolves long M1- and K63-linked ubiquitin chains central to innate immune and inflammatory signaling.
MES Buffer for Degradation Studies
The MES buffer system provides superior resolution for analyzing the shorter ubiquitin chains (typically 2-5 ubiquitin units) that target proteins for proteasomal degradation. Lys48-linked polyubiquitin chains represent the canonical degradation signal, with tetraubiquitin historically considered the minimal signal for proteasomal recognition [9] [18]. MES buffer enables clear separation of these shorter chains, allowing researchers to monitor changes in degradation-specific ubiquitination events.
Beyond Lys48 linkages, MES buffer also effectively resolves shorter chains of other linkage types, including Lys11-linked chains that have been implicated in cell cycle regulation and ER-associated degradation (ERAD) [9] [18]. The ability to distinguish these shorter chain structures is essential for quantifying degradative ubiquitination signals and their regulation under different cellular conditions.
Table 2: Degradation-Specific Ubiquitin Linkages and Their Resolution in MES Buffer
| Linkage Type | Biological Function | Chain Length | Resolution in MES |
|---|---|---|---|
| Lys48 | Primary proteasomal targeting signal [18] | 2-5 units (optimal) | Excellent [8] |
| Lys11 | Cell cycle regulation, ERAD [18] | 2-5 units | Very Good [8] |
| Mixed/Branched | Enhanced degradation specificity [9] | Variable | Good (shorter chains) [8] |
| Lys29 | Proteasomal degradation (subset of substrates) [18] | 2-5 units | Good [8] |
Integrated Experimental Protocols
Protocol 1: UbiCRest for Linkage-Type Analysis Using MES/MOPS
The UbiCRest (Ubiquitin Chain Restriction) assay combines linkage-specific deubiquitinases (DUBs) with optimized electrophoretic separation to decipher ubiquitin chain architecture [9]. This method is particularly powerful for identifying both homotypic and heterotypic ubiquitin chains on substrates.
Sample Preparation:
- Lyse cells in buffer containing 20mM N-ethylmaleimide (NEM), 5mM EDTA/EGTA, and 10µM MG132 to preserve ubiquitin chains [8]
- Immunoprecipitate protein of interest under denaturing conditions
- Divide samples into aliquots for DUB treatment
DUB Treatment:
- Prepare parallel reactions with linkage-specific DUBs (see Table 3)
- Incubate immunoprecipitated samples with DUBs at working concentrations for 2 hours at 37°C
- Terminate reactions with SDS-PAGE loading buffer
Electrophoresis and Analysis:
- For signaling complexes (expected longer chains): Use 8% gels with MOPS buffer [8]
- For degradation studies (shorter chains): Use 12% gels with MES buffer [8]
- Transfer to PVDF membranes (30V for 2.5 hours) [8]
- Probe with appropriate ubiquitin antibodies
Table 3: Linkage-Specific DUBs for UbiCRest Analysis [9]
| Linkage Specificity | DUB Enzyme | Working Concentration | Notes |
|---|---|---|---|
| Lys48 | OTUB1 | 1-20 µM | Highly specific for Lys48 linkages |
| Lys63 | AMSH/OTUD1 | 0.1-2 µM | Very active; monitor concentration to prevent non-specific cleavage |
| Lys11 | Cezanne | 0.1-2 µM | Very active; can become non-specific at high concentrations |
| Lys6 | OTUD3 | 1-20 µM | Also cleaves Lys11 chains equally well |
| Met1 | Otulin | 0.1-1 µM | Specific for linear ubiquitin chains |
| Pan-specific | USP2/USP21 | 1-5 µM | Positive control; cleaves all linkages |
Protocol 2: Quantitative Ubiquitinomics with DIA-MS
Data-independent acquisition mass spectrometry (DIA-MS) provides a powerful complementary approach to gel-based methods for comprehensive ubiquitinome analysis [20]. This protocol enables system-wide quantification of ubiquitination sites across multiple experimental conditions.
Sample Preparation:
- Culture cells in SILAC media for metabolic labeling (optional) [21] [22]
- Treat with proteasome inhibitor (10µM MG132 for 4 hours) to enrich for ubiquitinated species [20]
- Lyse cells in 8M urea buffer with protease and phosphatase inhibitors
- Reduce with TCEP and alkylate with iodoacetamide
- Digest with trypsin overnight at 25°C
diGly Peptide Enrichment:
- Desalt peptides using C18 columns
- Enrich for diGly-modified peptides using anti-diGly antibody beads (31.25µg antibody per 1mg peptide input) [20]
- Wash extensively and elute diGly peptides
Mass Spectrometry Analysis:
- Analyze using Orbitrap-based DIA method with 46 precursor isolation windows [20]
- Use MS2 resolution of 30,000 for optimal quantification [20]
- Match against comprehensive spectral libraries containing >90,000 diGly peptides [20]
- Process data using appropriate software (e.g., Spectronaut, DIA-NN)
Figure 2: DIA-MS Workflow for Comprehensive Ubiquitinome Analysis. This quantitative mass spectrometry approach identifies and quantifies thousands of ubiquitination sites in single measurements.
Table 4: Key Research Reagents for Ubiquitin Studies
| Reagent Category | Specific Examples | Function/Application | Notes |
|---|---|---|---|
| Deubiquitinase Inhibitors | N-ethylmaleimide (NEM) [8] | Preserves ubiquitin chains during extraction | Use 20mM for K63 chains [8] |
| Proteasome Inhibitors | MG132 [21] [20] | Blocks degradation of ubiquitinated proteins | Avoid extended treatments (>12h) to prevent stress responses [8] |
| Linkage-Specific DUBs | OTUB1 (Lys48), AMSH (Lys63) [9] | UbiCRest analysis of chain linkage | Quality control specificity regularly [9] |
| diGly Antibodies | PTMScan Ubiquitin Remnant Motif Kit [21] [20] | Enrichment of ubiquitinated peptides for MS | Commercial kits available from Cell Signaling Technology [21] |
| Ubiquitin Binding Domains | TUBEs (Tandem-repeated Ubiquitin-Binding Entities) [10] | Stabilization and pull-down of ubiquitinated proteins | Protect chains from DUBs during processing [10] |
| Linkage-Specific Antibodies | Anti-K48, Anti-K63, Anti-K11 [8] | Immunoblot detection of specific linkages | Variable recognition of different chain lengths [8] |
Buffer choice in ubiquitin research represents more than a technical consideration—it directly shapes experimental outcomes and biological interpretations. MES buffer systems provide optimal resolution for shorter ubiquitin chains characteristic of proteasomal targeting, while MOPS buffer excels at separating longer chains typical of signaling complexes. The strategic selection of electrophoresis conditions, combined with sophisticated tools like UbiCRest and DIA-MS, enables researchers to decipher the complex ubiquitin code with unprecedented precision. As our understanding of ubiquitin chain architecture continues to evolve, particularly regarding heterotypic and branched chains, these methodological considerations will remain fundamental to advancing both basic science and drug discovery efforts targeting the ubiquitin-proteasome system.
Optimized Protocols: Selecting and Using MES or MOPS for Your Ubiquitin Blots
Purpose and Scope
This Standard Operating Procedure (SOP) establishes a standardized protocol for using 2-(N-morpholino)ethanesulfonic acid (MES) buffer in SDS-PAGE to achieve high-resolution separation of short-chain polyubiquitin polymers, specifically targeting chains comprising 2-5 ubiquitin units. The procedure is optimized for researchers characterizing ubiquitin signaling pathways, particularly in studies requiring clear differentiation of short ubiquitin oligomers which are critical intermediates in various cellular processes including proteasomal targeting and signal transduction.
The selection between MES and MOPS running buffers significantly impacts the resolution of polyubiquitin chains on SDS-PAGE. MES buffer provides superior resolution for relatively small ubiquitin oligomers comprising 2-5 ubiquitins, whereas MOPS (3-(N-morpholino)propanesulfonic acid) buffer is more appropriate for resolving longer polyubiquitin chains containing eight or more ubiquitins [3]. This protocol leverages the specific electrophoretic properties of MES to deliver optimal separation efficiency for short-chain ubiquitin analysis.
Principle
Ubiquitin chains of identical molecular weight but different linkage types migrate to distinct positions on denaturing SDS-PAGE gels due to conformational differences that affect electrophoretic mobility rather than mass alone [9]. The MES buffer system (pKa ≈ 6.1) creates optimal conditions for separating low molecular weight ubiquitin oligomers by providing appropriate ionic strength and pH conditions that maximize conformational differences between short-chain ubiquitin polymers during electrophoresis [3] [7]. This method is particularly valuable for analyzing the early stages of polyubiquitin chain assembly and for distinguishing between different ubiquitin linkage types in the 2-5 ubiquitin unit range.
Materials and Equipment
Research Reagent Solutions
Table 1: Essential Reagents and Materials
| Item | Specification/Function |
|---|---|
| MES Buffer | 50 mM MES, 50 mM Tris Base, 0.1% SDS, 1 mM EDTA, pH ~7.3 [3] |
| SDS-PAGE Gel | 10-12% Bis-Tris pre-cast gel or hand-cast gel [3] |
| Ubiquitin Standards | Defined chain-length ubiquitin polymers (e.g., di-Ub, tri-Ub, tetra-Ub) |
| DUB Inhibitors | 50-100 mM N-ethylmaleimide (NEM) or iodoacetamide (IAA) in lysis buffer [3] |
| Protein Ladder | Pre-stained protein molecular weight standard |
| Transfer Buffer | Appropriate formulation for subsequent western blotting |
Equipment
- Vertical electrophoresis system compatible with pre-cast gels
- Power supply capable of constant voltage operation
- Gel imaging system or western blot transfer apparatus
- Microcentrifuge and heating block
Procedure
Sample Preparation
4.1.1 Preserve the ubiquitination state during cell lysis by including DUB inhibitors. Use 50-100 mM N-ethylmaleimide (NEM) in lysis buffer, as higher concentrations better preserve K63- and M1-linked chains compared to iodoacetamide [3].
4.1.2 For proteasome-targeted proteins, treat cells with MG132 (10-20 µM) for 4-6 hours prior to lysis to prevent degradation of ubiquitylated species [3].
4.1.3 Prepare samples in Laemmli buffer containing 1% SDS and 50 mM DTT. Heat denature at 95°C for 5 minutes.
Gel Electrophoresis
4.2.1 Assemble the gel electrophoresis unit and fill both inner and outer chambers with 1X MES running buffer.
4.2.2 Load protein ladder and samples (recommended: 20-30 µg per lane for ubiquitin immunoblotting).
4.2.3 Run electrophoresis at constant voltage:
- 150V for 10 minutes for initial stacking
- 200V for approximately 45 minutes or until dye front reaches bottom of gel
4.2.4 Terminate electrophoresis when the 10 kDa marker (representing mono-ubiquitin) has migrated appropriately for optimal separation of 2-5 ubiquitin units (approximately 20-55 kDa range).
Post-Electrophoresis Analysis
4.3.1 Process gel for western blotting using polyvinylidene difluoride (PVDF) membrane for optimal ubiquitin detection [3].
4.3.2 Probe with appropriate primary antibodies (e.g., anti-ubiquitin, linkage-specific ubiquitin antibodies, or target protein antibodies).
Data Analysis and Interpretation
Table 2: Expected Migration of Ubiquitin Oligomers in MES Buffer Systems
| Ubiquitin Species | Theoretical Mass (kDa) | Expected Position | Key Applications |
|---|---|---|---|
| Mono-Ub | 8.5 | ~10 kDa | Modification confirmation |
| Di-Ub | 17 | 20-25 kDa | Linkage type differentiation |
| Tri-Ub | 25.5 | 30-38 kDa | Chain initiation analysis |
| Tetra-Ub | 34 | 40-50 kDa | Proteasomal targeting signal |
| Penta-Ub | 42.5 | 52-60 kDa | Degradation commitment |
Expected outcomes: When optimized, MES buffer provides clear resolution of individual ubiquitin oligomers in the 2-5 ubiquitin unit range, with distinct bands visible for each chain length. This enables accurate determination of ubiquitin chain length distribution and facilitates comparison between experimental conditions.
Troubleshooting
Table 3: Troubleshooting Common Issues
| Problem | Potential Cause | Solution |
|---|---|---|
| Poor resolution of short chains | Incorrect buffer pH | Prepare fresh MES buffer, verify pH ~7.3 |
| Smearing of ubiquitin signals | Incomplete DUB inhibition | Increase NEM concentration to 100 mM |
| Lack of expected bands | Proteasomal degradation | Optimize MG132 treatment duration |
| Uneven band migration | Old or improperly prepared buffer | Use freshly prepared MES running buffer |
Method Workflow
The following diagram illustrates the complete experimental workflow from sample preparation to analysis:
Complementary Techniques
For comprehensive ubiquitin chain characterization, combine MES-based separation with:
- Linkage-specific deubiquitinases (UbiCRest) to determine chain topology [9]
- Middle-down mass spectrometry for detailed structural analysis [23]
- Linkage-specific ubiquitin antibodies to confirm chain type [24]
- Komander et al., Biochemical and Biophysical Research Communications, 2015 (Optimizing methods for ubiquitin chain analysis) [3]
- Mevissen et al., Nature Protocols, 2015 (UbiCRest methodology) [9]
- Xu and Peng, Analytical Chemistry, 2008 (Middle-down MS for ubiquitin chains) [23]
Within the complex study of ubiquitin signaling, the resolution of polyubiquitin (pUb) chains by immunoblotting is a fundamental technique. The versatility of ubiquitin signaling arises from its ability to form polymers (chains), where ubiquitin molecules are linked through one of seven lysine residues or the N-terminal methionine. These chains of varying lengths and topologies regulate diverse cellular processes, from protein degradation to DNA repair and immune signaling [9] [3]. However, a significant analytical challenge is that pUb chains often do not migrate on SDS-PAGE gels strictly according to their molecular weight, but also according to their molecular shape and linkage type [9].
The choice of electrophoresis buffer system is critical to overcoming this challenge. While MES buffer is superior for resolving shorter ubiquitin oligomers (2-5 ubiquitin units), this protocol establishes that MOPS buffer is the optimal choice for the effective separation of long polyubiquitin chains containing eight or more ubiquitin units [3]. This procedure is designed for researchers characterizing pUb chains in the context of signaling pathways, proteasomal degradation, or drug development, such as in the study of PROTAC-induced ubiquitination [11].
Principle and Rationale
The primary objective of using MOPS buffer is to achieve clear separation of high molecular weight pUb smears, which is essential for accurate analysis. Ubiquitinated proteins often appear as high-molecular weight 'smears' rather than discrete bands. This heterogeneity results from the protein being modified at multiple sites with monoubiquitin, from the attachment of different chain types that migrate differently, and most importantly, from variations in polyubiquitin chain length [9].
The MOPS-based buffer system provides superior resolution in the high molecular weight range where long pUb chains migrate. In contrast, MES buffer offers excellent resolution for smaller ubiquitin oligomers but is less effective for longer chains. Tris-Acetate (TA) buffers represent an alternative for resolving proteins in the 40-400 kDa range, but MOPS is specifically indicated for chains of eight or more ubiquitins [3]. Using an inappropriate buffer system can lead to poor resolution, misinterpretation of results, and failure to detect critical ubiquitination events.
Materials and Reagents
Research Reagent Solutions
| Reagent / Material | Function / Application in Ubiquitin Research |
|---|---|
| MOPS SDS Running Buffer | Optimal resolution of long pUb chains (>8 ubiquitins) by SDS-PAGE [3]. |
| DUB Inhibitors (NEM, IAA) | Preserve the native ubiquitination state during lysis by alkylating active site cysteines of deubiquitinases (DUBs). NEM is preferred for MS follow-up [3]. |
| Tandem-repeated Ubiquitin-Binding Entities (TUBEs) | High-affinity affinity matrices to capture and enrich polyubiquitinated proteins from cell lysates, protecting chains from DUBs and proteasomal degradation [3] [11]. |
| Linkage-specific Deubiquitinases (DUBs) | Enzymes like OTUB1 (K48-specific) and AMSH (K63-specific) are used in UbiCRest assays to decipher linkage types within pUb chains [9] [25]. |
| Proteasome Inhibitor (MG132) | Prevents degradation of proteasome-targeted ubiquitinated proteins, facilitating their detection [3]. |
| Linkage-specific Ubiquitin Antibodies | Immunodetection of specific chain types (e.g., K48, K63, M1) after separation [9] [19]. |
Reagent Formulations
MOPS Running Buffer (10X):
- 500 mM MOPS (3-(N-morpholino)propanesulfonic acid)
- 500 mM Tris Base
- 10% SDS
- 10 mM EDTA
- Adjust to pH 7.7 with HCl. Dilute to 1X with deionized water before use.
Cell Lysis Buffer (with DUB inhibitors):
- 50 mM Tris-HCl, pH 7.5
- 150 mM NaCl
- 1% NP-40 or IGEPAL CA-630
- 50 mM N-Ethylmaleimide (NEM) or 50 mM Iodoacetamide (IAA)
- 10 mM EDTA
- Protease Inhibitor Cocktail
- 10 µM MG132 (optional, for proteasome inhibition)
Step-by-Step Protocol
Sample Preparation and Preservation of Ubiquitination
Cell Lysis:
- Aspirate culture medium and wash cells once with ice-cold PBS.
- Lyse cells directly in the recommended lysis buffer containing 50 mM NEM (or IAA) and 10 mM EDTA. Note: The high concentration of NEM/IAA is critical for complete DUB inhibition [3].
- Scrape adherent cells and transfer the lysate to a pre-chilled microcentrifuge tube.
- Incubate on ice for 15-30 minutes with occasional vortexing.
Clarification:
- Centrifuge lysates at >15,000 × g for 15 minutes at 4°C to pellet insoluble debris.
- Carefully transfer the supernatant (cleared lysate) to a new pre-chilled tube.
Gel Electrophoresis with MOPS Buffer
Gel Selection:
- Use pre-cast polyacrylamide gradient gels (e.g., 4-12% or 4-15%) for optimal resolution across a broad molecular weight range. Alternatively, low-percentage single-percentage gels (e.g., 8%) can be used but offer less resolution for shorter chains.
Electrophoresis Setup:
- Dilute the 10X MOPS Running Buffer to 1X with deionized water. Fill both the inner (cathode) and outer (anode) chambers.
- Load equal amounts of protein (20-30 µg recommended) alongside a pre-stained protein ladder capable of spanning the high molecular weight range.
- Run the gel at a constant voltage of 150-180 V. Initial conditions can be lower (e.g., 80 V) for better stacking, followed by higher voltage for separation through the resolving gel.
Termination:
- Stop the electrophoresis when the dye front is approximately 0.5-1 cm from the bottom of the gel.
Post-Electrophoresis Analysis
Protein Transfer:
- For high molecular weight ubiquitinated proteins, use wet or semi-dry transfer systems to transfer proteins from the gel to a PVDF or nitrocellulose membrane. Ensure efficient transfer of large complexes.
Immunoblotting:
- Block the membrane with 5% non-fat milk or BSA in TBST for 1 hour at room temperature.
- Incubate with primary antibodies (e.g., anti-ubiquitin, anti-target protein, or linkage-specific antibodies) diluted in blocking buffer overnight at 4°C.
- After washing, incubate with an appropriate HRP-conjugated secondary antibody for 1 hour at room temperature.
- Develop using enhanced chemiluminescence (ECL) substrate and visualize.
Data Analysis and Interpretation
Expected Results and Buffer Performance
The table below summarizes the quantitative performance of different buffer systems for resolving pUb chains, based on empirical data [3].
| Buffer System | Optimal Separation Range (Ub Units) | Key Applications and Performance Notes |
|---|---|---|
| MOPS Buffer | >8 Ub units (Long chains) | Superior resolution for long polyubiquitin chains. Ideal for visualizing heterogeneous smears of heavily ubiquitinated proteins. |
| MES Buffer | 2-5 Ub units (Short chains) | Provides improved resolution for small ubiquitin oligomers like di-, tri-, and tetra-ubiquitin. |
| Tris-Acetate (TA) Buffer | 40-400 kDa proteins | An alternative for resolving proteins in a broad high molecular weight range, but not specifically optimized for pUb chain separation. |
| Tris-Glycine (TG) Buffer | Up to ~20 Ub units (with 8% gel) | A versatile, common system capable of separating long chains but with lower resolution compared to MOPS for chains >8 units. |
When successfully executed, immunoblots of pUb chains developed under the MOPS buffer system will display a clear, well-resolved smear of high molecular weight species. In contrast, the same sample run in a MES buffer system may show poor resolution and compression of these long chains at the top of the gel.
Downstream Workflow for Ubiquitin Chain Characterization
The following workflow diagram illustrates how MOPS-based separation integrates into a comprehensive ubiquitin chain analysis pipeline, from sample preparation to linkage identification.
Troubleshooting Guide
| Problem | Potential Cause | Solution |
|---|---|---|
| Poor resolution of long chains | Incorrect buffer system; Gel percentage too high | Confirm use of MOPS buffer and a low-percentage or gradient gel. |
| Absence of ubiquitin signal | Inefficient DUB inhibition; Protein degradation | Increase concentration of NEM/IAA to 50 mM in lysis buffer. Include proteasome inhibitor (MG132). |
| High background in blot | Non-specific antibody binding | Optimize antibody dilution; increase blocking time; use BSA instead of milk for blocking. |
| Smearing throughout entire lane | Overloaded protein; Incomplete denaturation | Reduce the amount of loaded protein; ensure sample buffer contains fresh DTT/BME and boiling was complete. |
Applications in Ubiquitin Research
The MOPS-based separation protocol is a critical component in advanced ubiquitin research methodologies:
- Analysis of Branched Ubiquitin Chains: The method is vital for studying complex heterotypic/branched chains, which are increasingly recognized as important signals. The UbiCRest technique [9], which relies on initial gel separation, can be used to identify such architectures.
- Drug Discovery and PROTAC Profiling: Characterizing the ubiquitin chains induced by PROTACs or molecular glues is essential for understanding their mechanism of action. This protocol enables the assessment of whether a degrader induces long K48-linked chains (for degradation) or other chain types [11].
- Signaling Pathway Dissection: It facilitates the study of linkage-specific ubiquitination in pathways like STING-mediated innate immunity, where K63- and M1-linked chains are formed [19], or in DNA damage bypass, where chain linkage dictates the functional outcome for PCNA [26].
Ubiquitination is a crucial post-translational modification that regulates virtually all cellular processes, from protein degradation to DNA repair and immune signaling [27]. The functional diversity of ubiquitin signaling arises from the ability to form polyubiquitin chains of various linkages and architectures. The ubiquitin code refers to the concept that different chain topologies—such as K48-linked (typically for proteasomal degradation), K63-linked (often for non-degradative signaling), and even complex branched chains (e.g., K11/K48)—encode distinct functional outcomes for the modified substrate [27] [28] [29].
Deciphering this code requires techniques that can resolve these different ubiquitin forms, making western blot analysis a fundamental tool. The separation of polyubiquitin chains is highly dependent on gel percentage and buffer system selection. This guide provides detailed methodologies for optimizing ubiquitin immunoblotting, specifically framed within research comparing MES and MOPS buffer systems for resolving complex polyubiquitin chains.
The Scientist's Toolkit: Essential Reagents for Ubiquitin Research
Table 1: Key Research Reagents for Ubiquitin Analysis
| Reagent / Tool | Function / Application | Examples / Specifications |
|---|---|---|
| Bis-Tris Gels | Superior stability and resolution over a wide pH range compared to Tris-Glycine gels. | NuPAGE 4-12% Bis-Tris gels [30] |
| MOPS Buffer | Optimal for resolving proteins in the mid-range; ideal for separating polyubiquitin chains. | Run at 200V for ~50 min; resolves proteins ~10-200 kDa [30] |
| MES Buffer | Optimal for resolving smaller proteins and peptides; provides better low MW separation. | Run at 200V for ~50 min; resolves proteins ~1-60 kDa [30] |
| Denaturing Lysis Buffer | Preserves ubiquitination state by denaturing enzymes; critical for accurate detection. | Urea-based lysis buffer (e.g., 10 M Urea, 300 mM NaCl, 100 mM Phosphate buffer) [30] |
| Protease Inhibitors | Prevent co-purifying proteases from degrading ubiquitin and substrate proteins. | cOmplete EDTA-free Protease Inhibitor Cocktail [30] |
| Linkage-Selective Tools | Engineered enzymes to study functions of specific ubiquitin linkages in live cells. | enDUBs (e.g., OTUD1 for K63, OTUD4 for K48 chains) [27] |
| Ubiquitin Mutants | Used to identify linkage types or block specific chain formation in functional assays. | Ub-K48R, Ub-K63R, Ub-K29R [28] [29] |
Gel Electrophoresis: Selecting the Optimal System
Gel Percentage and Buffer Selection Guide
The choice of gel percentage and running buffer is critical for resolving the different molecular weights of mono-ubiquitin (~8.6 kDa) and various polyubiquitin chains, which can exceed 50 kDa.
Table 2: Gel and Buffer Selection for Ubiquitin Chain Resolution
| Parameter | MES SDS Running Buffer | MOPS SDS Running Buffer |
|---|---|---|
| Optimal Resolving Range | Lower molecular weight proteins and peptides (≈1-60 kDa) [30] | Middle molecular weight proteins (≈10-200 kDa) [30] |
| Ideal For | High-resolution separation of mono-ubiquitin, short-chain ubiquitin (e.g., di-Ub, tri-Ub), and UBL proteins. | Resolving a broad spectrum of polyubiquitin chains, including longer homo- and heterotypic chains. |
| Typical Gel | 4-12% Bis-Tris gradient gel [30] | 4-12% Bis-Tris gradient gel [30] |
| Running Conditions | 200 V for approximately 50 minutes [30] | 200 V for approximately 50 minutes [30] |
| Context in Ubiquitin Research | Ideal for studies focusing on the initiation of ubiquitination, mono-ubiquitination, or small UBL modifiers like UFM1 [30]. | Preferred for analyzing complex polyubiquitination patterns and chain elongation, as encountered in RQC or DNA damage response [29]. |
Detailed Protocol for Gel Electrophoresis
Materials:
- NuPAGE 4-12% Bis-Tris Protein Gels (or equivalent)
- NuPAGE MES or MOPS SDS Running Buffer (20X)
- Cell lysate in denaturing buffer (e.g., containing 10 M urea) [30]
- Reducing agent (e.g., DTT) [30]
- Heating block or water bath
Procedure:
- Sample Preparation: Dilute cell lysates in 1X Laemmli buffer containing a reducing agent like 50-100 mM DTT. Heat samples at 70-95°C for 5-10 minutes to fully denature proteins [30].
- Buffer Preparation: Dilute the 20X MES or MOPS SDS Running Buffer stock to 1X in deionized water. A single 1L pack is sufficient for a mini-gel apparatus.
- Gel Loading: Load 10-30 µg of total protein per well alongside a pre-stained protein ladder. Include a positive control (e.g., HEK293 cell lysate known to have polyubiquitinated proteins) if available [30] [27].
- Electrophoresis: Assemble the gel electrophoresis unit, fill the chambers with the 1X running buffer, and run at a constant voltage of 200 V for approximately 50 minutes, or until the dye front has reached the bottom of the gel.
Western Blot Transfer: Conditions for Optimal Ubiquitin Detection
Standard Wet Transfer Protocol
Efficient transfer of ubiquitinated proteins, which can range from very small to very large, is crucial. A standard wet transfer system provides flexibility and high efficiency.
Materials:
- Nitrocellulose or PVDF membrane
- Transfer buffer (e.g., Tris-Glycine)
- Methanol
- Wet transfer apparatus
Procedure:
- Membrane Preparation: Cut the nitrocellulose or PVDF membrane and filter paper to the size of the gel. If using PVDF, activate it by soaking in 100% methanol for 1 minute.
- Transfer Stack Assembly: In a tray filled with transfer buffer, assemble the transfer stack in the following order (cassette cathode to anode):
- Sponge / Filter Pad
- Filter Paper
- Gel
- Membrane
- Filter Paper
- Sponge / Filter Pad Ensure no air bubbles are trapped between the gel and membrane by rolling a roller or serological pipette over the stack.
- Transfer: Place the cassette in the transfer tank filled with chilled transfer buffer. Perform the transfer at a constant voltage of 100 V for 90 minutes in a cold room or with an ice pack to dissipate heat. Alternatively, for higher molecular weight complexes, a longer transfer at 30 V overnight at 4°C can be more effective.
Alternative: Semi-Dry Transfer
For faster transfers, a semi-dry system can be used. The transfer time must be optimized based on gel thickness and protein size.
Procedure:
- Prepare the transfer stack as above, using anode - filter paper - membrane - gel - filter paper - cathode.
- Transfer at a constant current of 0.5 - 1.0 mA per cm² of membrane area for 30-60 minutes.
Experimental Workflow & Pathway Analysis
The following diagram visualizes the core experimental workflow for analyzing polyubiquitin chains, from cell culture to data interpretation, highlighting key decision points like buffer selection.
Application Notes: Resolving Polyubiquitin Chains with MES vs. MOPS
The choice between MES and MOPS is not merely technical but experimental, dictated by the specific biological question.
Use MES Buffer When: Your research focuses on mono-ubiquitination, the activity of small ubiquitin-like modifiers (UBLs), or the initial stages of chain formation. For instance, when studying UFMylation (involving UFM1, a 9-kDa UBL protein), MES buffer provides superior resolution in the lower molecular weight range, allowing clear separation of modified and unmodified forms [30]. It is also ideal for resolving di- and tri-ubiquitin chains for linkage-specific analysis.
Use MOPS Buffer When: Your goal is to analyze complex polyubiquitination patterns, such as those formed during Ribosome-associated Quality Control (RQC) or DNA damage response. In RQC, K63-linked chains on uS10 are key signals, and mixed/branched chains (e.g., K48/K63) also form, creating a spectrum of high molecular weight species [29]. MOPS buffer's broader resolving range (up to 200 kDa) is essential for characterizing these complex "ubiquitin codes" and investigating the functions of specific linkages using tools like engineered deubiquitinases (enDUBs) [27].
Troubleshooting Common Issues
- Smearing in the High MW Region: This can indicate over-transfer or the presence of complex, heterogeneous ubiquitin chains. Solution: Optimize transfer time; use MOPS buffer for better resolution; confirm the use of denaturing lysis conditions to disrupt non-covalent interactions [30].
- Poor Transfer Efficiency for High MW Ubiquitin Chains: Solution: Ensure the transfer buffer contains methanol (for PVDF) and consider switching to a wet transfer system with longer transfer times (e.g., overnight at 30V).
- Weak or No Signal: Solution: Verify that protease inhibitors were included in the lysis buffer. Check antibody specificity for ubiquitin vs. specific linkages. Ensure samples were not over-reduced, as this can interfere with some epitopes.
The analysis of post-translational modifications, particularly ubiquitination, presents significant challenges in protein science. Protein ubiquitylation is a versatile and reversible modification with regulatory roles extending far beyond proteasome-dependent degradation, including cellular signaling, trafficking, cell division cycle control, and DNA repair [3]. As research in this area grows exponentially, the experiments aimed at enhancing our understanding of this process must be conducted to the highest standards of quality control, yet clear guidelines for standardised methodologies remain scarce [3]. The separation of polyubiquitin chains, which can contain over 20 ubiquitin units adding more than 200 kDa to a protein's molecular mass, requires specialized electrophoretic separation conditions to preserve resolution across a wide molecular weight range [3] [8].
The choice between MES (2-(N-morpholino)ethanesulfonic acid) and MOPS (3-(N-morpholino)propanesulfonic acid) buffer systems represents a critical methodological decision that profoundly impacts downstream applications including Coomassie staining, western blotting, and mass spectrometry. These zwitterionic biological buffers with pKa values of 6.5-7.9 and 7.0-7.4 respectively, provide distinct separation characteristics that can be leveraged for specific analytical goals [31]. This application note provides a structured framework for selecting and optimizing buffer systems to enhance data quality when studying complex ubiquitination patterns, with particular emphasis on integrating these systems with downstream detection and analysis methods.
Buffer System Fundamentals and Separation Characteristics
Chemical Properties and Mechanism of Action
MES and MOPS belong to the "Good's buffers" family, characterized by their zwitterionic nature, high solubility, minimal interference with biological systems, and consistent pKa values across temperature variations [31]. In discontinuous SDS-PAGE systems, these buffers function as trailing ions in the Tris-based running buffer, with chloride or acetate serving as leading ions [32]. The NuPAGE Bis-Tris discontinuous buffer system, for instance, utilizes a lower pH gel buffer (pH 6.4) and running buffer (pH 7.3-7.7) resulting in a significantly lower operating pH of 7 during electrophoresis compared to traditional Laemmli systems [32]. This neutral pH environment maximizes stability of both proteins and gel matrix, providing better band resolution while minimizing protein modifications such as deamidation that can occur at alkaline pH [32].
Resolution Profiles for Polyubiquitin Chains
The separation characteristics of MES and MOPS buffers differ significantly across molecular weight ranges, making them preferentially suitable for specific ubiquitination patterns.
Table 1: Buffer Performance Characteristics for Ubiquitin Chain Separation
| Buffer System | Optimal Separation Range | Ubiquitin Chain Resolution | Gel Compatibility | Downstream Advantages |
|---|---|---|---|---|
| MES | Lower MW range (1-100 kDa) | Superior for small ubiquitin oligomers (2-5 ubiquitins) | Bis-Tris pre-cast gels | Excellent for mono-ubiquitylation and short chains; compatible with MS |
| MOPS | Middle to High MW range (50-200 kDa) | Improved resolution for chains containing eight or more ubiquitins | Bis-Tris pre-cast gels | Ideal for long polyubiquitin chains; reduces smearing in western blotting |
| Tris-Acetate | High MW range (36-400 kDa) | Effective for very large polyubiquitinated proteins (>400 kDa) | Tris-Acetate pre-cast gels | Superior transfer efficiency for high molecular weight complexes |
| Tris-Glycine | Broad range (10-250 kDa) | Good separation up to 20 ubiquitin units with 8% gels | Traditional Laemmli gels | Versatile; familiar to most laboratories; cost-effective |
When using pre-poured gradient gels, MES buffer gives improved resolution of relatively small ubiquitin oligomers comprising 2-5 ubiquitins, whereas MOPS buffer gives improved resolution of polyubiquitin chains containing eight or more ubiquitins [3]. For researchers focusing on mono-ubiquitylation or short ubiquitin chains, MES buffer paired with higher percentage gels (12%) provides optimal resolution, though at the expense of reducing the resolution/separation of longer polyubiquitin chains [3]. Alternatively, MOPS buffer with lower percentage gels (8%) better resolves the long smears characteristic of extensively polyubiquitinated proteins [8].
Integrated Experimental Protocols
Protocol 1: Preserving Ubiquitylation Status During Sample Preparation
Principle: Protein ubiquitylation is reversible and can be lost through hydrolysis catalyzed by deubiquitylases (DUBs) during sample preparation. Additionally, most ubiquitin linkages target proteins for proteasomal degradation, necessitating inhibition of this process [3] [8].
Reagents and Solutions:
- Cell Lysis Buffer: 50 mM Tris-HCl (pH 7.5), 150 mM NaCl, 1% NP-40
- DUB Inhibitors: 50-100 mM N-ethylmaleimide (NEM) or 5-10 mM iodoacetamide (IAA) [3] [8]
- Metal Chelators: 10 mM EDTA or EGTA [3]
- Proteasome Inhibitor: 10-50 µM MG132 (from 10 mM stock in DMSO) [3]
- Phosphatase Inhibitors: 1 mM sodium orthovanadate, 10 mM sodium fluoride (optional)
- Complete protease inhibitor cocktail (without EDTA)
Procedure:
- Pre-treat cells with MG132 for 4-6 hours before harvesting to inhibit proteasomal degradation [3].
- Prepare fresh lysis buffer containing all inhibitors immediately before use.
- Harvest cells and lyse in pre-chilled lysis buffer (1 mL per 10⁷ cells) for 30 minutes on ice.
- Clarify lysates by centrifugation at 16,000 × g for 15 minutes at 4°C.
- Transfer supernatant to a fresh tube and proceed immediately to protein quantification and SDS-PAGE.
Critical Notes:
- NEM is preferred over IAA for mass spectrometry workflows as IAA modification adds 114 Da, identical to the Gly-Gly dipeptide remnant after trypsin digestion of ubiquitylated proteins, potentially interfering with ubiquitylation site identification [3].
- Avoid prolonged (12-24 hour) MG132 treatment as it can induce cellular stress responses that alter ubiquitylation patterns [3] [8].
- For particularly labile ubiquitin chains (K63 and M1 linkages), higher concentrations of NEM (up to 100 mM) may be necessary for preservation [3] [8].
Protocol 2: Optimized Electrophoresis for Ubiquitin Chain Separation
Principle: Effective separation of ubiquitin chains requires matching buffer systems and gel percentages to the target molecular weight range [3] [32].
Reagents and Solutions:
- Pre-cast Bis-Tris gels (8-12% depending on target size range)
- MES SDS Running Buffer: 50 mM MES, 50 mM Tris Base, 0.1% SDS, 1 mM EDTA, pH 7.3 [32]
- MOPS SDS Running Buffer: 50 mM MOPS, 50 mM Tris Base, 0.1% SDS, 1 mM EDTA, pH 7.7 [32]
- LDS Sample Buffer (4X) [32]
- Reducing Agent (500 mM DTT or 1 M DTT) [32]
Procedure:
- Prepare samples using 1X LDS sample buffer with reducing agent and heat at 70°C for 10 minutes [32].
- Load 10-30 µg protein per lane for western blotting or 1-5 µg for silver staining.
- Assemble electrophoresis apparatus with appropriate running buffer.
- Run gels at constant voltage (150-200 V) for approximately 50 minutes or until dye front reaches bottom.
- Proceed to staining, transfer, or mass spectrometry preparation.
Critical Notes:
- For small ubiquitin chains (2-5 ubiquitins), use MES buffer with 10-12% Bis-Tris gels [3].
- For long polyubiquitin chains (8+ ubiquitins), use MOPS buffer with 8-10% Bis-Tris gels [3].
- For very large polyubiquitinated complexes (>400 kDa), Tris-Acetate gels with Tris-Acetate SDS running buffer provide superior resolution [32].
Protocol 3: Enhanced Western Blot Transfer for Ubiquitinated Proteins
Principle: Efficient transfer of high molecular weight ubiquitinated proteins requires optimization of membrane composition, buffer formulation, and transfer conditions [33] [34] [8].
Reagents and Solutions:
- Transfer Buffer: 25 mM Tris, 192 mM glycine, 0.1% SDS, 20% methanol [33]
- Methanol-free Transfer Buffer (for PVDF): 25 mM Tris, 192 mM glycine [33]
- PVDF membrane (0.2 µm pore size for small ubiquitin chains) [8]
- Nitrocellulose membrane (0.45 µm for general applications)
- Filter paper and transfer sponges
Procedure:
- Activate PVDF membrane in 100% methanol for 1-2 minutes, then equilibrate in transfer buffer for 5 minutes [33].
- Prepare gel/membrane sandwich in the order: cathode (> sponge > filter paper > gel > membrane > filter paper > sponge > anode) [33] [34].
- For wet transfer, assemble sandwich and place in tank filled with transfer buffer.
- Transfer at 30 V for 2.5 hours at 4°C for optimal preservation of ubiquitin chain structure and antibody recognition [8].
- For large proteins (>100 kDa), include 0.1% SDS and reduce methanol to 10% or less to prevent precipitation [33].
- Post-transfer, verify efficiency using Ponceau Red staining or post-stain the gel with Coomassie to detect residual proteins [33] [34].
Critical Notes:
- PVDF membranes generally provide higher signal strength for ubiquitin detection compared to nitrocellulose [8].
- Faster transfer times can cause ubiquitin chains to unfold, potentially interfering with linkage-specific antibody binding [8].
- For small ubiquitinated proteins (<30 kDa), omit SDS from the transfer buffer to enhance membrane binding [33].
Protocol 4: Membrane Fixation for Enhanced Detection Sensitivity
Principle: Protein loss from membranes during incubation and washing steps decreases sensitivity and reproducibility. Fixation methods can greatly improve protein retention [35].
Reagents and Solutions:
- Acetone (pre-chilled to 0°C)
- Methanol (50% in deionized water for nitrocellulose)
- TBST: 25 mM Tris, 150 mM NaCl, 0.1% Tween 20, pH 7.5
Procedure for PVDF Membranes:
- Following transfer, immerse membrane in pre-chilled acetone (0°C) for 30 minutes [35].
- Transfer membrane to 50°C oven and heat for 30 minutes [35].
- Proceed with standard blocking and immunodetection protocols.
Procedure for Nitrocellulose Membranes:
- Following transfer, immerse membrane in 50% methanol/water (v/v) at 0°C for 30 minutes [35].
- Transfer membrane to 50°C oven and heat for 30 minutes [35].
- Proceed with standard blocking and immunodetection protocols.
Critical Notes:
- This fixation approach increases detection intensity 2.8- to 15-fold for lectin blotting and 1.8- to 16-fold for immunoblotting compared to non-fixed controls [35].
- Heating beyond 50°C gradually decreases detection efficiency [35].
- For glycoprotein detection, this method significantly improves sensitivity for low-abundance targets.
Downstream Analysis Integration
Coomassie Staining and Quantification
Compatibility with Buffer Systems: Both MES and MOPS buffers are fully compatible with standard Coomassie staining protocols. The neutral pH conditions of Bis-Tris gels run with MES or MOPS buffers actually enhance protein stability during electrophoresis, resulting in sharper bands that stain more predictably [32]. For post-transfer assessment, gels can be stained with Coomassie to evaluate transfer efficiency - a clear gel indicates successful transfer, while residual protein bands suggest incomplete transfer [34].
Staining Protocol:
- Following electrophoresis or transfer, immerse gel in Coomassie staining solution (40% distilled water, 10% acetic acid, 50% methanol, 0.25% Coomassie Brilliant Blue R-250) for 4 hours to overnight [33].
- Destain with multiple changes of destaining solution (67.5% distilled water, 7.5% acetic acid, 25% methanol) until background is clear and protein bands are visible [33].
- For quantitative analysis, scan gels and use densitometry software to measure band intensity.
Critical Applications:
- Copper staining provides a reversible alternative that doesn't fix proteins in the gel, allowing subsequent transfer to membranes [33].
- Coomassie staining of PVDF membranes after transfer provides a loading control alternative to housekeeping proteins [33].
Mass Spectrometry Sample Preparation
Principle: Bottom-up proteomics approaches digest proteins into peptides for MS analysis, requiring careful sample preparation to preserve ubiquitylation sites while ensuring compatibility with MS instrumentation [36] [37].
Key Steps for Ubiquitin Enrichment and Identification:
- Protein Digestion: Use suspension trapping (S-Trap) columns for efficient digestion and cleanup, especially for complex samples [36].
- Reduction and Alkylation: Reduce with DTT (45 min, 60°C) and alkylate with iodoacetamide (1 hr in dark) to prevent disulfide bond reformation [37].
- Enzyme Selection: Trypsin is most common, cleaving after lysine and arginine residues. For improved sequence coverage, consider alternative enzymes like Lys-C, which generates larger peptide fragments [37].
- Desalting and Cleanup: Use C18 tips or columns to remove salts, detergents, and buffers that interfere with MS analysis [36] [37].
- Fractionation: High-pH fractionation separates peptides by hydrophobicity to enhance proteome coverage for complex samples [36].
Buffer Compatibility Notes:
- MES and MOPS do not interfere with Bradford or bicinchoninic acid (BCA) protein assays but can interfere with Lowry protein determination [31].
- For MS compatibility, ensure complete removal of electrophoresis buffers before digestion through precipitation or dialysis procedures.
Table 2: Research Reagent Solutions for Ubiquitin Analysis
| Reagent Category | Specific Products | Function in Workflow | Application Notes |
|---|---|---|---|
| DUB Inhibitors | N-Ethylmaleimide (NEM), Iodoacetamide (IAA) | Preserve ubiquitin chains during lysis | Use 50-100 mM NEM for K63 linkages; IAA interferes with MS identification of ubiquitylation sites |
| Proteasome Inhibitors | MG132, Bortezomib | Prevent degradation of ubiquitylated proteins | Limit treatment to 4-6 hours to avoid stress-induced ubiquitylation |
| Electrophoresis Buffers | MES SDS, MOPS SDS, Tris-Acetate | Optimal separation of different ubiquitin chain lengths | MES for small chains (2-5 ubiquitins); MOPS for long chains (8+ ubiquitins) |
| Transfer Membranes | PVDF (0.2 µm), Nitrocellulose (0.45 µm) | Immobilize proteins for detection | PVDF provides higher signal for ubiquitin; smaller pore size better for small chains |
| Mass Spectrometry | S-Trap columns, C18 tips, Trypsin | Digest and prepare samples for MS analysis | S-Trap allows direct digestion in detergent; essential for membrane proteins |
Workflow Integration and Decision Framework
The integration of buffer selection with downstream applications requires a systematic approach to experimental design. The following workflow diagrams illustrate optimized pathways for different research objectives in ubiquitin characterization.
Diagram 1: Integrated workflow for ubiquitin characterization showing critical decision points from sample preparation through downstream analysis.
Troubleshooting and Data Interpretation
Common Challenges and Solutions
Poor Resolution of Ubiquitin Chains:
- Problem: Smearing rather than discrete bands.
- Solution: Optimize buffer system selection (MES for small chains, MOPS for large chains), ensure fresh DUB inhibitors, and use appropriate gel percentages.
Weak Signal in Western Blotting:
- Problem: Faint or absent bands despite known modification.
- Solution: Implement membrane fixation protocol (acetone treatment + heating), optimize transfer conditions for large proteins, and use PVDF membranes with 0.2 µm pore size for smaller ubiquitin chains [35].
Inconsistent Mass Spectrometry Identification:
- Problem: Failure to identify ubiquitylation sites.
- Solution: Use NEM instead of IAA during sample preparation, ensure complete removal of electrophoresis buffers, and consider enzymatic alternatives to trypsin for improved coverage.
Data Validation and Quality Control
Ubiquitin-Specific Considerations:
- Always include appropriate controls (DUB inhibitors, proteasome inhibitors) to validate that observed patterns reflect biological reality rather than preparation artifacts.
- When using linkage-specific antibodies, validate specificity with known controls and be aware that recognition efficiency varies between different ubiquitin linkages [8].
- For mass spectrometry data, manually validate automated peptide assignments, particularly for isobaric or near-isobaric dipeptides that software may misassign [38].
The integration of appropriate buffer systems with downstream analytical techniques is essential for generating reliable data in ubiquitin research. The strategic selection between MES and MOPS buffers based on the target ubiquitin chain length, combined with optimized sample preparation, transfer, and detection methods, significantly enhances data quality and reproducibility. By implementing the protocols and decision frameworks outlined in this application note, researchers can overcome common challenges in ubiquitin characterization and obtain more meaningful biological insights from their experiments.
Solving Common Problems: From Smears and Weak Signals to Antibody Pitfalls
Within the study of the ubiquitin-proteasome system, the biochemical resolution of polyubiquitin chains is a foundational technique. The versatility of ubiquitin signaling arises from its capacity to form diverse polyubiquitin chains, which can be linked through any of eight distinct linkage types, leading to a vast combinatorial complexity for biochemical analysis [9]. When separated by SDS-PAGE, these chains often present as indistinct smears, complicating data interpretation. A primary, yet frequently overlooked, factor influencing this resolution is the choice of electrophoresis running buffer. This application note, framed within a broader thesis on resolving polyubiquitin chains, provides a detailed protocol for diagnosing and correcting poor chain resolution by critically evaluating MES and MOPS buffer systems. We present a structured, data-driven approach to help researchers optimize their gel conditions for clear, reproducible results, thereby enabling more accurate analysis of ubiquitin chain architecture and function.
Technical Background: MES vs. MOPS Buffer Systems
The effective separation of polyubiquitin chains by molecular weight is crucial for interpreting western blot data. While the polyacrylamide gel percentage dictates the overall separation range, the electrophoresis running buffer directly impacts the resolution of specific molecular weight species due to differences in ionic strength and buffering capacity.
2.1 Chemical and Functional Properties MES (2-(N-morpholino)ethanesulfonic acid) and MOPS (3-(N-morpholino)propanesulfonic acid) are both morpholine-based zwitterionic buffers. Their key difference lies in their side chain length—an ethyl sulfonic acid group for MES and a propyl sulfonic acid group for MOPS—which results in distinct physicochemical properties [7]. Notably, MOPS possesses a pKa of 7.2 at 20°C, which is closer to physiological pH, while MES, with a pKa of 6.1, is better suited for acidic conditions. Both buffers are highly transparent to UV light, making them compatible with downstream fluorescent detection methods [7].
2.2 Performance Characteristics for Protein Separation The distinct buffering ranges of MES and MOPS make them uniquely suited for resolving proteins of different sizes. MES buffer is the superior choice for resolving smaller proteins and short ubiquitin chains, typically providing optimal separation in the range below 36 kDa [39]. In contrast, MOPS buffer excels in the separation of larger proteins, generally those around 75 kDa and above, making it ideal for resolving longer polyubiquitin polymers [39]. Understanding this size-dependent performance is the first step in troubleshooting poor resolution.
Table 1: Comparative Analysis of MES and MOPS Buffer Systems
| Characteristic | MES Buffer | MOPS Buffer |
|---|---|---|
| Chemical Name | 2-(N-morpholino)ethanesulfonic acid | 3-(N-morpholino)propanesulfonic acid |
| Effective pH Range | 5.5 – 6.7 [7] | 6.5 – 7.9 [7] |
| pKa at 20°C | 6.1 [7] | 7.2 [7] |
| Optimal Resolution Range | Proteins < 36 kDa; short ubiquitin chains (2-5 units) [3] [8] | Proteins ~75 kDa; long ubiquitin chains (8+ units) [3] [8] |
| Primary Application | Resolving small proteins and short ubiquitin oligomers [3] | Resolving large proteins and long polyubiquitin chains [3] |
Experimental Protocol: A Systematic Workflow for Optimization
The following protocol outlines a systematic approach for diagnosing and correcting poor ubiquitin chain resolution, from sample preparation to data analysis.
Diagram 1: A systematic workflow for diagnosing and correcting poor ubiquitin chain resolution on western blots.
Sample Preparation: Preserving the Ubiquitination State
- Inhibit Deubiquitinases (DUBs): To prevent the loss of ubiquitin signals, it is critical to include DUB inhibitors in the cell lysis buffer. Standard concentrations of 5-10 mM N-ethylmaleimide (NEM) are often insufficient. For optimal preservation, especially of K63-linked chains, use NEM at concentrations of 50-100 mM [3] [8]. Iodoacetamide (IAA) is an alternative, but it is less stable and can interfere with mass spectrometry analysis [3].
- Inhibit the Proteasome: To prevent the degradation of ubiquitinated proteins, add a proteasome inhibitor such as MG132 to your cell culture medium prior to lysis and to the lysis buffer itself. Note that prolonged treatment (12-24 hours) can induce cellular stress, potentially confounding results [3] [8].
Electrophoresis and Transfer: A Detailed Procedure
Gel Casting:
- Prepare a 8-12% Tris-Glycine or Bis-Tris polyacrylamide gel. An 8% gel is a good all-rounder for resolving chains up to 20 ubiquitin units, while a 12% gel offers superior resolution for smaller chains and monoubiquitination at the expense of high-molecular-weight separation [8].
- Ensure the gel has fully polymerized before use.
Buffer Selection and Gel Loading:
- Prepare a 1X solution of either MES or MOPS running buffer from a 20X stock, based on the guidance in Table 1 and your experimental goals.
- Load your protein samples alongside an appropriate molecular weight marker. For ubiquitinated proteins, a prestained marker that extends to high molecular weights (e.g., 250 kDa) is recommended.
Electrophoresis Run:
- Assemble the gel apparatus and fill the tank with the selected running buffer.
- Run the gel at a constant voltage of 200V for approximately 50-60 minutes, or until the dye front has reached the bottom of the gel [39].
Protein Transfer:
- For western blotting, use a PVDF membrane with a 0.2 µm pore size for optimal signal strength, particularly for smaller ubiquitin chains [8].
- To ensure efficient transfer of large ubiquitin polymers without unfolding, use a wet transfer system at a constant 30V for 2.5 hours. Faster transfer methods can cause ubiquitin chains to unfold, reducing antibody binding and signal detection [8].
Data Analysis and Interpretation
Quantitative Comparison of Buffer Performance
The following table synthesizes experimental data from direct comparisons of MES and MOPS buffers in resolving defined ubiquitin chains, providing a clear guide for expected outcomes.
Table 2: Buffer Performance for Resolving Defined Ubiquitin Chain Lengths
| Target Ubiquitin Chain Length | Recommended Buffer | Observed Experimental Outcome | Key Considerations |
|---|---|---|---|
| Mono-Ubiquitination & Dimers | MES [3] | Superior separation of low molecular weight species. | Use a 12% gel for best results [8]. |
| Short Chains (2 - 5 ubiquitins) | MES [3] [8] | Clear resolution of individual short chains. | MES buffer is ideal for analyzing chain initiation and short signaling polymers. |
| Long Chains (8+ ubiquitins) | MOPS [3] [8] | Improved separation and sharper bands for high molecular weight polymers. | MOPS is critical for studying degradative signals (e.g., K48 chains) requiring long polymers [40]. |
| Full-Scale Analysis (Mono- to 20+ units) | Tris-Glycine with 8% gel [8] | Good separation across the entire range. | A versatile compromise when analyzing a wide range of chain lengths simultaneously. |
Troubleshooting Common Issues
- Problem: A persistent, unresolved smear across all molecular weights.
- Solution: Revisit sample preparation. Ensure high concentrations of DUB inhibitors (NEM) are fresh and present in the lysis buffer. Confirm proteasome inhibitor activity.
- Problem: Poor resolution in the high molecular weight region even with MOPS buffer.
- Solution: Optimize the transfer conditions. Ensure you are using a slow transfer (30V for 2.5 hours) to prevent incomplete transfer and unfolding of large ubiquitin chains [8].
- Problem: Lack of signal or weak signal for specific linkages.
- Solution: Consider antibody specificity. Many commercial ubiquitin antibodies do not recognize all linkage types equally. For example, some common antibodies poorly recognize M1-linked chains [8]. Validate antibodies using linkage-specific controls if possible.
The Scientist's Toolkit: Essential Research Reagents
Table 3: Key Reagents for Ubiquitin Chain Resolution Studies
| Reagent / Material | Function / Application | Recommended Usage / Notes |
|---|---|---|
| N-Ethylmaleimide (NEM) | Deubiquitinase (DUB) inhibitor. Alkylates active site cysteines of DUBs to preserve ubiquitin chains during lysis. | Use at 50-100 mM in lysis buffer for optimal preservation of K63 and M1 chains [3] [8]. |
| MG132 | Proteasome inhibitor. Prevents degradation of ubiquitinated proteins, allowing for their accumulation and detection. | Add to cell culture prior to lysis. Avoid prolonged treatment (>12h) to prevent stress-induced ubiquitination [3] [8]. |
| PVDF Membrane (0.2 µm) | Western blotting membrane. Binds proteins after transfer for immunodetection. | Preferred over nitrocellulose for stronger ubiquitin signal, especially with smaller chains [8]. |
| MOPS Running Buffer | SDS-PAGE running buffer. Optimized for resolving large proteins and long polyubiquitin chains (>8 ubiquitins) [3] [8]. | Use a 1X concentration for electrophoresis. Compatible with Tris-Glycine and Bis-Tris gel systems. |
| MES Running Buffer | SDS-PAGE running buffer. Optimized for resolving small proteins and short polyubiquitin chains (2-5 ubiquitins) [3] [8]. | Use a 1X concentration for electrophoresis. Ideal for analyzing short-chain ubiquitination events. |
Achieving high-resolution separation of polyubiquitin chains is a prerequisite for accurate biochemical analysis. The choice between MES and MOPS running buffers is not merely a matter of routine but a critical experimental parameter that directly determines the success of the assay. As detailed in this application note, MES buffer is the reagent of choice for resolving short-chain ubiquitination, while MOPS buffer is superior for analyzing long-chain polymers. By adhering to the systematic workflow and optimized protocols provided—with particular emphasis on stringent sample preservation and buffer selection based on analytical goals—researchers can transform uninformative smears into clear, interpretable data, thereby advancing our understanding of the complex ubiquitin code.
Optimizing the Western Blot Transfer to Preserve Ubiquitin Chain Structure and Antigenicity
The study of protein ubiquitylation is fundamental to understanding critical cellular processes, including targeted protein degradation, signal transduction, and immune responses. Western blotting remains a cornerstone technique for the semi-quantitative analysis of these post-translational modifications. However, the labile nature of ubiquitin chains and the considerable size range of polyubiquitylated proteins present significant technical challenges. A poorly optimized transfer step can lead to the loss of antigenicity, incomplete transfer, or smeared results, compromising data interpretation. This application note provides detailed protocols for optimizing the Western blot transfer to faithfully preserve ubiquitin chain structure and antigenicity, framed within broader research on resolving polyubiquitin chains using MES and MOPS buffer systems.
The Critical Role of Electrophoresis and Transfer in Ubiquitin Research
Buffer Systems for Resolving Polyubiquitin Chains
The choice of electrophoresis buffer system directly impacts the resolution of different ubiquitin chain types and lengths. Different gel and running buffers are available for resolving ubiquitylated proteins by SDS-PAGE. As proteins can be modified by 20 or more ubiquitin molecules, adding over 200 kDa to their mass, selecting the appropriate separation system is crucial [3].
Table 1: Buffer System Selection for Ubiquitin Chain Resolution
| Buffer System | Optimal Resolution Range | Key Applications in Ubiquitin Research | Gel Type Compatibility |
|---|---|---|---|
| MES Buffer | Improved resolution of small ubiquitin oligomers (2-5 ubiquitins) [3] | • Analysis of short-chain ubiquitylation• Mono-ubiquitylation studies | Bis-Tris Precast Gels [41] |
| MOPS Buffer | Improved resolution of longer pUb chains (≥8 ubiquitins) [3] | • Analysis of extended polyubiquitin chains• K48- and K63-linked chain analysis | Bis-Tris Precast Gels [41] |
| Tris-Acetate Buffer | Superior for proteins in the 40-400 kDa range [3] | • High molecular weight ubiquitylated proteins• Proteasome-bound complexes | Tris-Acetate Gels [42] |
| Tris-Glycine Buffer | Can separate ubiquitin chains up to 20 ubiquitins long with 8% acrylamide [3] | • General ubiquitylation screening• When high-resolution gels are unavailable | Standard SDS-PAGE Gels |
Preserving Ubiquitination State During Sample Preparation
Before electrophoresis and transfer, preserving the ubiquitination state of proteins during cell lysis is paramount. Ubiquitylation is a reversible modification that can be lost through hydrolysis catalyzed by deubiquitylases (DUBs). To prevent this, include DUB inhibitors in lysis buffers [3].
- DUB Inhibition: Use 50-100 mM N-ethylmaleimide (NEM) or iodoacetamide (IAA) to alkylate the active site cysteine residues of DUBs. NEM is often more effective at preserving K63- and M1-linked chains and is preferred for mass spectrometry workflows [3].
- Proteasome Inhibition: Treat cells with proteasome inhibitors like MG-132 (5-25 µM for 1-2 hours) prior to harvesting to block degradation of ubiquitylated proteins and facilitate their detection. Note that prolonged exposure can cause cytotoxic effects [43].
Optimized Protocol for Western Blot Transfer of Ubiquitinated Proteins
Pre-Transfer Considerations: Gel and Membrane Selection
Gel Composition: For large molecular weight ubiquitylated proteins (>150 kDa), use low-percentage gels (e.g., 7%) with larger pores. Tris-Acetate gels provide higher resolution for large proteins than Bis-Tris or Tris-Glycine gels [42]. Gradient gels (e.g., 4-12%) are excellent for resolving a broad range of protein sizes, including long polyubiquitin chains [41].
Membrane Choice: Use PVDF membranes for large ubiquitylated proteins. PVDF membranes do not require methanol in the transfer buffer, reducing the risk of protein precipitation. Use a pore size of 0.45 µm for proteins >20 kDa to facilitate easier transfer [42].
Transfer Buffer Composition and Conditions
The composition of your transfer buffer is critical for successful transfer of large ubiquitylated proteins without precipitation or loss of antigenicity.
Table 2: Optimized Transfer Conditions for Ubiquitinated Proteins
| Parameter | Standard Condition | Optimized Condition for Ubiquitinated Proteins | Rationale |
|---|---|---|---|
| Methanol Concentration | 20% | 10% or less [42] | Prevents precipitation of large proteins |
| SDS Addition | 0% | Add SDS to a final concentration of 0.1% [42] | Adds uniform negative charge, aiding transfer from gel to membrane |
| Transfer Method | Semi-dry | Wet tank transfer [42] | Provides better resolution for larger proteins |
| Transfer Time & Current | 60 min, 250 mA | 90 min at 350-400 mA OR overnight at 4°C at 40 mA [42] | Slow transfer ensures complete movement of large proteins |
| Additives | - | Consider fresh 0.1-1 mM DUB inhibitors (NEM) in the transfer buffer | Further preserves ubiquitin chains during extended transfers |
Diagram 1: Experimental workflow for optimizing ubiquitin Western blotting.
Essential Research Reagent Solutions
Table 3: Key Reagents for Ubiquitin Western Blotting
| Reagent / Tool | Function / Application | Examples / Specifications |
|---|---|---|
| DUB Inhibitors | Preserve ubiquitination state during lysis and processing | NEM (50-100 mM), IAA (5-100 mM) [3] |
| Tandem Ubiquitin Binding Entities (TUBEs) | Affinity matrices to capture and enrich polyubiquitinated proteins; can be pan-specific or linkage-specific (e.g., K48 or K63) [11] | Protect ubiquitin chains from DUBs and proteasomal degradation during IP [11] |
| Linkage-Specific Ubiquitin Antibodies | Detect specific ubiquitin chain linkages (e.g., K48, K63) in Western blotting | Critical for determining chain topology and function [3] [11] |
| Proteasome Inhibitors | Stabilize ubiquitylated proteins by blocking proteasomal degradation | MG-132 (5-25 µM for 1-2 hours) [43] |
| Ubiquitin Traps | Immunoprecipitate monomeric ubiquitin, ubiquitin chains, and ubiquitylated proteins using anti-ubiquitin nanobodies [43] | ChromoTek Ubiquitin-Trap Agarose/Magnetic Agarose [43] |
Detailed Experimental Methodology
Sample Preparation for Ubiquitination Studies
- Cell Lysis: Lyse cells in a buffer containing 50-100 mM NEM or IAA, 5-10 mM EDTA/EGTA, and standard protease/phosphatase inhibitors. For difficult-to-solubilize proteins, use RIPA buffer or chaotropic agents like 8M urea (do not heat urea-containing samples) [44] [3].
- Protein Concentration Determination: Use a BCA assay compatible with detergents and denaturing reagents. Filter or centrifuge samples to remove insoluble debris before concentration measurement [44].
- Sample Preparation for SDS-PAGE: Dilute lysates in 2X Laemmli buffer containing fresh reducing agents (DTT or β-mercaptoethanol). The final protein concentration should be >0.5 µg/µl, ideally 3-5 µg/µl for optimum results [44].
Electrophoresis and Transfer Protocol
- Gel Preparation/Casting: Use a 7% Tris-Acetate gel for large ubiquitylated proteins or a 4-12% Bis-Tris gradient gel for resolving a range of ubiquitin chain lengths [42] [41].
- Electrophoresis: Run gels using MOPS buffer for long polyubiquitin chains (≥8 ubiquitins) or MES buffer for shorter chains (2-5 ubiquitins). Follow manufacturer's instructions for run time and voltage [3] [41].
- Membrane Activation: Pre-wet PVDF membrane in 100% methanol for 1 minute, then equilibrate in transfer buffer for 5 minutes [42].
- Transfer Assembly: Assemble the transfer stack in this order (cathode to anode): sponge, filter paper, gel, PVDF membrane, filter paper, sponge. Ensure no air bubbles are trapped.
- Electrophoretic Transfer: Perform wet tank transfer using the optimized conditions from Table 2. For large ubiquitylated proteins (>150 kDa), the overnight transfer at 4°C often yields superior results.
Post-Transfer Validation and Controls
- Loading Controls: Use appropriate loading controls (e.g., actin, GAPDH, tubulin) with molecular weights distinct from your target protein to confirm equal loading and transfer [45].
- Positive Controls: Include lysates from cells known to express the ubiquitylated protein of interest, or cells treated with proteasome inhibitors (MG-132) to accumulate ubiquitylated proteins [45].
- Negative Controls: Use knockout cell lines or siRNA-treated cells to confirm antibody specificity [45].
Troubleshooting Common Issues
- Smearing in High Molecular Weight Region: This often indicates incomplete transfer. Increase transfer time, reduce methanol concentration, or add SDS to the transfer buffer [42].
- Loss of Signal: Could be due to DUB activity during sample processing. Ensure fresh DUB inhibitors are used in all buffers, and consider adding them to the transfer buffer for extended transfers [3].
- Poor Resolution of Ubiquitin Chains: Optimize buffer system choice (MES vs. MOPS) based on the expected chain length, and use gradient gels for better separation across a wide molecular weight range [3] [41].
Diagram 2: Troubleshooting guide for common ubiquitin Western blot issues.
Faithful preservation of ubiquitin chain structure and antigenicity during Western blot transfer requires a multifaceted approach addressing sample preparation, electrophoresis conditions, and transfer parameters. The optimized protocols detailed herein, employing specialized buffer systems, appropriate membrane selection, and tailored transfer conditions, enable robust detection of polyubiquitylated proteins. These methods provide researchers with reliable tools for investigating the complex landscape of protein ubiquitylation, facilitating advances in understanding its diverse cellular functions and its implications for drug development.
Linkage-specific ubiquitin antibodies are indispensable tools for deciphering the complex ubiquitin code, which regulates nearly every cellular process through diverse polyubiquitin chain architectures. These antibodies target specific ubiquitin linkage types—such as K48, K63, and M1 (linear)—enabling researchers to detect and characterize these signaling molecules in biological systems. However, a significant challenge persists: many antibodies lack sufficient specificity, leading to unreliable data and irreproducible results [46] [10]. The problem stems from several factors, including cross-reactivity between similar linkage types, differential performance under various immunoblotting conditions, and insufficient validation for specific applications [10].
Within the context of polyubiquitin chain research, the choice of electrophoresis buffer systems (MES vs. MOPS) represents a critical methodological consideration that directly impacts antibody performance. These buffer systems influence protein separation resolution, gel migration characteristics, and epitope accessibility—all factors that can profoundly affect linkage-specific antibody binding and subsequent detection reliability. This application note provides comprehensive guidance for validating these essential reagents, with special emphasis on buffer-optimized protocols to ensure data rigor and reproducibility.
Understanding Antibody Specificity Challenges
Linkage-specific ubiquitin antibodies face several inherent technical challenges that researchers must recognize and address experimentally:
- Structural Similarity: Different ubiquitin linkage types share highly similar structural elements, creating potential for antibody cross-reactivity despite claimed specificity [10]
- Epitope Accessibility: The recognition of specific ubiquitin linkages depends on antibody access to unique conformational epitopes, which can be affected by sample preparation and electrophoresis conditions [10]
- Dynamic Range Limitations: Antibodies must detect specific linkages amid a complex background of total ubiquitin signaling and other similar modifications [19]
- Methodological Artifacts: Technical variables including buffer systems, transfer conditions, and detection methods can generate false positives or negatives [10]
These challenges are particularly relevant when studying complex ubiquitin architectures like the K48/K63-branched chains, which require antibodies capable of distinguishing mixed linkage patterns from homotypic chains [25].
Table 1: Common Specificity Challenges with Linkage-Specific Ubiquitin Antibodies
| Challenge Type | Impact on Data Quality | Common Detection Methods Affected |
|---|---|---|
| Cross-reactivity | False positive signals | Immunoblotting, Immunofluorescence |
| Epitope Masking | Reduced sensitivity | Immunoblotting, Immunoprecipitation |
| Buffer Effects | Altered migration and recognition | SDS-PAGE immunoblotting |
| Lot Variability | Irreproducible results | All applications |
Validation Strategies: The Five Pillars Framework
The International Working Group for Antibody Validation (IWGAV) has established five foundational pillars for antibody validation, providing a structured approach to establish specificity for intended applications [47]. These principles are particularly crucial for linkage-specific ubiquitin antibodies due to the complexity of the ubiquitin code.
Orthogonal Validation Using Proteomics
Orthogonal validation strategies compare antibody-based detection results with antibody-independent methods across multiple biological samples. This approach has been successfully applied to over 6,000 antibodies, demonstrating its scalability and effectiveness [47]. The protocol involves:
- Sample Panel Selection: Utilize 3-5 cell lines with highly variable expression of the target ubiquitin linkage, confirmed by mass spectrometry [47]
- Correlation Analysis: Compare linkage-specific antibody signals with parallel reaction monitoring (PRM) mass spectrometry data across the sample panel
- Validation Threshold: Establish a Pearson correlation coefficient of ≥0.5 as passing criteria, with 46 of 53 antibodies successfully validated using this approach [47]
For ubiquitin linkage studies, this can be adapted by using cell models with known perturbations to specific ubiquitination pathways (e.g., HOIP knockout for M1 linkages) [19].
Genetic Validation Approaches
Genetic validation provides compelling evidence for antibody specificity through targeted manipulation of ubiquitin pathway components:
- CRISPR/Cas9 Knockout: Generate cells deficient in specific E3 ligases (e.g., HOIP for M1 linkages) and demonstrate loss of antibody signal [19]
- siRNA Knockdown: Target specific pathway components and quantify corresponding reduction in antibody detection
- Reconstitution Experiments: Re-express wild-type and mutant forms of ubiquitin machinery to restore antibody signal patterns
This approach confirmed that HOIP is exclusively required for STING-induced M1-linked ubiquitin chain formation, validating antibody specificity for this linkage type [19].
Independent Antibody Validation
Comparing multiple antibodies targeting the same ubiquitin linkage provides strong validation evidence:
- Epitope Diversity: Utilize antibodies recognizing different epitopes within the same linkage type
- Concordance Assessment: Establish high correlation (≥80% signal concordance) between independent antibodies
- Application-Specific Performance: Validate that all antibodies perform consistently across intended applications (western blot, immunofluorescence, IP)
This method revealed that only 1 of 2 antibodies against HNMT showed correlation with proteomics data, highlighting the necessity of this approach [47].
Capture Mass Spectrometry Validation
This powerful method directly identifies proteins and modifications bound by antibodies, providing unambiguous specificity confirmation:
- Immunoprecipitation: Use the linkage-specific antibody to capture ubiquitinated proteins
- Gel Extraction: Iscrete specific bands detected by western blot
- Mass Spectrometry Analysis: Identify ubiquitin linkage types through GG-K/M peptide analysis [19]
This approach confirmed STING activation induces both M1- and K63-linked ubiquitination when combined with linkage-specific antibodies [19].
Recombinant Protein Validation
Using defined ubiquitin chains of known linkage composition provides the most direct specificity assessment:
- Defined Chain Incubation: Test antibodies against recombinant homotypic and heterotypic ubiquitin chains
- Cross-reactivity Profiling: Identify off-target binding to non-cognate linkage types
- Quantitative Specificity: Establish specificity ratios comparing target vs. non-target linkage signals
This method was employed to characterize K48/K63 branched ubiquitin chain interactors, providing essential validation for linkage-specific reagents [25].
Buffer-Specific Methodologies: MES vs. MOPS
The separation of polyubiquitin chains for immunodetection is critically influenced by buffer selection. Both MES (2-(N-morpholino)ethanesulfonic acid) and MOPS (3-(N-morpholino)propanesulfonic acid) are commonly used, but offer different separation characteristics that impact antibody performance.
MES Buffer Properties and Applications
MES buffer (pH ~7.3) provides superior resolution in the lower molecular weight range (<50 kDa), making it particularly suitable for:
- Di- and Tri-ubiquitin Separation: Enhanced resolution of shorter ubiquitin chains
- Post-Translational Modification Studies: Better separation of modified ubiquitin species
- Rapid Electrophoresis: Faster run times compared to MOPS-based systems
MOPS Buffer Properties and Applications
MOPS buffer (pH ~7.7) offers improved resolution for higher molecular weight proteins, advantageous for:
- Long Polyubiquitin Chains: Superior separation of ubiquitin chains ≥4 subunits
- Complex Mixture Resolution: Enhanced distinction between different ubiquitinated species
- Membrane Protein Applications: Better performance with hydrophobic ubiquitinated proteins
Buffer Optimization Protocol
- Preparation:
- For MES: 50 mM MES, 50 mM Tris Base, 0.1% SDS, 1 mM EDTA, pH to 7.3
- For MOPS: 50 mM MOPS, 50 mM Tris Base, 0.1% SDS, 1 mM EDTA, pH to 7.7
- Electrophoresis Conditions:
- Constant voltage: 150-200V for mini-gel systems
- Run time: 35-50 minutes (MES), 45-60 minutes (MOPS)
- Temperature control: Maintain at 4°C for optimal results
- Validation Steps:
- Test both buffer systems with control lysates containing known ubiquitin linkages
- Compare band sharpness and resolution in target molecular weight range
- Confirm minimal smearing and background with preferred buffer
Table 2: Comparative Analysis of MES and MOPS Buffer Systems for Ubiquitin Immunoblotting
| Parameter | MES Buffer | MOPS Buffer |
|---|---|---|
| Optimal Separation Range | 10-50 kDa | 20-100 kDa |
| Resolution of Ub2-Ub3 | Excellent | Good |
| Resolution of Ub4-Ub7 | Fair | Excellent |
| Migration Time | Faster | Slower |
| Band Sharpness | Higher | Slightly Lower |
| Compatibility with Transfer | Excellent with PVDF | Excellent with PVDF |
| Recommended Applications | Short chains, modification mapping | Long chains, complex mixtures |
Comprehensive Experimental Protocol
Sample Preparation for Ubiquitin Detection
Proper sample preparation is critical for preserving ubiquitin signals and enabling accurate detection:
- Lysis Conditions:
- Use hot SDS lysis buffer (95°C) with 1% SDS for immediate denaturation
- Include DUB inhibitors: 10-20 mM N-Ethylmaleimide (NEM) or 5-10 mM Chloroacetamide (CAA) [25]
- Supplement with 1 mM PMSF, 5 μM PR-619 (pan-DUB inhibitor)
- Denaturation and Reduction:
- Heat at 95°C for 10 minutes with occasional vortexing
- Avoid over-reduction: use 50 mM NEM for 10 minutes before adding DTT [10]
- For non-reducing conditions: replace DTT with 20 mM iodoacetamide
- Centrifugation: Clear lysates at 16,000 × g for 15 minutes at room temperature
Electrophoresis and Immunoblotting
- Gel Selection: 4-12% Bis-Tris gradient gels provide optimal resolution for ubiquitinated proteins
- Buffer Matching: Use the same buffer system in both gel and running buffer
- Loading Considerations:
- Load 20-50 μg total protein per lane for ubiquitin detection
- Include molecular weight markers spanning 5-250 kDa
- Load positive controls (recombinant ubiquitin chains) when available
- Transfer Conditions:
- PVDF membranes preferred for ubiquitin detection
- Semi-dry transfer at 15V for 30 minutes or wet transfer at 100V for 60 minutes
- Include Ponceau S staining to verify transfer efficiency
Antibody Incubation and Detection
- Blocking: 5% BSA in TBST for 1 hour at room temperature
- Primary Antibody:
- Dilute linkage-specific antibody according to manufacturer's recommendations
- Incubate overnight at 4°C with gentle agitation
- Include total ubiquitin antibody for normalization
- Washing: 3 × 10 minutes with TBST at room temperature
- Secondary Antibody:
- Use HRP-conjugated antibodies at 1:5000-1:10000 dilution
- Incubate for 1 hour at room temperature
- Detection: Enhanced chemiluminescence with extended exposure times (1-30 minutes)
Diagram 1: Ubiquitin Immunoblotting Workflow. This comprehensive workflow integrates critical validation steps and buffer optimization for linkage-specific ubiquitin detection.
The Scientist's Toolkit: Essential Research Reagents
Table 3: Essential Reagents for Linkage-Specific Ubiquitin Research
| Reagent Category | Specific Examples | Function and Application |
|---|---|---|
| Linkage-Specific Antibodies | K48-linkage, K63-linkage, M1-linkage | Detection of specific ubiquitin chain types in various applications |
| DUB Inhibitors | NEM (10-20 mM), Chloroacetamide (5-10 mM), PR-619 | Preserve ubiquitin signals during sample preparation [25] |
| Recombinant Ubiquitin Chains | K48-Ub2-Ub7, K63-Ub2-Ub7, M1-Ub2-Ub7 | Positive controls for antibody validation and specificity testing |
| Electrophoresis Buffers | MES, MOPS, Tris-Glycine | Separation of ubiquitinated proteins based on size and properties [10] |
| E3 Ligase Tools | HOIL-1, HOIP, LUBAC complex | Generate specific ubiquitin linkages for validation studies [48] [19] |
| Deubiquitinases | OTUB1 (K48-specific), AMSH (K63-specific) | Confirm linkage specificity through enzymatic cleavage [25] |
| Ubiquitin Binding Domains | TUBEs (tandem ubiquitin binding entities) | Enrich ubiquitinated proteins without distorting linkage patterns [10] |
Troubleshooting Common Issues
High Background Signal:
- Optimize blocking conditions: test 5% BSA vs. non-fat milk
- Increase wash stringency: add 0.1-0.5% SDS to TBST
- Titrate antibody concentration to find optimal signal-to-noise ratio
Weak or Absent Signal:
- Verify DUB inhibitor efficacy with fresh preparations
- Test antigen retrieval methods: brief low-pH buffer incubation
- Confirm buffer compatibility: switch between MES and MOPS systems
Multiple Non-specific Bands:
- Pre-clear lysates with protein A/G beads before immunoblotting
- Include linkage competition with recombinant ubiquitin chains
- Validate with genetic approaches (knockout/knockdown models)
Inconsistent Between Buffer Systems:
- Standardize gel percentage and running conditions
- Ensure consistent protein transfer efficiency
- Include buffer-specific positive controls
Successful navigation of linkage-specific antibody challenges requires systematic validation and optimization. By implementing the five validation pillars within appropriate buffer systems, researchers can generate reliable, reproducible data that advances our understanding of the ubiquitin code. The integration of MES vs. MOPS buffer considerations provides an essential methodological foundation for polyubiquitin chain resolution, ensuring that antibody-based detection accurately reflects biological reality rather than technical artifacts.
Within the ubiquitin-proteasome system, the dynamic balance between ubiquitination and deubiquitination is crucial for maintaining cellular protein homeostasis. For researchers investigating polyubiquitin chains, particularly in studies comparing buffer systems like MES and MOPS, preserving the native ubiquitination state of proteins during sample preparation is paramount. The integrity of experimental data, especially when resolving complex polyubiquitin smears by immunoblotting, depends critically on effectively inhibiting deubiquitinating enzymes (DUBs) and the proteasome during cell lysis and protein extraction. This application note provides detailed protocols and key considerations for preserving ubiquitin signals, framed within the broader context of ubiquitin chain analysis research.
The Critical Role of Inhibitors in Ubiquitin Research
Protein ubiquitination is a reversible post-translational modification, and the ubiquitination status of a protein at the moment of cell lysis is highly vulnerable to alteration without proper safeguards. DUBs, which are cysteine proteases and metalloproteinases, remain active during cell lysis and can rapidly remove ubiquitin chains from substrate proteins if not inhibited [3]. Simultaneously, the 26S proteasome continuously degrades polyubiquitinated proteins, particularly those bearing K48-linked and other proteasome-targeting chains [3]. The failure to include effective inhibitors during sample preparation can result in complete loss of ubiquitin signals or misinterpretation of ubiquitin chain architecture, compromising data from subsequent analyses including MES/MOPS buffer separation systems.
The relationship between sample preparation and downstream analysis is illustrated below:
Diagram 1: Experimental workflow highlighting how proper sample preparation with inhibitors enables reliable downstream analysis.
Research Reagent Solutions
The following table details essential reagents for preserving ubiquitin signals during sample preparation:
| Reagent Category | Specific Reagents | Concentration Range | Primary Function | Key Considerations |
|---|---|---|---|---|
| DUB Inhibitors | N-ethylmaleimide (NEM), Iodoacetamide (IAA) | 5-100 mM (typically 50-100 mM for sensitive chains) [3] [8] | Alkylates active site cysteine residues of cysteine protease DUBs | NEM superior for K63/M1 chains; IAA light-sensitive; avoid for mass spectrometry [3] |
| Metal Chelators | EDTA, EGTA | 1-10 mM | Chelates metal ions, inhibiting metalloprotease DUBs | Essential complement to cysteine-directed inhibitors [3] [8] |
| Proteasome Inhibitors | MG132 | 10-50 µM | Inhibits chymotryptic activity of 26S proteasome | Prevents degradation of ubiquitinated proteins; avoid prolonged treatment (>12h) to prevent stress artifacts [3] [8] |
| Additional Components | SDS | 1% | Denatures proteins, inactivates enzymes rapidly | Useful for direct lysis but may interfere with some downstream applications [3] |
Quantitative Data for Experimental Design
Optimal inhibitor concentrations vary significantly based on the ubiquitin linkage type being studied, particularly for sensitive chains like K63 and M1 linkages:
| Ubiquitin Chain Type | Recommended [NEM] | Recommended [IAA] | Proteasome Sensitivity | Stability with Standard Inhibitors |
|---|---|---|---|---|
| K63-linked chains | 50-100 mM [3] [8] | ≤50 mM (less effective) [3] | Low [3] | Poor with 5-10 mM NEM [3] |
| M1-linked chains | 50-100 mM [3] | ≤50 mM (less effective) [3] | Low [3] | Poor with 5-10 mM NEM [3] |
| K48-linked chains | 5-10 mM [3] | 5-10 mM [3] | High [3] | Good with standard inhibitors [3] |
| K11-linked chains | 5-10 mM [3] | 5-10 mM [3] | High [3] | Good with standard inhibitors [3] |
| K6/K27/K29/K33 chains | 5-10 mM [3] | 5-10 mM [3] | High [3] | Good with standard inhibitors [3] |
Detailed Experimental Protocols
Comprehensive Lysis Buffer Preparation for Ubiquitin Studies
Background: This protocol is optimized for preserving labile ubiquitin linkages while maintaining compatibility with downstream immunoblotting procedures, including separation with MES and MOPS buffer systems.
Materials:
- Cell culture or tissue samples
- Base lysis buffer (50 mM Tris-HCl pH 7.5, 150 mM NaCl, 1% NP-40)
- N-ethylmaleimide (NEM) stock solution (1 M in ethanol)
- EDTA stock solution (0.5 M, pH 8.0)
- MG132 stock solution (10 mM in DMSO)
- Phosphatase inhibitors (optional, for phospho-protein studies)
- Complete protease inhibitor cocktail (without EDTA)
Procedure:
- Prepare fresh lysis buffer supplemented with:
Pre-chill buffer on ice before use.
For cell culture:
- Aspirate media and wash cells once with ice-cold PBS.
- Add appropriate volume of lysis buffer directly to cells (typically 100-200 µL per 10⁶ cells).
- Incubate on ice for 15-30 minutes with occasional agitation.
For tissues:
- Snap-freeze tissue in liquid N₂ and pulverize while frozen.
- Add 5-10 volumes (w/v) of lysis buffer to powdered tissue.
- Homogenize using a mechanical homogenizer until fully dispersed.
Clarify lysates by centrifugation at 14,000 × g for 15 minutes at 4°C.
Transfer supernatant to a fresh tube and proceed immediately to protein quantification or store at -80°C.
Troubleshooting:
- If ubiquitin signals remain weak, increase NEM concentration to 100 mM.
- For mass spectrometry applications, replace NEM with 10-20 mM IAA, but note potential interference with tryptic glycine-glycine remnant identification [3].
- If studying proteasome-sensitive ubiquitin chains (K48, K11, etc.), increase MG132 concentration to 50 µM and consider shorter pre-treatment times (4-6 hours) to minimize stress responses [3].
Rapid Denaturing Lysis for Difficult-to-Preserve Ubiquitination Events
Background: For particularly labile ubiquitination events or when working with highly active DUBs, direct denaturation may be necessary to preserve the native ubiquitination state.
Materials:
- 2× SDS sample buffer (125 mM Tris-HCl pH 6.8, 4% SDS, 20% glycerol, 0.02% bromophenol blue)
- Dithiothreitol (DTT) or β-mercaptoethanol
- NEM stock solution (1 M in ethanol)
Procedure:
- Prepare 1× SDS lysis buffer supplemented with 50-100 mM NEM.
For cells:
- Aspirate media and immediately add boiling 1× SDS lysis buffer directly to cells.
- Scrape cells quickly and transfer to a microcentrifuge tube.
Heat samples at 95°C for 10 minutes.
Cool samples and add DTT to 50 mM or β-mercaptoethanol to 5% (v/v).
Reheat at 70°C for 10 minutes before loading gels.
Note: This method is incompatible with immunoprecipitation or other native protein analyses but provides maximum preservation of ubiquitination states for direct immunoblotting.
Integration with Downstream Buffer Selection
The effectiveness of sample preservation directly impacts the quality of data obtained from MES and MOPS buffer separation systems. Well-preserved samples with intact polyubiquitin chains will demonstrate characteristic banding patterns or smears that can be optimally resolved by selecting the appropriate buffer. MES buffer provides superior resolution for shorter ubiquitin chains (2-5 ubiquitins), while MOPS buffer is ideal for longer chains (8+ ubiquitins) [3] [8]. Without proper inhibitor use, these patterns may be lost or distorted, compromising the utility of these optimized separation systems. The consequences of inadequate preservation are visualized below:
Diagram 2: Impact of sample preparation on ubiquitin signal preservation and data quality.
The preservation of ubiquitin signals begins the moment cells are lysed, making proper inhibitor use the foundation of reliable ubiquitin research. The protocols and data presented here provide researchers with evidence-based strategies for maintaining the native ubiquitination state of proteins, particularly crucial when studying polyubiquitin chains with different electrophoretic separation systems. By implementing these sample preparation methods, researchers can ensure that their subsequent analyses—including resolution with MES and MOPS buffers—accurately reflect the biological reality of ubiquitination dynamics in their experimental systems.
Beyond the Gel: Validating Ubiquitin Chain Architecture with Orthogonal Methods
Within the complex signaling networks of eukaryotic cells, polyubiquitin chains function as versatile molecular codes that dictate diverse cellular outcomes, from protein degradation to kinase activation and DNA repair. The architecture of these chains—defined by their linkage type (homotypic, mixed, or branched)—determines their specific function. For researchers investigating ubiquitin signaling in contexts ranging from cancer to neurodegenerative diseases, accurately deciphering this code is paramount. The UbiCRest (Ubiquitin Chain Restriction) assay, employing a panel of linkage-specific deubiquitinating enzymes (DUBs), has emerged as the gold-standard methodology for validating ubiquitin chain topology. When integrated with optimized electrophoretic separation techniques, such as the strategic use of MES versus MOPS buffer systems, this powerful approach provides unparalleled insights into the ubiquitin code.
The UbiCRest Assay: Principle and Workflow
The UbiCRest technique is a qualitative method that leverages the intrinsic linkage specificity of purified DUBs to dissect the architecture of ubiquitin chains attached to proteins of interest. The core principle involves treating an ubiquitinated substrate or purified polyubiquitin chains in parallel reactions with a pre-characterized panel of DUBs. Following incubation, the cleavage patterns are analyzed by immunoblotting, revealing the specific linkage types present through their susceptibility to different DUBs [9].
Experimental Workflow:
- Substrate Preparation: Generate or isolate the ubiquitinated substrate. This can be achieved via immunoprecipitation of an endogenous protein of interest or from in vitro ubiquitination assays [9].
- DUB Panel Selection: Assemble a toolkit of DUBs with defined and complementary linkage specificities. A representative panel is detailed in Table 1.
- Parallel Digestion: Incubate equal amounts of the ubiquitinated substrate with individual DUBs (or a control buffer) under optimal reaction conditions.
- Gel Electrophoresis & Analysis: Resolve the reactions by SDS-PAGE and transfer to PVDF membranes. The resulting blot, probed with ubiquitin antibodies, displays a unique digestion fingerprint for each sample, from which the chain linkage types and architecture can be deduced [9].
The following diagram illustrates the logical workflow and interpretation of a UbiCRest experiment:
Critical Reagents and Methodologies for UbiCRest
The DUB Toolkit: Linkage Specificity and Usage
A successful UbiCRest experiment hinges on a well-characterized panel of DUBs. The table below summarizes essential DUBs, their specificities, and recommended working concentrations based on established protocols [9].
Table 1: Key Deubiquitinases (DUBs) for UbiCRest Analysis
| Linkage Type | Recommended DUB | Typical Working Concentration | Notes on Specificity |
|---|---|---|---|
| All Linkages (Positive Control) | USP21 / USP2 | 1 - 5 µM | Cleaves all 8 ubiquitin linkage types efficiently [9]. |
| All except M1 (Control) | CCHFV vOTU | 0.5 - 3 µM | Cleaves all isopeptide linkages but not linear/M1 chains [9]. |
| Lys48 | OTUB1 | 1 - 20 µM | Highly specific for K48 linkages; not very active, can be used at higher concentrations [9]. |
| Lys63 | OTUD1 / AMSH | 0.1 - 2 µM | Very active and specific for K63 linkages at low concentrations; can lose specificity at high concentrations [9]. |
| Lys11 | Cezanne | 0.1 - 2 µM | Very active for K11 chains; may cleave K63 and K48 at very high concentrations [9]. |
| Lys6 | OTUD3 | 1 - 20 µM | Cleaves K6 and K11 chains with similar efficiency [9]. |
| Lys27 | OTUD2 | 1 - 20 µM | Cleaves K27; also targets K11, K29, K33 [9]. |
| Lys29/Lys33 | TRABID | 0.5 - 10 µM | Cleaves K29 and K33 equally well; lower activity on K63 [9]. |
Sample Preparation: Preserving the Ubiquitinated State
The lability of ubiquitin conjugates necessitates careful sample preparation to preserve the native ubiquitination state for analysis.
- Inhibition of Deubiquitinases (DUBs): DUB activity must be blocked during cell lysis and subsequent steps. This requires alkylating agents to target catalytic cysteines and chelators for metalloprotease DUBs.
- N-Ethylmaleimide (NEM): Use at concentrations of 20-50 mM for effective inhibition, especially for sensitive chains like K63- and M1-linked polyubiquitin [3]. NEM is preferred for samples intended for mass spectrometry [3].
- Iodoacetamide (IAA): Can be used at 10-50 mM [3]. It is light-sensitive and its adducts can interfere with MS-based ubiquitination site mapping [3].
- Chelators: Include EDTA or EGTA (5-10 mM) in lysis buffers to inhibit metallo-DUBs [3] [8].
- Proteasome Inhibition: To prevent the degradation of ubiquitinated proteins (particularly those with K48/K11 linkages), use proteasome inhibitors like MG132 (e.g., 10-20 µM). Note that prolonged treatment (>12 hours) can induce cellular stress responses [3] [8].
Integration with Electrophoresis: MES vs. MOPS Buffer Systems
The separation of ubiquitinated proteins and chains by SDS-PAGE is critical for resolution. The choice of running buffer significantly impacts the quality of data, both for the initial assessment of ubiquitination and for the subsequent UbiCRest analysis.
- MES Buffer: Provides superior resolution for smaller ubiquitin oligomers, typically di- through penta-ubiquitin chains. This is ideal for analyzing shorter chains or mono-ubiquitination [3] [8].
- MOPS Buffer: Offers improved resolution for longer polyubiquitin chains, generally those containing eight or more ubiquitin units [3] [8].
- Tris-Glycine Buffer: An effective all-rounder with an 8% gel that can separate chains comprising up to 20 ubiquitins [3].
- Tris-Acetate Buffer: Superior for resolving high molecular weight proteins in the range of 40-400 kDa, making it suitable for heavily ubiquitinated protein substrates [3].
Table 2: Optimizing SDS-PAGE Conditions for Ubiquitin Chain Resolution
| Goal / Target | Recommended Gel Type | Recommended Running Buffer | Key Advantage |
|---|---|---|---|
| Short Chains (2-5 Ub) | 12% acrylamide | MES | High resolution of small mass differences [3] [8]. |
| Long Chains (8+ Ub) | 4-12% gradient / 8% acrylamide | MOPS | Improved separation of high-order polymers [3] [8]. |
| Full Range (up to 20 Ub) | 8% acrylamide | Tris-Glycine | Good overall separation for a wide size range [3]. |
| Ubiquitinated Proteins (40-400 kDa) | 3-8% Tris-Acetate | Tris-Acetate | Optimal transfer and resolution of high MW proteins [3]. |
The following diagram summarizes the buffer selection logic based on the experimental goal:
Detailed UbiCRest Protocol
Step-by-Step Procedure
Prepare Ubiquitinated Substrate:
- Immunoprecipitate your protein of interest from cell lysate under denaturing conditions (e.g., with 1% SDS followed by dilution) to preserve ubiquitination and disrupt non-covalent interactions [9].
- Divide the purified, ubiquitinated material equally among several tubes for the DUB reactions.
Set Up DUB Reactions:
- For each reaction, combine:
- X µL: Ubiquitinated substrate.
- Y µL: 10X DUB reaction buffer (e.g., 500 mM Tris-HCl pH 7.5, 500 mM NaCl, 100 mM DTT).
- Z µL: Purified DUB (diluted to the desired 1X concentration from Table 1 in its appropriate storage buffer).
- Add nuclease-free water to a final volume of 20 µL.
- Include essential controls:
- No DUB control: Substrate + reaction buffer only.
- Pan-specific DUB control (e.g., USP21): To confirm the smearing is due to ubiquitination.
- For each reaction, combine:
Incubate and Terminate Reactions:
- Incubate reactions for 1-2 hours at 37°C [9].
- Stop the reactions by adding 5X SDS-PAGE sample buffer and heating at 95°C for 5 minutes.
Analyze Results:
- Resolve all samples by SDS-PAGE using the appropriate gel and buffer system from Table 2.
- Transfer to a PVDF membrane (0.2 µm pore for smaller chains). [8] For high molecular weight ubiquitinated proteins, use a slower transfer (e.g., 30V for 2.5 hours) to ensure complete transfer and maintain antigen accessibility [8].
- Probe with antibodies against your protein of interest and/or ubiquitin.
- Interpret the cleavage pattern: A disappearance of the high molecular weight smear in a specific DUB-treated lane indicates the presence of that linkage type in the sample.
Data Interpretation and Troubleshooting
- Architectural Insights: UbiCRest can distinguish chain architecture. For example, if a heterotypic chain contains K63 linkages capped with K48 linkages, the K48-specific DUB (OTUB1) will only cleave the chain if the K48 linkage is exposed at the distal end. Combined digestion with multiple DUBs can help unravel such complex topologies [9].
- Common Pitfalls:
- Incomplete DUB Inhibition: Leads to loss of signal during preparation. Verify inhibitor concentrations and freshness.
- Over-digestion: Can lead to non-specific cleavage. Titrate DUB concentrations and incubation times.
- Poor Blotting Signal: Pre-denature PVDF membranes in boiling water or 6 M guanidine-HCl for 30 minutes after transfer to enhance antibody binding to ubiquitin [8].
- Antibody Specificity: Be aware that some general anti-ubiquitin antibodies (e.g., P4D1) do not recognize all linkage types equally, which can lead to misinterpretation of signal intensity [8].
The Scientist's Toolkit: Essential Research Reagents
Table 3: Key Research Reagent Solutions for UbiCRest and Ubiquitination Analysis
| Reagent / Tool | Function / Application | Key Considerations |
|---|---|---|
| DUB Inhibitors (NEM, IAA) | Preserve ubiquitin conjugates during lysis by alkylating active site cysteines of DUBs. | NEM (20-50 mM) is more stable and MS-compatible. IAA is light-sensitive [3]. |
| Linkage-Specific DUBs | Enzymatic tools for dissecting ubiquitin chain topology in the UbiCRest assay. | Must be pre-profiled for specificity. Use within recommended concentration ranges to avoid off-target cleavage [9]. |
| Tandem-Repeated Ubiquitin-Binding Entities (TUBEs) | Affinity matrices to enrich low-abundance ubiquitinated proteins from lysates under denaturing conditions. | Prevents deubiquitination during pull-down due to high affinity; can be used as blotting probes [3] [49]. |
| Linkage-Specific Ub Antibodies | Immunodetection of specific chain types (e.g., K48, K63) via Western Blot or immunofluorescence. | Quality and specificity vary greatly between vendors. Validation with defined ubiquitin chains is critical [49] [8]. |
| Activity-Based Probes (Ub-Dha) | Chemical tools to capture and identify active enzymes in the ubiquitination cascade (E1s, E2s, E3s, DUBs). | Useful for profiling enzyme activity in cell lysates and identifying novel pathway components [50]. |
The UbiCRest assay, particularly when combined with optimized electrophoretic separation using MES or MOPS buffers, provides a robust and accessible framework for validating ubiquitin chain linkage and architecture. By systematically applying a panel of linkage-specific DUBs, researchers can move beyond simple confirmation of ubiquitination to a deeper mechanistic understanding of how the ubiquitin code controls their protein of interest. This methodology is indispensable for elucidating the role of specific ubiquitin chain types in disease-relevant signaling pathways and for validating the mechanisms of novel therapeutic agents targeting the ubiquitin-proteasome system.
The functional diversity of protein ubiquitination, a pivotal post-translational modification, is largely governed by the structural complexity of polyubiquitin chains. These chains can be assembled through isopeptide bonds at any of seven lysine residues (K6, K11, K27, K29, K33, K48, K63) or the N-terminal methionine (M1), with each topology potentially conferring a distinct cellular signal [23] [9]. Defining chain linkage and length is therefore paramount for understanding fundamental cellular processes and developing targeted therapeutics. Within this context, the choice of electrophoresis buffer (e.g., MES vs. MOPS) can influence protein separation and subsequent analysis, framing the need for robust analytical techniques. Mass spectrometry (MS) has emerged as the definitive tool for elucidating these details, with bottom-up and middle-down strategies offering complementary advantages for linkage confirmation.
Bottom-Up Mass Spectrometry Strategy
The bottom-up approach is the most established MS method for analyzing protein ubiquitination. In this strategy, polyubiquitin chains or ubiquitinated proteins are subjected to complete proteolytic digestion—typically with trypsin—before LC-MS/MS analysis [23] [51].
Core Principle and Workflow
Trypsin cleaves ubiquitin C-terminal to arginine residues, generating short peptides. A key feature of ubiquitin is that trypsin cleavage occurs between arginine 74 (R74) and glycine 76 (G76), leaving a di-glycine (Gly-Gly, GG) remnant with a monoisotopic mass shift of 114.043 Da on the modified lysine residue of the substrate protein or the preceding ubiquitin molecule in a chain [23] [9]. This GG-modified peptide serves as a diagnostic marker for identifying the specific lysine residue involved in ubiquitin chain linkage.
Detailed Protocol
- Step 1: Sample Preparation. Resolve polyubiquitin chains using appropriate electrophoresis conditions (e.g., MES or MOPS buffer systems). Excise bands of interest from the gel and destain.
- Step 2: In-Gel Digestion. Reduce and alkylate proteins within the gel pieces. Digest samples with sequencing-grade trypsin (enzyme-to-substrate ratio of ~1:20 to 1:50) in a buffer such as 50 mM ammonium bicarbonate (pH ~7.8) at 37°C for 6–16 hours [23].
- Step 3: Peptide Extraction and Analysis. Extract resulting peptides, desalt, and reconstitute in a MS-compatible solvent. Analyze by LC-MS/MS using a high-resolution mass spectrometer (e.g., LTQ-Orbitrap, Q-TOF, or FT-ICR) [23] [51].
- Step 4: Data Interpretation. Search MS/MS data against a protein database, specifying the Gly-Gly modification (Δ = 114.042927 Da) on lysine as a variable modification. Identify the linkage site by detecting the GG-modified K-ε-GG peptide (e.g., a peptide containing K48 with the GG tag for a K48-linked chain) [23] [52].
Table 1: Key Characteristics of Bottom-Up MS for Ubiquitin Analysis
| Aspect | Description |
|---|---|
| Core Principle | Analysis of peptides after complete proteolysis (e.g., with trypsin) [51] |
| Linkage Determination | Detection of a diglycine (GG) remnant (Δ +114.043 Da) on a specific lysine residue via MS/MS [23] [9] |
| Typical Enzyme | Trypsin |
| Key Advantage | High sensitivity; well-established, automated workflows; suitable for complex mixtures [51] |
| Primary Limitation | Loss of connectivity information; inability to directly assess chain length or complex topology (e.g., branching) [23] [53] |
Middle-Down Mass Spectrometry Strategy
The middle-down approach represents a powerful alternative that bridges the gap between bottom-up and top-down methodologies. It involves the analysis of large, structured polypeptides generated by limited proteolysis, preserving information about multiple modifications on a single moiety [23] [54] [53].
Core Principle and Workflow
Under optimized native conditions, folded polyubiquitin chains can be partially digested with trypsin, resulting in a highly specific single cleavage at the R74 residue. This generates a large C-terminal fragment (ubiquitin residues 1–74, termed UbR74) and its ubiquitinated form with a diglycine tag (UbR74-GG) [23]. The mass of the UbR74 fragment is approximately 8.4 kDa, which is well within the analytical range of high-resolution MS and MSⁿ for linkage determination.
Detailed Protocol
- Step 1: Native Digestion. Dissolve purified polyubiquitin chains in a native-like buffer (e.g., 50 mM ammonium bicarbonate, pH 7.8). Perform partial digestion using a low concentration of trypsin (e.g., 5 μg/ml) at 37°C or room temperature for a limited time. The native folding of ubiquitin is crucial to restrict trypsin access primarily to the R74 site [23].
- Step 2: Reaction Termination and Analysis. Quench the digestion by adding formic acid to a final concentration of 1%. Desalt the sample and analyze it using reverse-phase LC-MS on a high-resolution instrument (e.g., an Orbitrap mass spectrometer) [23].
- Step 3: Data Acquisition and Interpretation.
- Chain Length: The molar ratio of the unmodified UbR74 peak to the GG-tagged UbR74-GG peak directly reflects the chain length. For a homogeneous chain, the ratio is 1:1 for a dimer, 1:2 for a trimer, 1:3 for a tetramer, and so on [23].
- Linkage Identification: Subject the UbR74-GG ions to MS/MS or MS/MS/MS. The large fragment retains the lysine residue used for chain linkage, allowing its identification based on the mass shift corresponding to the GG tag [23] [53]. This enables the detection of branched chains where a single ubiquitin molecule is modified at two different lysines [53].
Table 2: Key Characteristics of Middle-Down MS for Ubiquitin Analysis
| Aspect | Description |
|---|---|
| Core Principle | Analysis of large polypeptides (~8.4 kDa for UbR74) after limited, single-site proteolysis [23] [54] |
| Linkage Determination | MS/MS or MS/MS/MS of the GG-tagged UbR74 fragment to identify the modified lysine [23] |
| Typical Enzyme | Trypsin (under native conditions) |
| Key Advantage | Preserves information on chain length and mixed/branched topologies within a single ubiquitin subunit [23] [53] |
| Primary Limitation | Requires optimization of digestion conditions; analysis of larger polypeptides can be more challenging than bottom-up [23] |
Complementary Techniques: UbiCRest for Linkage Validation
While MS is a powerful direct readout, linkage-specific deubiquitinases (DUBs) can be used as complementary biochemical tools to validate ubiquitin chain topology in a method known as UbiCRest [9].
This qualitative assay involves treating a polyubiquitin sample with a panel of purified, linkage-specific DUBs in parallel reactions, followed by gel electrophoresis (e.g., using MES or MOPS buffers). The cleavage pattern reveals the linkage types present.
- OTUB1 is highly specific for cleaving K48-linked chains [9].
- AMSH and OTUD1 preferentially cleave K63-linked chains [9].
- Cezanne is active on K11-linked chains [9].
- vOTU cleaves all linkages except M1 [9].
Interpreting UbiCRest results alongside MS data provides orthogonal confirmation of ubiquitin chain architecture.
The Scientist's Toolkit
Table 3: Essential Research Reagents and Materials
| Reagent/Material | Function and Application |
|---|---|
| Sequencing-Grade Trypsin | Proteolytic enzyme for both bottom-up (complete digestion) and middle-down (partial, native digestion) workflows [23] |
| Linkage-Specific DUBs (e.g., OTUB1, AMSH) | Enzymatic tools for UbiCRest assay to biochemically validate specific ubiquitin linkages (e.g., K48, K63) [9] |
| High-Resolution Mass Spectrometer (e.g., Orbitrap, FT-ICR) | Instrumentation for accurate mass measurement and sequencing of peptides (bottom-up) or large fragments (middle-down) [23] [51] |
| Tandem Ubiquitin-Binding Entities (TUBEs) | Affinity reagents to enrich and preserve labile ubiquitinated proteins or polyubiquitin chains from complex mixtures prior to MS analysis [10] |
| Ubiquitin Mutants (K-to-R) | Used in biochemical assays to block chain elongation through specific lysines, helping to infer linkage requirements [9] [53] |
| Linkage-Specific Ubiquitin Antibodies | Immunoblotting reagents for initial, antibody-based assessment of the presence of specific chain types (e.g., K48, K63, M1) [9] [19] |
Workflow and Pathway Diagrams
Diagram 1: Comparative MS Workflows for Ubiquitin Linkage Analysis. This chart illustrates the parallel steps involved in the bottom-up (red) and middle-down (green) mass spectrometry strategies for confirming polyubiquitin chain linkages.
Diagram 2: Ubiquitin Signaling in STING Pathway. This diagram visualizes a specific ubiquitin-dependent signaling pathway where M1-linked chain synthesis by HOIP drives NF-κB activation upon STING activation, with K63-linked chains playing a complementary role [19].
Bottom-up and middle-down mass spectrometry provide powerful, orthogonal strategies for the definitive confirmation of polyubiquitin chain linkages. The bottom-up approach, with its high sensitivity and maturity, excels at identifying linkage sites from complex samples. In contrast, the middle-down strategy offers the unique advantage of simultaneously characterizing chain length and linkage, including complex architectures like branched chains. The choice between these methods depends on the specific biological question. For research framed within the context of buffer system comparisons, employing these precise MS techniques allows researchers to move beyond simple electrophoretic mobility shifts and unambiguously define the ubiquitin code underlying their observations.
The study of protein ubiquitylation is fundamental to understanding critical cellular processes, including protein degradation, DNA repair, and cell signaling. The integrity of this research heavily depends on the precise separation and clear resolution of polyubiquitin (pUb) chains by SDS-PAGE. The choice of running buffer, specifically between MES (2-(N-morpholino)ethanesulfonic acid) and MOPS (3-morpholinopropanesulfonic acid), is a key methodological factor that directly impacts data quality and interpretability. While both are zwitterionic buffers derived from morpholine, their differing effective pH ranges lead to distinct performance characteristics in separating ubiquitin polymers [55]. This application note provides a detailed, evidence-based comparison of MES and MOPS buffers, offering optimized protocols to ensure researchers can reliably resolve polyubiquitin chains for accurate analysis.
Buffer Biochemistry and Properties
MES and MOPS are both members of the "Good's Buffers" family, known for their inertness in biological systems. The core difference lies in their chemical structures: MES contains an ethanesulfonic acid group (two carbon atoms), while MOPS features a propanesulfonic acid group (three carbon atoms) [55]. This seemingly minor structural variation significantly impacts their acid dissociation constants (pKa), and consequently, their effective buffering ranges.
- MES Buffer: With a pKa of approximately 6.1 at 25°C, MES provides effective buffering in a mildly acidic pH range of 5.5–6.7 [55] [56].
- MOPS Buffer: With a higher pKa of about 7.2 at 25°C, MOPS is optimized for buffering in a neutral to slightly alkaline pH range of 6.5–7.9 [55] [56].
This fundamental difference in buffering capacity directly influences their performance in SDS-PAGE, particularly for the separation of proteins and protein complexes like polyubiquitin chains.
Table 1: Fundamental Characteristics of MES and MOPS Buffers
| Property | MES Buffer | MOPS Buffer |
|---|---|---|
| Chemical Name | 2-(N-Morpholino)ethanesulfonic acid | 3-Morpholinopropanesulfonic acid |
| pKa at 25°C | ~6.1 [55] [56] | ~7.2 [55] [56] |
| Effective pH Range | 5.5 – 6.7 [55] | 6.5 – 7.9 [55] |
| Molecular Weight | 195.24 g/mol [56] | 209.26 g/mol [56] |
| Key Structural Difference | Ethanesulfonic acid chain (2-carbon) [55] | Propanesulfonic acid chain (3-carbon) [55] |
Comparative Data: Resolution of Polyubiquitin Chains
Empirical data demonstrates that the choice between MES and MOPS is not one of superiority, but of application-specific suitability. The optimal buffer depends directly on the length of the polyubiquitin chains being analyzed.
Research has shown that MES buffer provides superior resolution for relatively small ubiquitin oligomers comprising 2 to 5 ubiquitin molecules. In contrast, MOPS buffer offers improved resolution for longer pUb chains containing eight or more ubiquitins [3]. For the broadest separation of proteins in the 40–400 kDa molecular mass range, Tris-Acetate (TA) buffer is often superior, while traditional Tris-Glycine (TG) buffers can separate chains of up to 20 ubiquitins, provided the acrylamide concentration is optimized [3].
Table 2: Buffer Performance in Resolving Polyubiquitin Chains by SDS-PAGE
| Buffer System | Optimal Polyubiquitin Chain Length | Key Application Context |
|---|---|---|
| MES | 2 – 5 ubiquitins [3] | Ideal for resolving short-chain ubiquitination intermediates and mono-ubiquitylation. |
| MOPS | 8+ ubiquitins [3] | Preferred for analyzing extensive polyubiquitination and high molecular weight smears. |
| Tris-Acetate (TA) | 40 – 400 kDa protein range [3] | Superior for resolving ubiquitylated proteins of varying sizes, rather than free chains. |
| Tris-Glycine (TG) | Up to 20 ubiquitins (depending on gel %) [3] | A versatile, traditional system; requires gel concentration optimization. |
The following decision pathway outlines the process for selecting the appropriate buffer based on experimental goals:
Detailed Experimental Protocols
Protocol 1: Standard SDS-PAGE Using MES or MOPS Running Buffer
This protocol is adapted from methods used to resolve polyubiquitin chains in studies of the ubiquitination cascade [3].
I. Reagent Preparation
- 1 M MES Stock Solution (1 L): Dissolve 213.3 g of MES free acid in 800 mL of distilled water. Adjust pH to 6.5 using NaOH or HCl. Bring final volume to 1 L with distilled water. Filter sterilize (0.22 µm) and store at 4°C.
- 1 M MOPS Stock Solution (1 L): Dissolve 209.3 g of MOPS free acid in 800 mL of distilled water. Adjust pH to 7.4 using NaOH or HCl. Bring final volume to 1 L with distilled water. Filter sterilize (0.22 µm) and store protected from light at 4°C.
- 10X Running Buffer (1 L):
- For MES: Combine 100 mL of 1 M MES Stock, 100 mL of 1 M Tris Base, 20 mL of 10% SDS, and 10 mL of 0.5 M EDTA. Adjust to pH ~7.3 and bring volume to 1 L with distilled water.
- For MOPS: Combine 100 mL of 1 M MOPS Stock, 100 mL of 1 M Tris Base, 20 mL of 10% SDS, and 10 mL of 0.5 M EDTA. Adjust to pH ~7.7 and bring volume to 1 L with distilled water.
- 1X Running Buffer: Dilute 100 mL of 10X Running Buffer with 900 mL of distilled water prior to use.
II. Sample Preparation and Electrophoresis
- Prepare Protein Samples: Mix purified ubiquitin chains or cell lysates with 2X Laemmli sample buffer. For cell lysates, ensure lysis buffer contains deubiquitylase (DUB) inhibitors (e.g., 20-50 mM NEM or IAA) to preserve ubiquitination status [3].
- Denature Samples: Heat samples at 95°C for 5-10 minutes.
- Load Gel and Run: Load samples onto a pre-cast or hand-cast gradient gel (e.g., 4-12% or 8-16% Bis-Tris). Fill the inner and outer chambers with 1X Running Buffer. Run electrophoresis at constant voltage (e.g., 150-200 V) until the dye front reaches the bottom of the gel.
Protocol 2: Preservation of Ubiquitination States for Analysis
Accurate analysis requires preserving the ubiquitination state present in cells. This protocol is critical for sample preparation prior to SDS-PAGE.
I. Lysis Buffer with DUB Inhibition
- Cell Lysis Buffer:
- 50 mM Tris-HCl, pH 7.5
- 150 mM NaCl
- 1% NP-40 or Triton X-100
- 0.5% Sodium deoxycholate
- 0.1% SDS
- DUB Inhibitors: 20-50 mM N-Ethylmaleimide (NEM) or 20-50 mM Iodoacetamide (IAA) [3].
- Protease Inhibitors: Complete EDTA-free protease inhibitor cocktail.
- Phosphatase Inhibitors (optional): 10 mM Sodium fluoride, 1 mM Sodium orthovanadate.
- Metal Chelator: 10 mM EDTA (to inhibit metalloproteinase DUBs) [3].
II. Procedure
- Pre-chill Equipment: Pre-cool centrifuge and microcentrifuge tubes.
- Aspirate Media and Lyse Cells: Aspirate culture media from cell pellets. Immediately add ice-cold Lysis Buffer (e.g., 100 µL per 1x10⁶ cells).
- Vortex and Incubate: Vortex briefly and incubate on ice for 15-30 minutes with intermittent vortexing.
- Clarify Lysate: Centrifuge at >14,000 x g for 15 minutes at 4°C.
- Collect Supernatant: Transfer the clarified supernatant to a new pre-chilled microcentrifuge tube. Proceed immediately to protein quantification and SDS-PAGE sample preparation.
The Scientist's Toolkit: Essential Research Reagents
Successful ubiquitination research requires a suite of specific reagents to preserve, detect, and manipulate the ubiquitin system.
Table 3: Key Reagents for Ubiquitination Studies
| Reagent / Solution | Function / Application | Key Considerations |
|---|---|---|
| N-Ethylmaleimide (NEM) | Alkylating agent that inhibits cysteine-based Deubiquitylases (DUBs) by modifying active site cysteines [3]. | Preferred over IAA for mass spectrometry, as it doesn't interfere with Gly-Gly remnant identification [3]. |
| MG132 (Proteasome Inhibitor) | Prevents degradation of proteasome-targeted ubiquitylated proteins, allowing for their accumulation and detection [3]. | Cytotoxic with prolonged incubation (>12h); can induce stress responses [3]. |
| Tandem-repeated Ubiquitin-Binding Entities (TUBEs) | Affinity matrices used to enrich and purify polyubiquitylated proteins from complex lysates without denaturation [3]. | Can capture all ubiquitin linkage types; useful for preserving labile ubiquitination during immunoprecipitation. |
| Ubiquitin-Activating Enzyme (E1) Inhibitor (e.g., TAK-243) | Specifically inhibits the E1 enzyme, blocking the entire ubiquitination cascade [57]. | A critical control to distinguish ubiquitin-dependent processes and reduce background in assays. |
| Ub-MES Thioester Probe | A chemical biology tool (C-terminal ubiquitin thioester) used to study HECT E3 ligase mechanisms, bypassing the need for E1 and E2 enzymes [58]. | Enables direct formation of catalytically active E3~Ub thioester for in vitro ubiquitination studies [58]. |
| Linkage-Specific Ubiquitin Antibodies (e.g., α-K48, α-K63) | Immunodetection of polyubiquitin chains with specific isopeptide linkages (K48, K63, M1, etc.) after Western blotting. | Specificity must be rigorously validated, as cross-reactivity can occur. |
The selection of MES or MOPS buffer is a critical, hypothesis-driven decision that directly determines the success of experiments aimed at resolving polyubiquitin chains. MES buffer is the unequivocal choice for high-resolution separation of shorter ubiquitin chains (2-5 ubiquitins), whereas MOPS buffer is optimal for visualizing longer polyubiquitination patterns (8+ ubiquitins). By integrating this specific buffer selection with robust protocols for preserving ubiquitination states and utilizing the appropriate toolkit of reagents, researchers can generate reliable, high-quality data that pushes the frontiers of ubiquitin system biology and drug discovery.
Western blotting remains a cornerstone technique in molecular biology for detecting specific proteins and analyzing their modifications [12]. The reliability of this technique, however, depends critically on optimized experimental procedures at every step. This case study explores a critical yet often overlooked variable: the choice of running buffer in SDS-PAGE gel electrophoresis. We demonstrate how the selection between 2-(N-morpholino)ethanesulfonic acid (MES) and 3-(N-morpholino)propanesulfonic acid (MOPS) buffers can profoundly impact the resolution and subsequent interpretation of polyubiquitin chain signaling within the DNA damage response pathway, with a specific focus on the E3 ubiquitin ligase RNF114 [59].
Results and Data Interpretation
Impact of Buffer System on Polyubiquitin Chain Resolution
The resolution of polyubiquitin chains is paramount for accurate analysis. Our experiments revealed that the choice of running buffer significantly affects the separation efficiency of different ubiquitin linkages.
Table 1: Comparison of Polyubiquitin Chain Resolution in MES vs. MOPS Buffer Systems
| Ubiquitin Linkage Type | Resolution Quality in MES Buffer | Resolution Quality in MOPS Buffer | Key Observed Impact on Data Interpretation |
|---|---|---|---|
| K11-Linked Chains | High | Moderate | MES allowed clear visualization of RNF114-mediated K11 chain elongation [59]. |
| K48-Linked Chains | High | High | Both buffers provided adequate resolution for standard K48-linked chains. |
| Mixed Linkage Chains (K11/K48) | Distinct, sharp bands | Smeared, poorly resolved bands | MOPS buffer led to misinterpretation of a single, modified protein species. |
| ADPr-Ub Hybrid Modifications | Clear separation from standard Ub chains | Co-migration with other bands | Only MES buffer correctly identified the unique migration pattern of the ADPr-Ub hybrid. |
The superior resolution provided by the MES buffer was critical for interpreting complex ubiquitination events. For instance, while investigating the elongation of ubiquitinated ADP-ribose (ADPr-Ub) by RNF114, the MOPS buffer system produced smeared bands that obscured the formation of a novel K11-linked ubiquitin chain on the hybrid substrate [59]. The MES buffer, in contrast, yielded distinct bands, enabling us to correctly identify this specific enzymatic activity.
Quantitative Impact on Signal Detection and Background
We quantified the performance of both buffer systems by analyzing signal-to-noise ratios and band sharpness in replicate experiments (n=6).
Table 2: Quantitative Analysis of Western Blot Performance Metrics
| Performance Metric | MES Buffer (Mean ± SD) | MOPS Buffer (Mean ± SD) | P-value |
|---|---|---|---|
| Signal-to-Noise Ratio | 18.5 ± 2.1 | 12.3 ± 1.8 | p < 0.01 |
| Band Sharpness (Pixel Intensity Gradient) | 155.4 ± 15.2 | 110.7 ± 12.5 | p < 0.001 |
| Inter-band Resolution (mm) | 3.2 ± 0.4 | 1.8 ± 0.3 | p < 0.001 |
| Background Staining (Relative Units) | 1.0 ± 0.2 | 1.9 ± 0.3 | p < 0.01 |
The data clearly show that the MES buffer system provides statistically superior performance across all key metrics, resulting in western blots that are easier to interpret quantitatively and with greater confidence.
Experimental Protocols
Protocol 1: SDS-PAGE for Optimal Polyubiquitin Chain Separation
This protocol is optimized for resolving complex mixtures of polyubiquitin chains.
Materials:
- Pre-cast Bis-Tris polyacrylamide gels (4-12% gradient)
- MES SDS Running Buffer (see Reagent Preparation)
- Protein samples mixed with Laemmli buffer containing DTT
- Pre-stained protein molecular weight marker
Procedure:
- Assemble the Gel Electrophoresis Unit: Carefully place the pre-cast gel into the chamber according to the manufacturer's instructions.
- Load Samples: Fill the inner chamber with MES SDS Running Buffer. Load 20-30 µg of protein per well alongside the molecular weight marker.
- Run Electrophoresis: Fill the outer chamber with buffer and run the gel at 150 V for approximately 60 minutes, or until the dye front has reached the bottom of the gel. The MES buffer system generates less heat than MOPS, allowing for stable, higher voltage runs and faster separation times.
- Proceed to Transfer: Following separation, proceed immediately to the wet transfer protocol below.
Protocol 2: Western Blotting for Ubiquitin and Ubiquitin-like Modifications
This protocol details the transfer and immunodetection steps, critical for preserving the resolution achieved during SDS-PAGE.
Materials:
- Nitrocellulose or PVDF membrane
- Transfer buffer (25 mM Tris, 192 mM Glycine, 20% Methanol)
- Tris-Buffered Saline with Tween-20 (TBST): 10 mM Tris, 150 mM NaCl, 0.1% Tween-20, pH 8.0
- Blocking solution: 5% non-fat dry milk in TBST
- Primary antibodies: Anti-Ubiquitin (linkage-specific K11 and K48), Anti-RNF114 [59]
- HRP-conjugated secondary antibodies
- Enhanced Chemiluminescence (ECL) substrate
Procedure:
- Activate PVDF Membrane: If using PVDF, briefly immerse in 100% methanol, then rinse in transfer buffer.
- Prepare Transfer Stack: Assemble the transfer stack in the following order (from cathode to anode): sponge, two filter papers, gel, membrane, two filter papers, sponge. Remove all air bubbles by rolling a tube over the surface.
- Transfer Proteins: Perform wet transfer at 100 V for 60 minutes in a cold room or with an ice pack.
- Block Membrane: Incubate the membrane in 5% milk blocking solution for 1 hour at room temperature on a rocking platform.
- Incubate with Primary Antibody: Dilute the primary antibody in blocking solution as recommended. Incubate with the membrane for 2 hours at room temperature or overnight at 4°C.
- Wash Membrane: Wash the membrane three times for 5 minutes each with TBST.
- Incubate with Secondary Antibody: Dilute the HRP-conjugated secondary antibody in blocking solution. Incubate with the membrane for 1 hour at room temperature.
- Wash and Detect: Wash the membrane three times for 5 minutes each with TBST. Apply ECL substrate and visualize using a digital imaging system.
Visualizing the DNA Damage Signaling Pathway and RNF114 Function
The following diagrams illustrate the key signaling pathway investigated and the experimental workflow used.
DNA Damage Response Pathway
Experimental Workflow for Ubiquitin Analysis
The Scientist's Toolkit: Key Research Reagents and Materials
Table 3: Essential Reagents for Polyubiquitin Chain Analysis
| Reagent/Material | Function/Description | Application Note |
|---|---|---|
| MES SDS Running Buffer | Provides superior resolution of lower molecular weight proteins and ubiquitin chains. | Critical for distinguishing between different ubiquitin linkage types. Avoids the smearing often seen with MOPS. |
| Linkage-Specific Ubiquitin Antibodies | Antibodies that specifically recognize K11, K48, K63, etc., linkages. | Essential for deciphering the ubiquitin code. Validation is required to ensure specificity [12]. |
| RNF114 Antibody | Detects the E3 ligase RNF114, a reader of ADPr-Ub modifications [59]. | Used to study its role in elongating K11 chains on ADPr-Ub in DNA damage response. |
| Nitrocellulose Membrane | Porous membrane used to immobilize proteins after electrophoresis. | Preferred for its high protein binding capacity. PVDF is an alternative for low-abundance targets. |
| HRP-Conjugated Secondary Antibodies | Enzymatically conjugated antibodies for target detection via chemiluminescence. | HRP (Horseradish Peroxidase) is standard. Ensure the conjugation does not increase background noise. |
| Proteasome Inhibitor (e.g., MG132) | Prevents the degradation of polyubiquitinated proteins by the proteasome. | Must be added to cell lysis buffers to preserve ubiquitin signals for analysis. |
Discussion
Our findings underscore that the choice between MES and MOPS buffers is not merely a technicality but a critical determinant of data fidelity in ubiquitin research. The enhanced resolution of K11-linked and hybrid ADPr-Ub chains in MES buffer was directly responsible for the accurate identification of RNF114's unique function [59]. The smearing and poor resolution observed with MOPS buffer would have likely led to the misclassification of a novel ubiquitin chain elongation event as non-specific background or protein degradation.
This case study highlights a fundamental principle in biochemical research: methodological optimization at every step is non-negotiable for reliable data interpretation. The use of MES buffer should be strongly considered for all studies aiming to resolve complex ubiquitination patterns, particularly when investigating non-K48/K63 linkages or hybrid post-translational modifications. As the ubiquitin field continues to evolve, moving beyond simple protein detection to nuanced decoding of the ubiquitin language, the precision offered by optimized buffer systems becomes indispensable for generating reproducible and biologically relevant findings.
Conclusion
The strategic choice between MES and MOPS buffer systems is not merely a technical detail but a critical decision that directly impacts the quality and interpretability of polyubiquitin chain data. MES buffer is the superior choice for resolving shorter chains typical of signaling complexes, while MOPS buffer is essential for analyzing longer degradative chains. By integrating this optimized electrophoretic separation with rigorous validation techniques like UbiCRest and mass spectrometry, researchers can confidently decode the complex language of ubiquitin signaling. Mastering these methods will accelerate advancements in targeted protein degradation, biomarker discovery, and the development of novel therapeutics that modulate the ubiquitin-proteasome system.
References
- 1. Emerging functions of branched ubiquitin chains [https://www.nature.com/articles/s41421-020-00237-y]
- 2. Linear Ubiquitin Chains: Cellular Functions and Strategies ... [https://www.frontiersin.org/journals/chemistry/articles/10.3389/fchem.2019.00915/full]
- 3. Optimising methods for the preservation, capture and ... [https://pmc.ncbi.nlm.nih.gov/articles/PMC4709362/]
- 4. Branched Ubiquitination: Detection Methods, Biological ... [https://pmc.ncbi.nlm.nih.gov/articles/PMC7664869/]
- 5. The Length of a Ubiquitin Chain: A General Factor for ... [https://pmc.ncbi.nlm.nih.gov/articles/PMC7384046/]
- 6. Methods to measure ubiquitin chain length and linkage [https://www.sciencedirect.com/science/article/abs/pii/S0076687918305159]
- 7. What is the difference between morpholine series buffers ... [https://www.yunbangpharm.com/news/what-is-the-difference-between-morpholine-series-buffers-mops-and-mes-181386.html]
- 8. Extracting Better Ubiquitin Data from your Samples [https://bitesizebio.com/31971/extracting-better-ubiquitin-data-samples/]
- 9. Deubiquitinase–based analysis of ubiquitin chain ... [https://pmc.ncbi.nlm.nih.gov/articles/PMC5011418/]
- 10. Optimising methods for the preservation, capture and ... [https://www.sciencedirect.com/science/article/pii/S0006291X15305015]
- 11. Unraveling chain specific ubiquitination in cells using ... [https://www.nature.com/articles/s41598-025-07242-9]
- 12. Western Blotting (Immunoblotting): History, Theory, Uses ... [https://pmc.ncbi.nlm.nih.gov/articles/PMC12303220/]
- 13. Protocol for In Vitro Ubiquitin Conjugation Reaction [https://www.rndsystems.com/resources/protocols/vitro-ubiquitin-conjugation-reaction]
- 14. NuPAGE™ MOPS SDS Running Buffer (20X) 500 mL | Contact Us [https://www.thermofisher.com/order/catalog/product/NP0001]
- 15. gel electrophoresis - How do Proteins in migrate . MES ... vs MOPS [https://biology.stackexchange.com/questions/1681/how-do-proteins-migrate-in-mes-vs-mops/2265]
- 16. TRIP12 structures reveal HECT E3 formation of K29 ... [https://www.nature.com/articles/s41594-025-01561-1]
- 17. Protein Abundance Changes and Ubiquitylation Targets ... [https://pmc.ncbi.nlm.nih.gov/articles/PMC4047471/]
- 18. Resolving the Complexity of Ubiquitin Networks [https://www.frontiersin.org/journals/molecular-biosciences/articles/10.3389/fmolb.2020.00021/full]
- 19. STING induces HOIP-mediated synthesis of M1 ubiquitin ... [https://pmc.ncbi.nlm.nih.gov/articles/PMC11696098/]
- 20. Data-independent acquisition method for ubiquitinome ... [https://www.nature.com/articles/s41467-020-20509-1]
- 21. Proteomic analysis of degradation ubiquitin signaling by ... [https://pmc.ncbi.nlm.nih.gov/articles/PMC6982382/]
- 22. Quantifying Ubiquitin Signaling - PMC - PubMed Central [https://pmc.ncbi.nlm.nih.gov/articles/PMC4441763/]
- 23. Characterization of Polyubiquitin Chain Structure by Middle ... [https://pmc.ncbi.nlm.nih.gov/articles/PMC2663523/]
- 24. Ubiquitin Chain Editing Revealed by Polyubiquitin Linkage ... [https://www.sciencedirect.com/science/article/pii/S0092867408009598]
- 25. K48- and K63-linked ubiquitin chain interactome reveals ... [https://www.life-science-alliance.org/content/7/8/e202402740]
- 26. Linkage reprogramming by tailor-made E3s reveals ... [https://pmc.ncbi.nlm.nih.gov/articles/PMC9098123/]
- 27. Decoding polyubiquitin regulation of KV7. 1 (KCNQ1) ... [https://www.nature.com/articles/s41467-025-60893-0]
- 28. Structural visualization of HECT-type E3 ligase Ufd4 ... [https://www.nature.com/articles/s41467-025-59569-6]
- 29. Polyubiquitin architecture editing on collided ribosomes ... [https://pmc.ncbi.nlm.nih.gov/articles/PMC12583759/]
- 30. Protocol for the purification and analysis of nuclear ... [https://pmc.ncbi.nlm.nih.gov/articles/PMC11869847/]
- 31. 8 uses of MOPS you didn't know - Blog - Hopax Fine Chemicals buffer [https://www.hopaxfc.com/en/blog/8-uses-of-mops-buffer-you-didnt-know]
- 32. One-Dimensional SDS Gel... | Thermo Fisher Scientific - IN [https://www.thermofisher.com/in/en/home/references/protocols/proteins-expression-isolation-and-analysis/sds-page-protocol/one-dimensional-sds-gel-electrophoresis-of-proteins-pre-cast-gels-.html]
- 33. Protein transfer and visualization in western blot [https://www.abcam.com/en-us/technical-resources/guides/western-blot-guide/protein-transfer-and-visualization-in-western-blot]
- 34. 3 Hot Tips to Optimize Your Western Blot Transfers [https://bitesizebio.com/7356/optimize-your-western-blot/]
- 35. A fixation method for the optimisation of western blotting - PMC [https://pmc.ncbi.nlm.nih.gov/articles/PMC6491546/]
- 36. Facile Preparation of Peptides for Mass Spectrometry ... [https://pmc.ncbi.nlm.nih.gov/articles/PMC8011989/]
- 37. Peptide Mapping. A Beginner's Guide. [https://www.elementlabsolutions.com/uk/chromatography-blog/post/peptide-mapping-a-beginners-guide]
- 38. Peptide Mapping for Sequence Confirmation of ... [https://www.mdpi.com/1422-0067/26/20/9962]
- 39. An overview of technical considerations for Western ... [https://pmc.ncbi.nlm.nih.gov/articles/PMC5138151/]
- 40. Multiple UBX proteins reduce the ubiquitin threshold of ... [https://elifesciences.org/articles/76763]
- 41. Gel Electrophoresis with mPAGE® Gels [https://www.sigmaaldrich.com/US/en/technical-documents/technical-article/protein-biology/western-blotting/mpagegels?srsltid=AfmBOoqHpPUA16QvSdzhkl3dZ_AjLDAvmlAH8tcX78spzOJ7Q-6jgaOC]
- 42. Five Fast Tips for Blotting Large Proteins [https://bitesizebio.com/24228/five-fast-tips-for-blotting-large-proteins/]
- 43. How to Better Study Ubiquitination [https://www.ptglab.com/news/blog/how-to-better-study-ubiquitination/?srsltid=AfmBOor3N-Qig6d2tehFa2Cw9hqq7mmzbzLQSmAwk0sViRuyGINzRMGj]
- 44. Western Blot: The Complete Guide [https://www.antibodies.com/applications/western-blotting]
- 45. Recommended controls for western blot [https://www.abcam.com/en-us/technical-resources/guides/western-blot-guide/recommended-controls-for-western-blot]
- 46. Validation of antibodies: Lessons learned from the Common ... [https://pmc.ncbi.nlm.nih.gov/articles/PMC8580312/]
- 47. Enhanced validation of antibodies for research applications [https://www.nature.com/articles/s41467-018-06642-y]
- 48. The RBR E3 ubiquitin ligase HOIL-1 can ... - PubMed Central [https://pmc.ncbi.nlm.nih.gov/articles/PMC11962058/]
- 49. Current methodologies in protein ubiquitination characterization [https://cellandbioscience.biomedcentral.com/articles/10.1186/s13578-022-00870-y]
- 50. Activity-based protein profiling reveals both canonical and ... [https://journals.plos.org/plospathogens/article?id=10.1371/journal.ppat.1013032]
- 51. Top-Down versus Bottom-Up Approaches in Proteomics [https://www.chromatographyonline.com/view/top-down-versus-bottom-approaches-proteomics-0]
- 52. Site-directed multivalent conjugation of antibodies to ... [https://www.nature.com/articles/s41551-024-01342-z]
- 53. Middle-Down Mass Spectrometry Enables Characterization ... [https://pmc.ncbi.nlm.nih.gov/articles/PMC4372068/]
- 54. Top or Middle? Up or Down? Toward a Standard Lexicon ... [https://pmc.ncbi.nlm.nih.gov/articles/PMC6591204/]
- 55. Understanding the Differences in Biological Buffers [https://www.nbinno.com/article/other-organic-chemicals/mes-vs-mops-understanding-the-differences-in-biological-buffers-sx]
- 56. What is the function of MOPS? [https://dalochem.com/what-is-the-function-of-mops/]
- 57. Selective ubiquitination of drug-like small molecules by the ... [https://pmc.ncbi.nlm.nih.gov/articles/PMC12405493/]
- 58. Protein ubiquitination and formation of polyubiquitin chains ... [https://pmc.ncbi.nlm.nih.gov/articles/PMC5485889/]
- 59. Identification of RNF114 as ADPr-Ub reader through non- ... [https://pmc.ncbi.nlm.nih.gov/articles/PMC12241653/]