Overcoming Low Stoichiometry: Advanced Strategies for Ubiquitination Detection in Biomedical Research
This comprehensive review addresses the significant analytical challenge of detecting protein ubiquitination at low stoichiometry, a fundamental post-translational modification with critical roles in cellular regulation and disease pathogenesis.
Overcoming Low Stoichiometry: Advanced Strategies for Ubiquitination Detection in Biomedical Research
Abstract
This comprehensive review addresses the significant analytical challenge of detecting protein ubiquitination at low stoichiometry, a fundamental post-translational modification with critical roles in cellular regulation and disease pathogenesis. We explore the foundational principles of ubiquitin biology and the technical barriers posed by the dynamic, transient nature of ubiquitination events. The article provides a detailed examination of current methodological approaches including mass spectrometry-based proteomics, high-throughput biochemical assays, and computational prediction tools. For researchers and drug development professionals, we offer practical troubleshooting guidance for assay optimization and a comparative analysis of validation strategies to ensure data reliability. By integrating insights from recent technological advances across these domains, this resource aims to equip scientists with the knowledge to effectively capture and characterize ubiquitination events despite their low abundance, thereby accelerating discovery in basic research and therapeutic development.
The Ubiquitination Detection Challenge: Understanding Low Stoichiometry and Biological Complexity
Ubiquitination is a crucial post-translational modification that regulates virtually all aspects of cellular function, from protein degradation to signal transduction. However, researchers consistently face a fundamental obstacle: the exceptionally low stoichiometry of this modification. Recent quantitative studies reveal that ubiquitylation site occupancy spans over four orders of magnitude, with the median ubiquitylation site occupancy being three orders of magnitude lower than that of phosphorylation [1]. This means that at any given moment, only a tiny fraction of a target protein exists in its ubiquitinated form, creating substantial detection challenges.
This low stoichiometry arises from the dynamic and transient nature of ubiquitination, the efficiency of deubiquitinating enzymes (DUBs), and the rapid degradation of ubiquitinated substrates by the proteasome. Consequently, standard detection methods often fail to capture these elusive modifications, requiring specialized methodologies and troubleshooting approaches outlined in this technical support guide.
Key Concepts: Understanding Ubiquitination Complexity
FAQ: What makes ubiquitination so difficult to detect compared to other post-translational modifications?
Ubiquitination presents unique detection challenges due to several factors:
- Extremely Low Stoichiometry: The proportion of ubiquitinated molecules at any specific site is remarkably small, with median occupancy approximately 1000 times lower than phosphorylation [1]
- Structural Diversity: Ubiquitination can form multiple chain types (K48, K63, M1, etc.) with different functions, requiring linkage-specific detection methods [2]
- Transient Nature: The modification is highly dynamic due to active deubiquitination and rapid degradation of targets
- Technical Limitations: Standard immunoassays lack the sensitivity and specificity to detect these rare events without enrichment strategies
FAQ: Why does low stoichiometry matter for experimental outcomes?
Low stoichiometry directly impacts experimental detectability and interpretation:
- False Negatives: Genuine ubiquitination events go undetected due to insufficient sensitivity
- Enrichment Requirements: Direct detection without enrichment becomes impossible for most targets
- Signal Dilution: The ubiquitination signal is drowned out by the abundant unmodified protein population
- Quantification Challenges: Accurate measurement of modification extent requires specialized normalization approaches
Quantitative Landscape of Ubiquitination Stoichiometry
The table below summarizes key quantitative findings that highlight the stoichiometry challenge in ubiquitination research:
Table 1: Quantitative Measurements of Ubiquitination Stoichiometry
| Parameter | Value | Experimental Basis | Significance |
|---|---|---|---|
| Occupancy vs. Phosphorylation | >3 orders of magnitude lower | Global, site-resolved analysis [1] | Explains why ubiquitination is harder to detect than phosphorylation |
| Occupancy Range | Spans over 4 orders of magnitude | Quantitative proteomics [1] | Indicates enormous variation between different sites |
| High vs. Low Occupancy Sites | Distinct biological properties | Systems-scale quantification [1] | Suggests functional differences between high and low occupancy sites |
| Aging Brain Impact | 29% of sites altered independently of protein abundance | Mouse brain ubiquitylome analysis [3] | Demonstrates true stoichiometry changes in biological processes |
Essential Methodologies and Protocols
Enrichment-Based Detection Strategies
The following diagram illustrates the strategic approach to overcoming low stoichiometry through targeted enrichment:
TUBE-Based Enrichment Protocol
Tandem Ubiquitin Binding Entities (TUBEs) provide a powerful solution for ubiquitin enrichment:
Principle: TUBEs consist of multiple ubiquitin-associated (UBA) domains engineered in tandem, creating nanomolar affinity for polyubiquitin chains while protecting them from deubiquitinating enzymes [2] [4].
Detailed Protocol:
Cell Lysis with DUB Inhibition
- Use semi-denaturing lysis conditions with 4M urea
- Include 20mM N-ethylmaleimide (NEM) to inhibit cysteine-based DUBs
- Add protease inhibitor cocktails (EDTA-free recommended)
- Maintain samples at 4°C throughout processing [4]
TUBE-Bead Preparation
- Immobilize site-specifically biotinylated TUBEs on magnetic streptavidin beads
- Prepare fresh TUBE-bead assemblies before each experiment
- Use 10-50μg TUBE reagent per mg of cellular protein [4]
Enrichment Procedure
- Incubate lysate with TUBE-beads for 2-4 hours at 4°C with rotation
- Wash with urea-containing buffers to remove non-specifically bound proteins
- Elute with acidic conditions (pH 2.0-2.5) to liberate ubiquitinated proteins while retaining TUBE on beads [4]
Downstream Analysis
- Process eluates for immunoblotting with specific antibodies
- For MS analysis, proceed with tryptic digestion and LC-MS/MS
- For high-throughput applications, use TUBE-coated microplates [2]
Troubleshooting Tips:
- If background is high: Increase urea concentration in wash buffers
- If yield is low: Verify DUB inhibition by spiking recombinant triubiquitin chains
- If specificity is poor: Include control beads without TUBEs
- For linkage-specific analysis: Use chain-selective TUBEs (K48- or K63-specific) [2]
Mass Spectrometry-Based Detection Workflow
For researchers opting for MS-based detection, the following workflow addresses stoichiometry challenges:
Critical MS Parameters:
- Intensity: Measure of peptide abundance, influenced by protein abundance and ionization efficiency [5]
- Peptide Count: Number of different detected peptides from the same protein [5]
- Coverage: Proportion of protein covered by detected peptides (aim for 40-80% in purified samples) [5]
- Q-value: Statistical significance measure, should be <0.05 [5]
Research Reagent Solutions
The table below summarizes key reagents for overcoming low stoichiometry challenges in ubiquitination research:
Table 2: Essential Research Reagents for Ubiquitination Detection
| Reagent Type | Specific Examples | Key Features | Applications |
|---|---|---|---|
| TUBEs | Pan-selective TUBEs, K48-TUBEs, K63-TUBEs | Nanomolar affinity, DUB protection, linkage-specific options [2] [4] | Enrichment for immunoblotting, MS, HTS assays |
| Tagged Ubiquitin | His-Ub, Strep-Ub, HA-Ub | Affinity purification, expression in cells [6] | Identification of ubiquitination sites and substrates |
| Linkage-Specific Antibodies | K48-linkage specific, K63-linkage specific | Recognize specific ubiquitin chain linkages [6] | Immunoblotting, immunofluorescence, enrichment |
| DUB Inhibitors | N-ethylmaleimide (NEM), PR-619 | Preserve ubiquitin signals during processing [4] | Cell lysis, stabilization of ubiquitinated proteins |
| Proteasome Inhibitors | Carfilzomib, MG132 | Stabilize degradative ubiquitination signals [4] | Accumulation of K48-linked ubiquitinated substrates |
Advanced Applications and Case Studies
PROTAC and Targeted Protein Degradation Analysis
The emergence of PROTACs (Proteolysis Targeting Chimeras) has highlighted the need for precise ubiquitination detection:
Challenge: PROTACs induce highly specific, but low stoichiometry ubiquitination of target proteins, requiring sensitive detection methods to validate mechanism of action [2] [4].
Solution: Chain-specific TUBE-based assays can differentiate between degradative (K48-linked) and non-degradative (K63-linked) ubiquitination induced by different compounds [2].
Case Study: RIPK2 ubiquitination analysis demonstrated that inflammatory stimulus L18-MDP induced K63-linked chains captured by K63-TUBEs, while a RIPK2 PROTAC induced K48-linked chains captured by K48-TUBEs [2].
Detection of Non-Proteinaceous Ubiquitination
Recent research has revealed an expanded substrate realm for ubiquitination:
Novel Finding: The ubiquitin ligase HUWE1 can ubiquitinate drug-like small molecules containing primary amino groups, not just proteins [7]. This represents a new frontier in ubiquitination research with implications for drug metabolism and development.
Detection Method: Compound ubiquitination was detected using MS/MS analyses following in vitro ubiquitination reactions, identifying Ub C-terminal peptides modified with compound masses [7].
Troubleshooting Guide: Addressing Common Experimental Problems
FAQ: Why are my ubiquitination signals weak even after enrichment?
Potential Causes and Solutions:
- Incomplete DUB Inhibition: Increase NEM concentration to 20mM and include additional DUB inhibitors [4]
- Protein Degradation: Use EDTA-free protease inhibitor cocktails and maintain samples at 4°C [5]
- Insufficient Enrichment: Scale up TUBE quantity or increase incubation time [2]
- Suboptimal Lysis Conditions: Implement semi-denaturing conditions with 4M urea [4]
- Proteasomal Degradation: Pre-treat cells with proteasome inhibitors (e.g., Carfilzomib) to preserve ubiquitinated species [4]
FAQ: How can I distinguish between genuine ubiquitination and background signals?
Validation Strategies:
- Control Enrichments: Include parallel samples with control beads without ubiquitin-binding entities [4]
- Genetic Validation: Express tagged ubiquitin and compare with endogenous detection [6]
- Site Mutation: Mutate putative ubiquitination sites (lysine to arginine) to confirm specificity [6]
- Multiple Methods: Confirm findings with orthogonal methods (e.g., TUBE enrichment + immuno-blotting) [2]
- Enzymatic Validation: Treat samples with deubiquitinases to demonstrate signal reversal [6]
FAQ: What are the best practices for sample preparation to preserve ubiquitination?
Critical Steps for Success:
- Rapid Processing: Process samples immediately after collection [5]
- Temperature Control: Maintain samples at 4°C during all steps [5]
- Comprehensive Inhibition: Use both protease and DUB inhibitors in all buffers [4]
- Avoid Autoclaving: Use HPLC-grade water and avoid detergents that interfere with MS [5]
- Quality Control: Monitor each step by Western blot or Coomassie staining [5]
Emerging Technologies and Future Directions
The field continues to evolve with new methodologies addressing the stoichiometry challenge:
- Improved TUBE Technologies: Development of higher affinity binders and additional linkage-specific reagents [2]
- Integrated Multi-omics Approaches: Combining ubiquitinomics with proteomics and transcriptomics [3]
- Single-Cell Ubiquitinomics: Adapting methods for single-cell resolution [1]
- Spatial Ubiquitinomics: Mapping ubiquitination within cellular compartments [3]
- Chemical Biology Tools: Developing activity-based probes for specific E3 ligases and DUBs [7]
As these technologies mature, they will progressively overcome the fundamental problem of low stoichiometry, making ubiquitination less elusive and enabling deeper understanding of its crucial biological functions.
Ubiquitination is a crucial post-translational modification that regulates diverse cellular functions, including protein degradation, activity, and localization. This process involves the covalent attachment of ubiquitin, a small 76-amino acid protein, to substrate proteins. The versatility of ubiquitination stems from its ability to create various ubiquitin architectures—from a single ubiquitin (monoubiquitination) to complex chains (polyubiquitination)—each with distinct cellular functions [8] [9].
FAQs: Core Concepts in Ubiquitin Biology
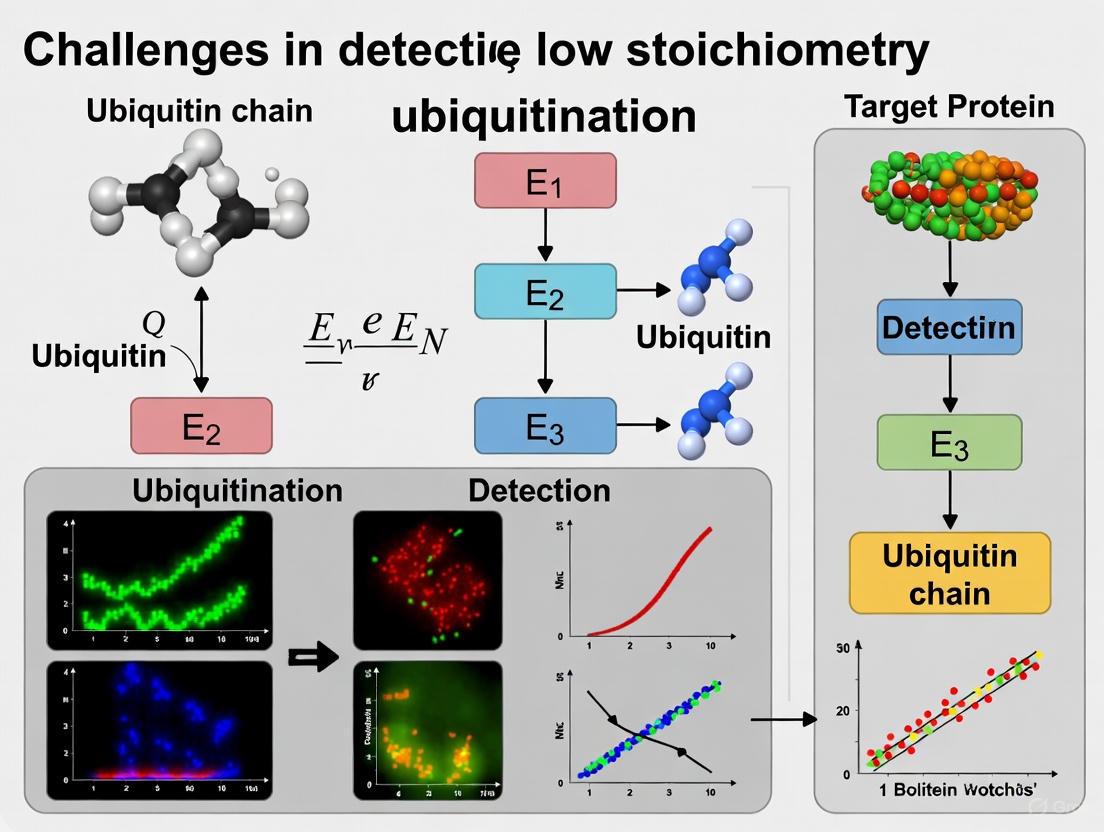
What is the fundamental enzymatic cascade governing ubiquitination? The ubiquitination process involves a sequential three-enzyme cascade:
- E1 (ubiquitin-activating enzyme): Activates ubiquitin in an ATP-dependent manner
- E2 (ubiquitin-conjugating enzyme): Accepts activated ubiquitin from E1
- E3 (ubiquitin ligase): Facilitates the transfer of ubiquitin from E2 to the specific substrate protein
This hierarchical system, with approximately 2 E1s, 40 E2s, and over 600 E3s in humans, allows for precise regulation and substrate specificity [8] [9].
How does monoubiquitination differ functionally from polyubiquitination?
- Monoubiquitination: Involves attachment of a single ubiquitin molecule to a substrate, primarily regulating endocytic trafficking, protein-protein interactions, and subcellular localization [9].
- Polyubiquitination: Features chains of ubiquitin molecules linked through specific lysine residues, with K48-linked chains predominantly targeting substrates for proteasomal degradation, while K63-linked chains typically regulate signaling pathways and protein interactions without degradation [8] [9].
Why is detecting low-stoichiometry ubiquitination events so challenging? The identification of protein ubiquitination sites presents significant challenges due to:
- Low stoichiometry of ubiquitinated proteins compared to the global proteome
- Dynamic and reversible nature of ubiquitination, balanced by deubiquitinating enzymes (DUBs)
- Complexity of ubiquitin chains with variations in length, linkage types, and architecture
- Technical limitations in enriching low-abundance ubiquitinated species from complex protein mixtures [10] [6].
Troubleshooting Guide: Experimental Challenges in Ubiquitination Detection
Challenge: Inefficient Enrichment of Ubiquitinated Substrates
Table 1: Comparison of Ubiquitin Enrichment Methodologies
| Method | Principle | Advantages | Limitations | Best Applications |
|---|---|---|---|---|
| Ubiquitin Tagging (His/Strep) | Expression of tagged ubiquitin in cells | Easy implementation; relatively low cost | Potential structural artifacts; infeasible for patient tissues | Screening ubiquitinated substrates in cell lines [6] |
| Antibody-Based Enrichment | Use of anti-ubiquitin antibodies (e.g., P4D1, FK1/FK2) | Works with endogenous ubiquitin; applicable to tissues | High cost; potential non-specific binding; sequence bias | Physiological conditions and clinical samples [10] [6] |
| Ubiquitin-Binding Domains (UBDs) | Utilization of proteins with natural ubiquitin affinity | Linkage-specific options available | Low affinity of single UBDs | Enrichment of specific ubiquitin chain types [6] |
| Antibody-Free Chemical Methods (AFUP) | Selective chemical labeling of ubiquitination sites | Avoids antibody limitations; excellent reproducibility | Requires specialized chemical expertise | Novel ubiquitination site discovery; quantitative studies [10] |
Solution: Implement the AFUP (Antibody-Free approach for Ubiquitination Profiling) method, which involves:
- Blocking all free amino groups with formaldehyde at the protein level
- Hydrolyzing ubiquitin chains using deubiquitinases (USP2 and USP21) to generate free lysine ε-NH₂ at ubiquitination sites
- Chemically labeling the liberated amines with NHS-SS-Biotin reagents
- Enriching labeled peptides using Streptavidin Sepharose
- Analyzing eluted peptides by LC-MS/MS [10]
This approach identified 349 ± 7 ubiquitination sites from 0.8 mg of HeLa proteins with excellent reproducibility (CV = 0.2%) and high quantitative stability (Pearson, r ≥ 0.91) [10].
Challenge: Differentiating Between Priming and Elongation in Polyubiquitination
Solution: Employ the "apyrase chase" strategy to uncouple priming from chain elongation:
- Set up reconstituted ubiquitination systems with priming E2 (UbcH5c) and elongating E2 (Cdc34b)
- Pre-assemble E3-substrate complexes
- Add apyrase (a potent ATP hydrolase) to deplete ATP and prevent new E2-Ub thioester formation
- Monitor decay rates of ubiquitinated substrates with defined chain lengths [11]
This approach revealed that UbcH5c-Ub thioester complexes are highly unstable (>93% disappearance within 1 minute), while Cdc34b-Ub complexes are relatively stable (24% remaining after 20 minutes), enabling temporal separation of priming and elongation events [11].
Essential Research Reagents and Tools
Table 2: Key Research Reagents for Ubiquitination Studies
| Reagent/Tool | Function/Application | Key Features | Experimental Considerations |
|---|---|---|---|
| E2 Enzymes (UbcH5c) | Priming monoubiquitination | Forms unstable thioester complexes with ubiquitin | Essential for initial substrate modification [11] |
| E2 Enzymes (Cdc34b) | Ubiquitin chain elongation | Forms stable thioester complexes; processive chain extension | Critical for polyubiquitin chain formation [11] |
| Reconstituted CRL Systems (CRL4CRBN, SCFβTrCP) | In vitro ubiquitination assays | Modular E3 ligase systems with defined substrates | Enable mechanistic studies of specific E3-substrate pairs [11] |
| Linkage-Specific Ubiquitin Antibodies | Detection of specific polyubiquitin chains | Recognize K48, K63, K11, etc. linkages | Essential for determining chain topology and function [6] |
| Deubiquitinases (USP2cc, USP21) | Ubiquitin removal in AFUP method | Broad linkage specificity | Generate free amines at ubiquitination sites for chemical labeling [10] |
| NHS-SS-Biotin Reagents | Chemical labeling in AFUP approach | Selective reaction with primary amines | Enables streptavidin-based enrichment of ubiquitinated peptides [10] |
Methodologies for Comprehensive Ubiquitination Analysis
Advanced Mass Spectrometry Approaches
Modern proteomic strategies have significantly advanced ubiquitination profiling:
- Di-Glycine Remnant Detection: Trypsin cleavage of ubiquitin-conjugated substrates leaves a characteristic di-glycine signature on modified lysines, detectable by MS as a 114.04 Da mass shift [8] [6].
- StUbEx PLUS System: Utilizes His-tagged ubiquitin inserted between serine 65 and threonine 66, though this may introduce structural artifacts [10].
- Ubiquitin COFRADIC: Involves blocking all primary amino groups, USP2cc-mediated ubiquitin removal, and introduction of hydrophobic groups for enrichment—highly specific but time-consuming [10].
Quantitative Profiling of Ubiquitination Dynamics
For studying ubiquitination dynamics in biological contexts:
- Combine AFUP with basic C18 pre-fractionation to identify >7,000 ubiquitination sites
- Normalize based on protein abundance to account for expression changes
- Apply statistical analysis to identify significantly regulated sites (e.g., 209 ubiquitination sites were significantly regulated in UBE2O knockdown cells) [10]
Visualization of Key Concepts
Ubiquitin Enzymatic Cascade and Priming-Elongation Mechanism
Detection Strategies for Low-Stoichiometry Ubiquitination
Ubiquitination is a critical yet complex post-translational modification that regulates virtually all cellular processes in eukaryotes, from protein degradation to signal transduction. Researchers face three fundamental technical hurdles when studying this system: the dynamic nature of modifications with rapid turnover, the exceptionally low stoichiometry at most sites, and the immense structural diversity of ubiquitin chains. The median ubiquitination site occupancy is three orders of magnitude lower than that of phosphorylation, spanning over four orders of magnitude across the proteome [1]. This combination of factors makes specific, sensitive detection of ubiquitination events particularly challenging. Recent advances in affinity-based enrichment tools and high-throughput detection platforms are now providing solutions to these long-standing problems, enabling more precise analysis of ubiquitination in both basic research and drug discovery contexts like PROTAC development.
Researcher FAQs: Addressing Fundamental Ubiquitination Questions
What makes ubiquitination detection so challenging compared to other post-translational modifications? Ubiquitination presents unique detection challenges due to three interconnected properties: (1) Extremely low stoichiometry - site occupancy is typically 1000-fold lower than phosphorylation, with the median site modified on only a tiny fraction of protein molecules [1]; (2) Rapid turnover - ubiquitination is highly dynamic, with most modifications rapidly removed by deubiquitinases or leading to proteasomal degradation; (3) Structural diversity - eight distinct ubiquitin chain linkages (M1, K6, K11, K27, K29, K33, K48, K63) create a complex landscape of potential signals with different biological functions [2].
How can I specifically detect K48 vs. K63 ubiquitin linkages in my protein of interest? Chain-specific TUBEs (Tandem Ubiquitin Binding Entities) enable selective capture of different ubiquitin chain types. For example, K63-TUBEs specifically capture RIPK2 when stimulated with L18-MDP (inducing K63-linked chains), while K48-TUBEs capture RIPK2 when treated with a PROTAC degrader (inducing K48-linked chains) [2]. Pan-selective TUBEs capture all chain types but don't distinguish between them. The choice between these tools depends on whether your research question requires linkage-specific information or global ubiquitination assessment.
What methods are available for high-throughput screening of ubiquitination in PROTAC development? ThUBD (Tandem Hybrid Ubiquitin Binding Domain)-coated 96-well plates provide an unbiased, high-affinity platform for high-throughput ubiquitination detection. This system captures proteins modified with all ubiquitin chain types and demonstrates a 16-fold wider linear range for capturing polyubiquitinated proteins compared to TUBE-coated plates [12] [13]. The method enables efficient quantification of ubiquitination signals from complex proteome samples, supporting PROTAC characterization and screening.
How does rapid turnover of ubiquitination affect experimental outcomes? The rapid turnover of ubiquitination means that conventional lysis methods often miss transient modifications. To preserve ubiquitination signals, lysis buffers must include deubiquitinase inhibitors (such as N-ethylmaleimide or PR-619) and be optimized to quickly inactivate cellular enzymes [2]. The half-life of ubiquitination varies significantly between sites, with those in structured protein regions exhibiting longer half-lives than those in unstructured regions [1].
Troubleshooting Guide: Common Experimental Challenges and Solutions
| Problem | Possible Causes | Solutions |
|---|---|---|
| Weak or no ubiquitination signal | Low stoichiometry of modification; Inefficient enrichment; Sample degradation | Use high-affinity capture reagents (ThUBD/OtUBD); Increase input material; Add fresh DUB inhibitors to lysis buffer [12] [14] |
| Inability to distinguish ubiquitin linkages | Use of pan-specific detection methods only | Employ chain-specific TUBEs (K48-selective, K63-selective); Validate with linkage-specific controls [2] |
| High background in detection | Non-specific binding; Incomplete washing | Optimize wash buffer stringency (increase salt, add mild detergent); Include specific blocking agents [12] |
| Poor reproducibility between experiments | Variable lysis conditions; Protease/DUB activity variations | Standardize lysis protocol precisely; Use fresh inhibitors; Process controls in parallel [2] [14] |
| Inconsistent results between techniques | Technical biases of different methods | Correlate mass spectrometry data with affinity enrichment; Use orthogonal validation methods [12] [2] |
Advanced Troubleshooting: Addressing Specific Scenarios
Challenge: Preserving Linkage-Specific Signals in Cellular Assays When studying specific biological contexts like inflammatory signaling (which often involves K63 linkages) or PROTAC-induced degradation (K48 linkages), maintaining the integrity of these specific chains is essential. Pre-treat cells with linkage-specific deubiquitinase inhibitors when available. For K63-linked chain analysis, validate your system with known positive controls like L18-MDP-stimulated RIPK2 in THP-1 cells [2]. For PROTAC studies, include a proteasome inhibitor (e.g., MG132) if measuring cumulative ubiquitination rather than turnover rate.
Challenge: Detecting Ubiquitination on Low-Abundance Proteins For proteins with inherently low abundance or very low modification stoichiometry, standard enrichment methods may yield insufficient material. Consider using the OtUBD affinity resin, which exhibits low nanomolar affinity for ubiquitin and can enrich both mono- and polyubiquitinated proteins effectively [14]. Combine denaturing and native purification workflows to distinguish directly ubiquitinated proteins from interactors.
Table 1: Performance Comparison of Ubiquitin Detection Technologies
| Technology | Affinity/Sensitivity | Linkage Bias | Throughput Capacity | Best Application |
|---|---|---|---|---|
| ThUBD-coated plates | 5 pmol polyUb chain capacity [12] | Unbiased to all chain types [13] | 96-well HTS format [12] | Global ubiquitination profiling, PROTAC screening |
| TUBE-based assays | Lower than ThUBD [12] | Variable by TUBE type [2] | 96-well format [2] | Linkage-specific applications |
| OtUBD affinity resin | Low nM range Kd [14] | Binds mono- and polyUb [14] | Low to medium | Proteomics sample preparation |
| Antibody-based methods | Highly variable | Often linkage-biased [12] | Medium (ELISA) | Target-specific assays |
Table 2: Key Ubiquitination Properties Affecting Detection
| Property | Quantitative Value | Experimental Impact |
|---|---|---|
| Median site occupancy | ~1000x lower than phosphorylation [1] | Requires highly sensitive enrichment methods |
| Occupancy range | Spans >4 orders of magnitude [1] | Dynamic range of detection must be wide |
| Response to proteasome inhibition | Strong upregulation for degradation-targeted sites [1] | Can be used to distinguish degradation signals |
| Half-life in structured regions | Longer than unstructured regions [1] | Affects required time resolution for capture |
Ubiquitination Detection Workflow Strategy
Essential Protocols for Overcoming Key Hurdles
Protocol: ThUBD-Coated Plate Ubiquitination Detection
Purpose: High-throughput, unbiased quantification of global ubiquitination signals or target-specific ubiquitination.
Materials:
- ThUBD-coated 96-well plates (Corning 3603 type) [12]
- Coating buffer: PBS or appropriate carbonate buffer
- Wash buffer: PBS with 0.1% Tween-20
- Blocking buffer: 3-5% BSA in PBS
- Detection antibody: Anti-target protein antibody or ThUBD-HRP
- Lysis buffer with DUB inhibitors (20mM N-ethylmaleimide, 1μM PR-619)
Procedure:
- Plate Preparation: Coat plates with 1.03μg ± 0.002 of ThUBD per well. Confirm binding capacity of ~5 pmol of polyubiquitin chains [12].
- Sample Preparation: Lyse cells in optimized buffer (including DUB inhibitors) to preserve ubiquitination. Pre-clear lysates if necessary.
- Incubation: Add samples to wells and incubate 2 hours at 4°C with gentle shaking.
- Washing: Wash 3-5 times with wash buffer to remove non-specifically bound proteins.
- Detection: Incubate with primary antibody against target protein, followed by HRP-conjugated secondary antibody, or use ThUBD-HRP for global ubiquitination detection.
- Quantification: Develop with appropriate substrate and measure signal.
Troubleshooting Notes: For low-abundance targets, increase incubation time to 4 hours. If background is high, increase salt concentration (up to 300mM NaCl) in wash buffer.
Protocol: Chain-Specific Ubiquitination Analysis Using TUBEs
Purpose: To specifically detect and quantify K48 or K63-linked ubiquitination on endogenous proteins.
Materials:
- Chain-specific TUBEs (K48-TUBE, K63-TUBE, Pan-TUBE)
- Coated plates or magnetic beads
- Stimuli: L18-MDP (for K63 signaling) or PROTAC (for K48 degradation)
- Cell lines: THP-1 (for inflammation models) or appropriate PROTAC-responsive lines
Procedure:
- Cellular Stimulation: For K63 analysis: treat THP-1 cells with 200-500 ng/ml L18-MDP for 30 minutes. For K48 analysis: treat with appropriate PROTAC concentration for designated time [2].
- Inhibition Controls: Pre-treat with specific inhibitors (e.g., Ponatinib for RIPK2) to confirm signal specificity.
- Lysis and Enrichment: Lyse cells in TUBE-compatible buffer and incubate with chain-specific TUBEs.
- Target Detection: Detect bound target protein by immunoblotting with specific antibodies.
- Validation: Use multiple TUBE types in parallel to confirm linkage specificity.
Application Example: This protocol successfully demonstrated that L18-MDP stimulates K63 ubiquitination of RIPK2 captured by K63-TUBEs, while RIPK2 PROTAC-induced ubiquitination was captured by K48-TUBEs [2].
The Scientist's Toolkit: Essential Research Reagents
Table 3: Key Reagents for Ubiquitination Research
| Reagent/Category | Specific Examples | Function and Application |
|---|---|---|
| Ubiquitin-Binding Domains | ThUBD, TUBEs, OtUBD | High-affinity capture of ubiquitinated proteins from complex mixtures [12] [2] [14] |
| Deubiquitinase Inhibitors | N-ethylmaleimide (NEM), PR-619 | Preserve ubiquitination signals during sample preparation by inhibiting DUB activity [14] |
| Chain-Specific Tools | K48-TUBE, K63-TUBE | Selective enrichment of linkage-specific ubiquitination events [2] |
| Detection Systems | ThUBD-coated 96-well plates, TUBE-based assays | High-throughput quantification of ubiquitination signals [12] [2] |
| Positive Controls | L18-MDP, PROTACs | Induce specific ubiquitination types for assay validation [2] |
| Proteasome Inhibitors | MG132, Bortezomib | Accumulate degradation-targeted ubiquitinated proteins [1] |
Research Reagent Selection Guide
Emerging Applications: From Basic Research to Therapeutic Development
The advanced detection methods described in this guide are enabling new applications across biological research and drug discovery. In PROTAC development, ThUBD-based platforms provide robust screening systems for evaluating compound efficacy and mechanism of action [12] [13]. In neurobiology, quantitative ubiquitination analysis has revealed how aging reshapes the brain's ubiquitin landscape, with dietary restriction partially reversing some aging-related ubiquitination patterns [15]. In inflammatory disease research, chain-specific TUBEs enable precise dissection of signaling pathways, demonstrating how K63 ubiquitination of RIPK2 drives inflammatory responses [2].
The discovery that ubiquitin ligases like HUWE1 can modify drug-like small molecules themselves [7] further expands the potential applications of these detection technologies. As the ubiquitin field continues to evolve, the tools and troubleshooting approaches outlined here will remain essential for researchers tackling the fundamental challenges of dynamic modification, rapid turnover, and structural diversity in the ubiquitin system.
Ubiquitination is a crucial post-translational modification that regulates nearly all cellular processes in eukaryotes, from protein degradation and DNA repair to immune signaling and cell cycle progression [6] [16] [17]. This versatile modification involves the covalent attachment of ubiquitin—a small 76-amino acid protein—to substrate proteins, creating signals that can be interpreted differently based on the length and linkage type of ubiquitin chains [17] [18]. Despite its fundamental importance, the detection and characterization of ubiquitination events face significant technical challenges, primarily due to the low stoichiometry of ubiquitination under normal physiological conditions and the astounding complexity of ubiquitin chain architectures [6] [17].
These detection gaps have profound consequences for understanding disease mechanisms. Dysregulation of ubiquitination is implicated in numerous pathologies, including cancers, neurodegenerative diseases, autoimmune disorders, and muscle-wasting conditions [6] [16] [19]. When researchers cannot accurately detect and quantify ubiquitination events, they miss critical insights into how these diseases initiate and progress, hindering the development of targeted therapies. This technical support resource addresses these challenges by providing troubleshooting guidance and practical solutions for researchers struggling with ubiquitination detection in their experiments.
The Ubiquitin Code: Complexity and Consequences
The Language of Ubiquitination
Ubiquitination creates a complex "ubiquitin code" through different modification types, each capable of triggering distinct cellular outcomes [17] [18]. Understanding this code is essential for proper experimental design and interpretation.
Table 1: Ubiquitin Linkage Types and Their Cellular Functions
| Linkage Type | Primary Cellular Functions |
|---|---|
| K48-linked | Targets substrates for proteasomal degradation [16] [17] [18] |
| K63-linked | Regulates protein-protein interactions, immune signaling, and kinase activation [6] [16] [18] |
| K11-linked | Cell cycle regulation and proteasomal degradation [16] |
| K6-linked | DNA damage repair, antiviral responses [16] [18] |
| K27-linked | Controls mitochondrial autophagy [16] |
| K29-linked | Cell cycle regulation, RNA processing [16] |
| K33-linked | T-cell receptor-mediated signaling [16] |
| M1-linked (Linear) | Regulates NF-κB inflammatory signaling and cell death [16] [18] |
The complexity extends beyond simple chain linkages. Ubiquitin chains can be homotypic (single linkage type), heterotypic (mixed linkages), or branched (multiple modification sites on a single ubiquitin molecule) [6] [17]. Furthermore, ubiquitin itself can be modified by phosphorylation, acetylation, and other ubiquitin-like proteins, creating additional layers of regulation that are exceptionally difficult to detect with current methodologies [17].
Detection Challenges and Disease Understanding
The technical limitations in ubiquitination detection directly impact disease research in several critical areas:
Low Stoichiometry: Under normal physiological conditions, only a small fraction of any given substrate is ubiquitinated at a specific time, making detection difficult against the background of non-ubiquitinated proteins [6]. This is particularly problematic when studying transient signaling events or low-abundance regulatory proteins.
Dynamic and Reversible Nature: Ubiquitination is counterbalanced by deubiquitinating enzymes (DUBs) that remove ubiquitin signals, making many ubiquitination events brief and transient [16] [20]. This reversibility necessitates careful timing of experiments and use of proteasome inhibitors like MG-132 to preserve signals [20] [18].
Linkage-Specific Blindness: Many conventional detection methods, particularly antibodies, show bias toward certain linkage types (especially K48 and K63 chains) while underrepresenting atypical linkages [6] [12]. This creates an incomplete picture of the ubiquitin landscape in disease states.
Diagram 1: The ubiquitination enzymatic cascade, showing the sequential action of E1, E2, and E3 enzymes, and the reverse reaction mediated by DUBs.
Troubleshooting Guide: Common Experimental Challenges
FAQ: Addressing Ubiquitination Detection Problems
Q1: Why do I get weak or no ubiquitination signal in my western blots, even with proteasome inhibition?
A: This common issue has multiple potential causes and solutions:
Insufficient Signal Preservation: While MG-132 and other proteasome inhibitors help, optimize concentration and treatment duration (typically 5-25 μM for 1-2 hours, but condition-specific) [20] [18]. Overexposure can cause cytotoxicity, while underexposure may not adequately preserve signals.
Improper Lysis Conditions: Use strong denaturing lysis buffers (containing SDS or urea) to inactivate DUBs and preserve ubiquitination. Avoid mild detergents that permit DUB activity during preparation [20].
Antibody Limitations: Many commercial ubiquitin antibodies have poor affinity and specificity. Validate your antibody using positive and negative controls. Consider alternatives to immunoblotting, such as TUBE-based assays or mass spectrometry [6] [18].
Q2: How can I distinguish between different ubiquitin chain linkage types in my experiments?
A: Linkage-specific detection remains challenging but several approaches exist:
Linkage-Specific Reagents: Use linkage-specific antibodies (available for K11, K48, K63, and M1 linkages) or ubiquitin-binding domains (UBDs) with known linkage preferences [6] [17]. Be aware that no single reagent captures all linkages equally.
Tandem Hybrid UBD (ThUBD) Technology: Recent advances like ThUBD-coated plates offer unbiased recognition of all ubiquitin chain types with high affinity, addressing the linkage bias problem [12] [13].
Mass Spectrometry: For comprehensive linkage analysis, use mass spectrometry with AQUA (absolute quantification) peptides or SILAC labeling, though this requires specialized equipment and expertise [21] [17].
Q3: My ubiquitination assays show high background noise. How can I improve specificity?
A: High background typically stems from non-specific binding or interference:
Affinity Purification Optimization: When using tagged ubiquitin (His, Strep, or FLAG), include competitive elution (imidazole for His-tag, biotin for Strep-tag) and extensive washing with buffers containing 0.1-0.5% Triton X-100 or similar detergents [6] [20].
Ubiquitin Traps: Commercial tools like ChromoTek Ubiquitin-Trap use high-affinity nanobodies specifically engineered for ubiquitin pulldowns, offering cleaner results with lower background compared to traditional antibodies [18].
Blocking Conditions: Extend blocking time (1-2 hours) and use 5% BSA in TBST instead of milk, which can reduce non-specific antibody binding.
Advanced Detection Methodologies
Real-Time Monitoring with Fluorescence Polarization
The UbiReal assay represents a significant advancement for kinetic studies of ubiquitination. This method uses fluorescently-labeled ubiquitin to monitor all stages of ubiquitin conjugation and deconjugation in real time through fluorescence polarization (FP) measurements [19].
Table 2: Comparison of Ubiquitination Detection Methods
| Method | Key Features | Detection Limitations | Optimal Use Cases |
|---|---|---|---|
| Immunoblotting | Widely accessible, semi-quantitative | Low throughput, antibody-dependent variability, linkage bias | Initial validation, low-budget studies |
| Tagged Ubiquitin Pulldowns | Enriches low-abundance ubiquitinated proteins | Tag may alter Ub function, co-purification of non-target proteins | Proteomic screening, substrate identification |
| UbiReal (FP-based) | Real-time kinetics, monitors complete cascade | Requires fluorescent Ub, specialized equipment | Enzyme mechanism studies, inhibitor screening |
| ThUBD-coated Plates | High-throughput, minimal linkage bias | Requires specialized plates | Drug discovery, PROTAC development, quantitative profiling |
| Mass Spectrometry | Identifies modification sites, can quantify linkages | Expensive, technically complex, requires large sample input | Comprehensive ubiquitome analysis, discovery research |
Protocol: UbiReal Assay Setup
Reaction Setup: Prepare 10-20 μL reactions in black, low-volume 384-well plates. Include 50-100 nM fluorescent ubiquitin (F-Ub or T-Ub), appropriate concentrations of E1, E2, and E3 enzymes in reaction buffer (50 mM Tris pH 7.5, 50 mM NaCl, 5 mM MgCl₂, 2 mM ATP) [19].
Real-Time Monitoring: Measure fluorescence polarization (FP) using a plate reader capable of FP detection (excitation 485 nm, emission 535 nm for fluorescein-labeled Ub). Take readings every 30-60 seconds to establish a kinetic profile [19].
Data Interpretation: FP increases as molecular weight increases during E1~Ub and E2~Ub thioester formation, and further during polyubiquitin chain formation. DUB activity is detected as decreasing FP signal [19].
Diagram 2: General workflow for ubiquitination detection, highlighting key challenge points where low stoichiometry can introduce artifacts.
High-Throughput Screening with ThUBD-Coated Plates
For drug discovery and PROTAC development, ThUBD-coated plates offer a robust solution for quantitative ubiquitination profiling:
Protocol: ThUBD-coated Plate Assay
Plate Preparation: Corning 3603-type 96-well plates coated with 1.03 μg ± 0.002 of ThUBD fusion protein provide optimal binding capacity for polyubiquitin chains [12].
Sample Binding: Incubate complex proteome samples (10-100 μg total protein) in binding buffer for 1-2 hours at 4°C with gentle agitation. The ThUBD platform demonstrates a 16-fold wider linear range for capturing polyubiquitinated proteins compared to traditional TUBE-coated plates [12] [13].
Detection and Quantification: Wash plates thoroughly and detect captured ubiquitinated proteins using anti-ubiquitin antibodies or direct fluorescence if using labeled samples. The system enables precise quantification of ubiquitination signals across all chain types without linkage bias [12].
Research Reagent Solutions
Table 3: Essential Reagents for Ubiquitination Research
| Reagent Type | Specific Examples | Function & Application |
|---|---|---|
| Ubiquitin Affinity Tools | ThUBD-coated plates, TUBE (Tandem Ubiquitin Binding Entities), Ubiquitin-Trap (ChromoTek) | High-affinity capture of polyubiquitinated proteins with minimal linkage bias; preserves ubiquitin conjugates from DUB activity [12] [18] |
| Tagged Ubiquitin | His-Ub, Strep-Ub, HA-Ub, FLAG-Ub | Purification of ubiquitinated proteins from cell lysates; identification of ubiquitination sites [6] [20] |
| Linkage-Specific Antibodies | K48-linkage specific, K63-linkage specific, M1-linkage specific (linear) | Detection of specific ubiquitin chain types; understanding chain-specific signaling in disease pathways [6] [17] |
| Proteasome Inhibitors | MG-132, Bortezomib (Velcade) | Stabilizes ubiquitinated proteins by blocking proteasomal degradation; enhances detection sensitivity [20] [18] |
| Activity-Based Probes | Ub-AMC, Ub-Rhodamine, Fluorescein-Ub (F-Ub) | Monitoring DUB activity; real-time tracking of ubiquitination cascade (UbiReal assay) [19] |
The limitations in current ubiquitination detection methodologies directly impact our understanding of disease mechanisms and therapeutic development. The low stoichiometry of ubiquitination, combined with the staggering complexity of the ubiquitin code, creates significant blind spots in our knowledge of how ubiquitination pathways malfunction in disease states. However, recent technological advances—including ThUBD-based capture platforms, real-time fluorescence polarization assays, and improved mass spectrometry workflows—are gradually bridging these detection gaps.
As these methods become more accessible and widely adopted, researchers will be better equipped to decipher the complex language of ubiquitin signaling in pathological conditions. This improved detection capability will accelerate drug discovery, particularly in the rapidly growing field of targeted protein degradation (PROTACs), and provide deeper insights into the molecular mechanisms of cancers, neurodegenerative diseases, and immune disorders linked to ubiquitination pathway dysregulation.
Methodological Arsenal: Experimental and Computational Approaches for Ubiquitination Detection
Troubleshooting Guides and FAQs
Q1: My ubiquitin enrichment experiment shows low signal intensity. What could be the cause and how can I improve it?
A: Low signal intensity during enrichment, especially for low-stoichiometry ubiquitination, is often due to low-affinity capture reagents or inefficient binding. Traditional Tandem Ubiquitin Binding Entities (TUBEs) can have limited affinity for polyubiquitinated proteins and may exhibit bias against certain ubiquitin chain types, missing critical signals [12].
- Solution: Switch to a high-affinity, unbiased capture agent. The ThUBD (Tandem Hybrid Ubiquitin Binding Domain) reagent, for example, is engineered for high affinity and lacks linkage bias, enabling more efficient capture of polyubiquitinated proteins from complex proteomes. Ensure your detection method, such as ThUBD-coated high-density 96-well plates, is optimized for high-sensitivity detection [12].
- Protocol Adjustment: Systematically optimize your coating and washing conditions. For ThUBD-coated plates, using Corning 3603-type plates and coating with 1.03 μg of ThUBD has been shown to specifically bind approximately 5 pmol of polyubiquitin chains. Using stringent but non-denaturing wash buffers can reduce non-specific binding without eluting your target [12].
Q2: How can I generate homogeneous, site-specifically conjugated antibodies for studying ubiquitination-related pathways?
A: Achieving homogeneous multimeric conjugates is challenging with conventional methods that rely on random lysine or cysteine conjugation. The "ubi-tagging" platform addresses this by repurposing the native ubiquitination machinery for site-directed conjugation [22] [23].
- Solution: Implement the ubi-tagging technique. This method uses recombinant E1, E2, and E3 ubiquitin enzymes to covalently link a "donor" ubiquitin fusion protein (e.g., an antibody-Ub(K48R)don) to an "acceptor" ubiquitin (Ubacc-ΔGG) that is fused to your payload (e.g., a fluorescent dye or peptide) [22].
- Protocol Summary:
- Prepare Components: Generate your ubi-tagged antibody or nanobody, for example, via CRISPR/HDR genomic engineering [22] [23].
- Set Up Reaction: In a conjugation reaction, combine:
- Donor ubi-tagged protein (10 µM)
- Acceptor ubi-tagged payload (50 µM)
- E1 enzyme (0.25 µM)
- E2-E3 fusion enzyme (e.g., gp78RING-Ube2g2 for K48 linkage, 20 µM) [22].
- Incubate: Allow the reaction to proceed for 30 minutes at room temperature.
- Purify: The conjugated product, such as a Rho-Ub2-Fab, can be purified using protein G or affinity chromatography [22]. This process consistently achieves conjugation efficiencies of 93-96% [23].
Q3: My immunoprecipitation for ubiquitinated proteins works with overexpressed targets but fails for endogenous proteins. How can I enhance enrichment for endogenous low-abundance targets?
A: This common issue highlights the need for enrichment strategies that preserve weak or transient interactions and are effective at native expression levels.
- Solution: Use chemically synthesized, defined ubiquitin variants as affinity matrices. Generate hydrolysis-resistant ubiquitin chains (e.g., using triazole linkages via click chemistry) to prevent cleavage by deubiquitinases (DUBs) in cell lysates. These stable chains can be immobilized on beads to enrich for specific ubiquitin-binding proteins from crude cell lysates under near-physiological conditions [24].
- Protocol Insight: For example, diubiquitin with a triazole linkage mimicking K27 chains can be synthesized using solid-phase peptide synthesis (SPPS) to incorporate an azido-ornithine and a propargylamine, followed by a copper-catalyzed azide-alkyne cycloaddition (CuAAC) reaction. This stable conjugate was key in identifying UCHL3 as a specific K27 interactor [24].
Experimental Protocols & Workflows
Detailed Protocol: High-Throughput Ubiquitination Detection Using ThUBD-Coated 96-Well Plates [12]
This protocol is designed for specific, rapid, and precise detection of protein ubiquitination in a high-throughput format.
Plate Coating:
- Coat Corning 3603-type 96-well plates with 1.03 μg ± 0.002 of ThUBD protein per well.
- Incubate overnight at 4°C or for 2 hours at room temperature.
- Block the plates with a suitable protein-free blocking buffer to prevent non-specific binding.
Sample Preparation and Binding:
- Prepare cell lysates using a non-denaturing lysis buffer containing protease and deubiquitinase inhibitors to preserve ubiquitination states.
- Add diluted lysate or purified ubiquitinated protein samples to the ThUBD-coated wells.
- Incubate for 1-2 hours at room temperature with gentle shaking to allow binding.
Washing:
- Wash wells thoroughly with a optimized washing buffer (e.g., PBS with 0.05% Tween-20) to remove unbound proteins and contaminants.
Detection:
- Add a detection reagent, such as ThUBD-HRP (Horseradish Peroxidase conjugate), and incubate.
- Develop the signal using a chemiluminescent or colorimetric substrate.
- Read the plates on a compatible microplate reader. The system can detect as little as 5 pmol of polyubiquitin chains.
Detailed Protocol: Site-Specific Antibody Conjugation via Ubi-Tagging [22]
This protocol describes how to create a fluorescently labeled Fab' fragment.
Reagent Preparation:
- Donor: Produce the Fab'-Ub(K48R)don construct. The K48R mutation prevents homodimerization.
- Acceptor: Synthesize Rho-Ubacc-ΔGG, where the C-terminal di-glycine is removed (ΔGG) to make it unreactive, and it is conjugated to a rhodamine fluorophore.
- Enzymes: Express and purify recombinant E1 and the K48-specific E2–E3 fusion enzyme gp78RING-Ube2g2.
Conjugation Reaction:
- Combine the following components in a reaction tube:
- 10 µM Fab'-Ub(K48R)don
- 50 µM Rho-Ubacc-ΔGG
- 0.25 µM E1 enzyme
- 20 µM gp78RING-Ube2g2 E2-E3 enzyme
- Incubate the reaction for 30 minutes at room temperature.
- Combine the following components in a reaction tube:
Product Purification and Validation:
- Purify the conjugated product, Rho-Ub2-Fab, using protein G affinity purification.
- Validate the conjugation using SDS-PAGE (observing a single fluorescent band) and ESI-TOF mass spectrometry to confirm the expected mass and homogeneity.
Ubi-tagging Conjugation Workflow
Research Reagent Solutions
The following table details key reagents and their functions for implementing advanced affinity-based enrichment strategies.
| Reagent / Tool | Primary Function | Key Advantage |
|---|---|---|
| ThUBD (Tandem Hybrid UBD) [12] | High-affinity capture of polyubiquitinated proteins in assays like TUF-WB or on coated plates. | Unbiased recognition of all ubiquitin chain linkage types; high sensitivity for low-stoichiometry targets. |
| ThUBD-Coated 96-Well Plates [12] | High-throughput screening and quantification of protein ubiquitination status. | Enables specific, rapid, and precise detection of ubiquitination signals from complex proteomes. |
| Ubi-Tagging Enzymes (E1, E2-E3) [22] | Site-specific, enzymatic conjugation of ubiquitin-fused payloads to antibodies/nanobodies. | Enables rapid (~30 min) generation of homogeneous conjugates with >93% efficiency. |
| Chemically Synthesized Ubiquitin Variants [24] | Serve as hydrolysis-resistant affinity baits for interactome studies (AE-MS). | Allows study of defined Ub chain types and identification of specific Ub-binding proteins. |
| PROTAC Assay Plates [12] | Commercial tool for monitoring protein ubiquitination. | Useful for initial screening, but may have limited sensitivity due to potential linkage bias of TUBEs. |
Ubiquitinated Protein Enrichment Workflow
The ubiquitin-proteasome system (UPS) is a fundamental regulatory mechanism controlling diverse biological pathways, from protein degradation to cell signaling. However, a central challenge in the field has been the global identification and quantification of ubiquitin substrates due to the low stoichiometry of ubiquitylation, making detection of endogenously modified proteins difficult without enrichment strategies. The development of antibodies specifically recognizing the diglycine (diGly) remnant left on lysine residues after tryptic digestion of ubiquitinated proteins has revolutionized this field. This technical support center provides troubleshooting guides and FAQs to help researchers overcome common obstacles in applying this powerful methodology to characterize the "ubiquitinome"—the array of proteins modified by the ubiquitin system.
Core Principles of diGly Remnant Capture
Fundamental Mechanisms
- diGly Remnant Generation: Trypsin cleavage of ubiquitinated proteins yields a characteristic "diGly remnant" on modified lysine residues due to cleavage of the C-terminal Arg-Gly-Gly sequence of ubiquitin [25].
- Antibody Specificity: Monoclonal antibodies specifically recognize this diGly-containing isopeptide, enabling immunoaffinity enrichment of ubiquitylated peptides from complex protein lysates [25] [26].
- Proteome Coverage: This approach has enabled identification of approximately 19,000 diGly-modified lysine residues within ~5,000 proteins in a single study, dramatically expanding our view of the ubiquitinome [25].
Specificity Considerations
The diGly-modified proteome represents a composite of proteins modified by ubiquitin and ubiquitin-like proteins (UBLs) with C-terminal diGly motifs:
- NEDD8: Contributes to diGly proteome; can be distinguished using USP2cc catalytic domain to deubiquitylate samples while preserving neddylation [25].
- ISG15: Minimal contribution in unstimulated cells (only 17 ISG15-derived diGly spectral counts detected versus >720,000 total diGly peptide counts) [25].
Troubleshooting Guides
Common Experimental Issues & Solutions
| Problem Scenario | Possible Causes | Recommended Solutions |
|---|---|---|
| Low yield of ubiquitylated peptides | Inefficient enrichment; insufficient starting material; suboptimal lysis | Use denaturing lysis buffer to inhibit DUBs [25]; Ensure 3mg peptide input for enrichment [26]; Perform sequential α-diGly immunoprecipitations [25] |
| Poor reproducibility between replicates | Variable enrichment efficiency; incomplete protease inhibition | Include protease/phosphatase inhibitors in lysis buffer [27]; Standardize sample processing timing; Use consistent trypsin digestion protocols |
| Inability to distinguish ubiquitin from UBL modifications | Antibody cross-reactivity with NEDD8/ISG15 diGly remnants | Treat extracts with USP2cc to remove ubiquitin while preserving NEDD8 modifications [25]; Check ISG15 expression status (absent in unstimulated cells) [25] |
| High background in MS analysis | Non-specific antibody binding; insufficient washing | Optimize antibody:peptide ratio; Increase wash stringency; Include control IgG IP; Use peptide-based affinity enrichment [26] |
| Protein degradation during sample processing | Inadequate inhibition of proteases/DUBs | Use ice-cold conditions [27]; Add protease inhibitors immediately [27]; Process samples quickly [27]; Snap-freeze in liquid nitrogen if not processing immediately [27] |
Quantitative Data Interpretation Challenges
| Observation | Biological Interpretation | Experimental Validation |
|---|---|---|
| Mixed regulation of sites within same protein | Distinct functional outcomes for individual lysines | Validate with site-directed mutagenesis; Classify sites using multi-classifier approach [25] |
| ~58% sites increase >2-fold after Btz | Accumulation of proteasome targets [25] | Compare with alternative proteasome inhibitor (e.g., epoxomycin) [25] |
| ~13% sites decrease >2-fold after Btz | Possible ubiquitin depletion effect [25] | Monitor ubiquitin pool; Assess charging of UBLs [25] |
| K11, K29, K48 linkages increase >2-fold | Proteasome-targeted linkages [25] | Compare linkage-specific antibodies; Use linkage-specific DUBs |
| K63 linkages largely unaffected | Non-proteasomal functions [25] | Assess pathway-specific activation |
Frequently Asked Questions (FAQs)
Sample Preparation & Experimental Design
Q: What are the critical steps for preserving ubiquitination states during sample collection? A: Maintain samples on ice-cold conditions to slow enzymatic reactions. Use denaturing lysis buffers to immediately block deubiquitylating enzyme (DUB) activity. Incorporate protease inhibitors and consider DUB inhibitors in your lysis protocol. Process samples quickly or snap-freeze in liquid nitrogen for storage at -80°C [25] [27].
Q: How much starting material is required for comprehensive ubiquitinome analysis? A: For cell cultures, typical protocols use 1-5 million cells per condition. For tissue samples, 50-100mg provides sufficient material. From 3mg of peptides, expect approximately 5μg yield after immunoaffinity enrichment [26] [27].
Q: Can the same protocol be applied across different species or tissues? A: While the core principles remain similar, optimization may be necessary. Different species and tissues have varying protein compositions and may require tailored lysis buffers or enrichment conditions for optimal results [27].
Technical & Methodological Considerations
Q: What is the typical enrichment efficiency and selectivity for diGly peptides? A: Studies report approximately 80% enrichment selectivity, determined by the number of peptide-spectrum matches (PSMs) of ubiquitylated peptides divided by total PSMs. Without enrichment, only about 0.02% of identified peptides are ubiquitylated [26].
Q: How do I validate that observed diGly sites genuinely represent ubiquitination? A: Use multiple approaches: (1) Treat samples with deubiquitylating enzymes like USP2cc prior to enrichment [25]; (2) Compare with negative controls using non-specific IgG; (3) Verify response to proteasome inhibition (e.g., bortezomib); (4) Use orthogonal methods like the IBAQ-Ub chemical proteomics approach [28] [29].
Q: What are the key considerations for quantitative studies of ubiquitination? A: For accurate quantification: (1) Use stable isotope labeling (SILAC, iTRAQ) [25] [26]; (2) Account for potential global proteome changes by parallel analysis of ubiquitinome and global proteome [26]; (3) Consider using the IBAQ-Ub method for stoichiometric analysis [28] [29]; (4) Perform multiple biological replicates to account for identification variability between runs [25].
Essential Experimental Protocols
Protocol 1: diGly Remnant Enrichment for Ubiquitinome Analysis
- Cell Lysis: Lyse cells in denaturing buffer (e.g., 8M urea, 50mM Tris-HCl, pH8.0) containing protease inhibitors and DUB inhibitors to preserve ubiquitination states [25].
- Protein Digestion: Reduce, alkylate, and digest proteins with trypsin (1:50 w/w ratio) at 37°C overnight [25] [26].
- diGly Peptide Enrichment: Incubate tryptic peptides with anti-diGly antibody conjugated to beads for 2-4 hours at 4°C. Perform 3-4 sequential immunoprecipitations to maximize yield [25].
- Wash and Elution: Wash beads extensively with ice-cold IP buffer, then elute diGly peptides with 0.1% TFA or low-pH buffer [25].
- LC-MS/MS Analysis: Desalt peptides and analyze by LC-MS/MS using high-resolution mass spectrometry [25] [26].
Protocol 2: Specificity Control Using USP2cc Treatment
- Prepare Cell Lysates: Lyse cells in non-denaturing buffer supplemented with DUB inhibitors.
- USP2cc Treatment: Incubate lysates with catalytic domain of USP2 (1μg/100μg protein) for 1-2 hours at 37°C [25].
- Terminate Reaction: Add denaturing buffer and heat at 95°C for 10 minutes.
- Process Samples: Continue with standard protein digestion and diGly enrichment protocol.
- Data Analysis: Compare USP2cc-treated samples with untreated controls; genuine ubiquitin signals should decrease by ≥50% while NEDD8 modifications remain [25].
Quantitative Data Interpretation Framework
Response to Proteasome Inhibition
Proteasome inhibition with bortezomib (1μM for 8 hours) reveals distinct classes of ubiquitination dynamics [25]:
Linkage-Specific Dynamics After Proteasome Inhibition
Quantitative diGly proteomics reveals distinct fates for different ubiquitin linkage types following proteasome inhibition [25]:
| Ubiquitin Linkage | Response to Proteasome Inhibition | Functional Interpretation |
|---|---|---|
| K48 linkages | Increase >2-fold | Primary proteasomal targeting signal |
| K11 linkages | Increase >2-fold | Proteasomal degradation |
| K29 linkages | Increase >2-fold | Proteasomal degradation |
| K63 linkages | Largely unaffected | Non-proteasomal functions (signaling, DNA repair) |
Research Reagent Solutions
Essential materials and reagents for successful diGly remnant capture experiments:
| Reagent | Function | Example Products |
|---|---|---|
| diGly Remnant Antibody | Immunoaffinity enrichment of ubiquitylated peptides | Cell Signaling Technology #5562; Various monoclonal antibodies [25] |
| Protease Inhibitors | Prevent protein degradation during sample preparation | Complete Mini EDTA-free (Roche); PMSF; Various protease inhibitor cocktails [27] |
| Deubiquitylating Enzyme Inhibitors | Preserve ubiquitination states | N-ethylmaleimide; PR-619; Ubiquitin Aldehyde |
| USP2 Catalytic Domain | Specific removal of ubiquitin while preserving NEDD8 | Recombinant USP2cc (used to distinguish ubiquitin from NEDD8 modifications) [25] |
| Proteasome Inhibitors | Validate ubiquitination accumulation | Bortezomib; Epoxomycin; MG132 [25] |
| Stable Isotope Labels | Quantitative proteomics | SILAC (K8; Lys+8Da); iTRAQ reagents; TMT labels [25] [26] |
| Mass Spec Standards | System performance validation | Pierce HeLa Protein Digest Standard (Cat. No. 88328) [30] |
| Retention Time Calibrants | LC system troubleshooting | Pierce Peptide Retention Time Calibration Mixture (Cat. No. 88321) [30] |
Advanced Methodologies
IBAQ-Ub for Stoichiometric Analysis
The Isotopically Balanced Quantification of Ubiquitination (IBAQ-Ub) approach enables site-specific stoichiometry analysis:
- Utilizes an amine-reactive chemical tag (AcGG-NHS) structurally homologous to the GG remnant [28] [29].
- Generates structurally identical peptides from ubiquitinated and unmodified lysine residues after trypsin digestion [28] [29].
- Enables absolute quantification of fractional abundance of ubiquitination [28] [29].
Integrated Global and Ubiquitylated Proteome Analysis
For comprehensive understanding:
- Analyze both ubiquitin-modified proteome and cognate global proteome from the same samples [26].
- Use isobaric tags (iTRAQ, TMT) for multiplexed relative quantification [26].
- Identify proteins with specific changes in ubiquitylation independent of global protein level changes [26].
This technical support resource will continue to evolve as new methodologies and troubleshooting insights emerge in the rapidly advancing field of ubiquitinomics.
Troubleshooting Guides and FAQs
Low or No Ubiquitination Signal
Q: My high-throughput assay shows a weak or absent ubiquitination signal, even though my protein of interest is expressed. What could be wrong?
A: This is a common challenge when detecting low-stoichiometry ubiquitination events. The issue often lies with the ubiquitin-binding tool's affinity or the lysis conditions.
- Possible Cause: Low-Affinity Capture Reagent. Traditional tools like TUBE (Tandem Ubiquitin Binding Entities) may have insufficient affinity or exhibit linkage bias, failing to capture ubiquitinated proteins present at low abundances [13].
- Solution: Implement a high-affinity, linkage-independent capture platform. ThUBD (Tandem Hybrid Ubiquitin Binding Domain)-coated plates demonstrate a 16-fold wider linear range for capturing polyubiquitinated proteins compared to TUBE-coated plates, significantly enhancing sensitivity for detecting low-stoichiometry events [13] [31].
- Possible Cause: Denaturing Lysis Conditions. The use of stringent lysis buffers, such as RIPA buffer (which contains ionic detergents like sodium deoxycholate), can disrupt protein-protein interactions and denature enzymes, thereby preventing ubiquitination during the assay [32].
- Solution: Use a milder, non-denaturing cell lysis buffer (e.g., Cell Lysis Buffer #9803) for immunoprecipitation and co-immunoprecipitation experiments. Ensure sonication is performed to adequately shear DNA and recover proteins without disrupting complexes [32].
High Background or Non-Specific Signal
Q: I am getting multiple non-specific bands or high background in my detection. How can I improve the specificity?
A: High background is frequently caused by non-specific binding to solid supports or antibody cross-reactivity.
- Possible Cause: Non-Specific Binding to Beads. Proteins can bind non-specifically to the Protein A or G beads themselves, or to the IgG of the antibody used for pulldown [32].
- Solution:
- Include a bead-only control (beads incubated with lysate without a specific antibody) to identify proteins that bind non-specifically to the beads. If this control shows background, pre-clear your lysate by incubating it with beads alone before the IP [32].
- Include an isotype control (an antibody of the same species and isotype but without specificity for your target) to distinguish background caused by non-specific IgG binding [32].
- Possible Cause: Detection of Antibody Heavy and Light Chains. When the primary antibody used for the western blot is from the same species as the IP antibody, the secondary antibody will detect the denatured IgG chains (~25 kDa and ~50 kDa), which can obscure your target signal [32].
- Solution:
- Use antibodies from different host species for the IP and the western blot (e.g., rabbit for IP, mouse for western blot) [32].
- Use a biotinylated primary antibody for western blotting, followed by detection with Streptavidin-HRP [32].
- Use a light-chain specific secondary antibody for western blotting if your target protein does not migrate near 25 kDa [32].
Distinguishing Ubiquitination Types
Q: How can I determine if my protein is modified by polyubiquitin chains or multiple mono-ubiquitination events?
A: This requires a method that can differentiate between these two types of modifications.
- Solution: A key method is a DTT-sensitive thio-ester assay. In this assay, E2~Ub thio-ester intermediates are sensitive to DTT (or β-mercaptoethanol) treatment, which cleaves the bond, causing a mobility shift on a western blot. In contrast, isopeptide bonds formed in polyubiquitination or multi-mono-ubiquitination are stable in the presence of DTT [33]. By running samples with and without DTT in the SDS sample buffer, you can distinguish between these linkages. The protocol involves incubating E1, E2, and ubiquitin, then splitting the reaction into +/- DTT samples before SDS-PAGE and western blot analysis [33].
Experimental Protocols for Ubiquitination Cascades
Protocol 1: DTT-Sensitive Thio-Ester Assay for E2~Ub Intermediate
This protocol tests the activity of a ubiquitin-conjugating enzyme (E2) by detecting the formation of a thio-ester linkage with ubiquitin [33].
Detailed Methodology:
- Reaction Setup: In a total volume of 30 µL, combine:
- 1.5 µL of 20x Reaction Buffer
- 50 ng of E1 enzyme
- 200-500 ng of recombinant E2 enzyme
- 2 µg of Ubiquitin
- Incubation: Incubate the reaction at 37°C for 5 minutes.
- Sample Splitting: Split the reaction into two equal parts. Add 10 µL of 4x SDS sample buffer with DTT to one tube and 10 µL of 4x SDS sample buffer without DTT to the other.
- Denaturation: Boil both samples at 100°C for 5 minutes.
- Detection: Resolve the products on a 12% SDS-PAGE gel. Perform western blotting using an anti-ubiquitin antibody or an antibody against the tag fused to the E2 protein (e.g., anti-His). The DTT-sensitive thio-ester linkage will be present in the "-DTT" lane and disappear in the "+DTT" lane [33].
Protocol 2: In Vitro E3 Autoubiquitination Assay
This protocol assesses the E3 ligase activity of a protein of interest [33].
Detailed Methodology:
- Immobilize E3 Ligase: If using a tagged E3 (e.g., MBP-E3), immobilize 0.5-1 µg of the protein from a crude extract onto amylose resin beads. Wash the beads thoroughly with an appropriate buffer (e.g., 50 mM Tris-HCl, pH 7.5).
- Reaction Setup: To the beads containing the immobilized E3, add a 30 µL reaction mixture containing:
- 1.5 µL of 20x Reaction Buffer
- 50 ng of E1 enzyme
- 200-500 ng of E2 enzyme
- 5 µg of Ubiquitin
- Control Reactions: Set up control reactions minus E1 and minus E2.
- Incubation: Incubate the reactions at 30°C for 1.5 hours with constant agitation (e.g., 900 rpm in a thermomixer).
- Detection: Add 10 µL of 4x SDS sample buffer (with DTT), boil, and run on an 8-12% SDS-PAGE gel. Detect the ubiquitinated E3 by western blot using an anti-ubiquitin antibody or an antibody against the tag fused to the ubiquitin or E3 protein [33].
Protocol 3: High-Throughput Ubiquitination Profiling with ThUBD-Coated Plates
This protocol leverages a novel technology for the sensitive, high-throughput detection of ubiquitination signals from complex samples, directly addressing low stoichiometry challenges [13] [31].
Detailed Methodology:
- Plate Preparation: Use 96-well plates pre-coated with the high-affinity Tandem Hybrid Ubiquitin Binding Domain (ThUBD).
- Sample Application: Apply complex proteome samples (from cells, tissues, or other biological sources) to the wells. The ThUBD domain will unbiasedly capture proteins modified with all types of ubiquitin chains.
- Incubation and Washing: Incubate to allow binding, then wash the plates to remove non-specifically bound material.
- Detection and Quantification: Detect the captured ubiquitinated proteins using specific antibodies (for target-specific analysis) or general ubiquitin detection reagents (for global profiling). The high affinity of ThUBD allows for precise quantification of the ubiquitination signal [13] [31].
Research Reagent Solutions
Table 1: Essential reagents for studying ubiquitination cascades.
| Reagent/Kit | Function/Brief Explanation | Key Feature / Application Context |
|---|---|---|
| ThUBD-Coated Plates [13] [31] | High-throughput, sensitive capture of ubiquitinated proteins. | Unbiased, high-affinity binding to all ubiquitin chain linkages; 16x wider linear range than TUBEs. Ideal for global profiling and low-stoichiometry detection. |
| TUBE (Tandem Ubiquitin Binding Entity) [13] | Capture and enrichment of polyubiquitinated proteins. | Affinity-based tool; can exhibit linkage bias and lower affinity compared to ThUBD. |
| Anti-Ubiquitin Antibodies [33] | Detection of ubiquitinated proteins via western blot. | Crucial for visualizing ubiquitination in assays like E2 thio-ester and E3 autoubiquitination. |
| Tag-Specific Antibodies (e.g., Anti-His, Anti-MBP) [33] | Detection of recombinant, tagged proteins (E1, E2, E3, Ub) in assays. | Enables specific monitoring of individual components in the ubiquitination cascade. |
| Nickel-HRP [33] | Direct detection of His-tagged proteins on western blots. | Useful for detecting His-tagged ubiquitin in in vitro assays without a primary antibody. |
| Mild Cell Lysis Buffer [32] | Extraction of proteins under non-denaturing conditions. | Preserves protein-protein interactions and enzymatic activities for functional ubiquitination assays. |
| Protease/Phosphatase Inhibitor Cocktails [32] | Prevent protein degradation and maintain post-translational modifications during lysis. | Essential for preserving the native ubiquitination state of proteins. |
The Scientist's Toolkit: Visualizing the Workflow
Ubiquitination Cascade Pathway
High-Throughput Detection Workflow
Frequently Asked Questions (FAQs)
Q1: Why should I use computational predictors for ubiquitination sites instead of traditional experimental methods?
Experimental techniques like mass spectrometry (MS) for identifying ubiquitination sites (Ubi-sites) can be costly, time-consuming, and challenging, particularly for low-stoichiometry ubiquitination events that are transient or rare. Computational tools leverage artificial intelligence to analyze protein sequences and predict potential Ubi-sites rapidly and cost-effectively, helping to prioritize targets for wet-lab validation and offering insights into regulatory mechanisms [34].
Q2: What is the typical input data format required by these prediction tools?
Most tools, such as UbPred, require a protein sequence in FastA format as input. The sequence should ideally be 25 or more residues long and must contain at least one lysine (K) residue, as ubiquitination occurs at lysine side chains [35].
Q3: I need to run predictions on multiple sequences. Why am I limited to one sequence at a time with some web servers?
Some servers, like UbPred, perform evolutionary feature extraction by running PSI-BLAST to create Position-Specific Scoring Matrices (PSSMs). This process is computationally intensive and can take up to 45 minutes per sequence. To manage server load and prevent excessive wait times for all users, these services often limit the number of concurrent requests per user [35].
Q4: What do the confidence scores (e.g., Low, Medium, High) in the prediction output mean?
Confidence scores are based on the predictor's output score and correspond to different levels of estimated sensitivity and specificity. For example, UbPred uses the following ranges [35]:
| Confidence Label | Score Range | Sensitivity | Specificity |
|---|---|---|---|
| Low | 0.62 – 0.69 | 0.464 | 0.903 |
| Medium | 0.69 – 0.84 | 0.346 | 0.950 |
| High | 0.84 – 1.00 | 0.197 | 0.989 |
A "High" confidence prediction has very high specificity (low chance of being a false positive) but lower sensitivity, meaning it will identify fewer true positives.
Q5: Which tool is better for my research, UbPred or a newer tool like Ubigo-X?
The choice depends on your specific needs. UbPred is a well-established random forest-based predictor that was primarily trained on data from S. cerevisiae (yeast) and uses sequence and evolutionary features [36]. Ubigo-X is a more recent, species-neutral deep learning model that integrates multiple feature types, including k-mer sequences and structural features, and has demonstrated strong performance on balanced and imbalanced human data [37]. For human proteome studies, especially with large datasets, newer deep learning models may offer advantages.
Q6: What are the key performance metrics for comparing different Ubi-site prediction tools?
Key metrics to compare tools include [37] [34]:
- AUC (Area Under the ROC Curve): Measures the overall ability to distinguish between positive and negative sites. Closer to 1.0 is better.
- Accuracy (ACC): The proportion of total correct predictions.
- Precision: The proportion of predicted positive sites that are correct.
- Recall (Sensitivity): The proportion of actual positive sites that are correctly identified.
- MCC (Matthews Correlation Coefficient): A more reliable metric for imbalanced datasets, with a range of -1 to +1.
Troubleshooting Guides
Issue: Long Wait Times for Online Prediction Results
Problem: Submission of a protein sequence to a web server (e.g., UbPred) results in a notification of a long processing time, or results are delivered via email after a significant delay.
Explanation: This occurs when the server needs to generate a new PSSM profile for your sequence using PSI-BLAST, which is a computationally expensive process. The delay is due to the queue of jobs from other users [35].
Solution:
- Be Patient: The server may take up to 45 minutes for a single sequence.
- Use a Standalone Version: If available, download and install the standalone version of the tool (e.g., UbPred offers Linux and Windows versions) to run predictions locally on your own hardware without queue delays [35].
- Explore Alternative Tools: Consider using other predictors that may have different computational backends or faster processing times for high-throughput analysis.
Issue: Handling Class Imbalance in Custom Model Training
Problem: When training your own deep learning model for Ubi-site prediction, the model achieves high accuracy but poor recall for the positive class (ubiquitinated sites). This is because non-ubiquitinated sites vastly outnumber ubiquitinated ones.
Explanation: This is a classic class imbalance problem. A model can appear accurate by simply always predicting "no," but it fails to identify the sites of actual interest [34].
Solution:
- Use Appropriate Metrics: Rely on metrics like AUC, MCC, and F1-score instead of raw accuracy to evaluate your model's true performance [36] [34].
- Apply Resampling Techniques: Use oversampling techniques (e.g., SMOTE) on the minority class or undersampling on the majority class during training.
- Adjust Class Weights: Most deep learning frameworks allow you to assign higher weights to the loss function for the minority class, forcing the model to pay more attention to it.
- Utilize Validated Frameworks: Refer to existing benchmarks that have tackled this issue. For example, Ubigo-X was tested on imbalanced data (1:8 ratio) and achieved an AUC of 0.94, demonstrating a robust strategy for handling imbalance [37].
Issue: Poor Prediction Performance on Human Protein Data
Problem: A predictor that was trained on model organisms (e.g., yeast) shows unreliable results when applied to human protein sequences.
Explanation: Models can suffer from a lack of generalizability if the training data is not representative of the target application. Features and sequence contexts important for ubiquitination may differ across species.
Solution:
- Choose a Species-Neutral Tool: Opt for tools explicitly designed for cross-species prediction. For instance, Ubigo-X is reported to be a potential species-neutral tool [37].
- Use Tools Trained on Human Data: Leverage models and benchmarks built specifically for the human proteome. Recent studies have curated human-specific datasets from databases like dbPTM for this purpose [34].
- Transfer Learning: If building your own model, consider using a transfer learning approach. Pre-train a model on a large, diverse dataset and then fine-tune it on a smaller, curated set of human Ubi-sites. The DeepTL-Ubi tool is an example of this methodology [34].
Comparative Performance of Ubiquitination Site Prediction Tools
The following table summarizes the performance of various tools and approaches as reported in the literature, providing a basis for tool selection.
| Tool / Model | Methodology | Key Features | Reported Performance (Metric / Value) |
|---|---|---|---|
| UbPred [35] [36] | Random Forest | Evolutionary (PSSM) profiles, sequence features | AUC: 0.80, Balanced Accuracy: 72% |
| Ubigo-X [37] | Deep Learning (ResNet34, XGBoost) | k-mer sequences, structural/functional features, weighted voting | Balanced Data: AUC: 0.85, ACC: 0.79, MCC: 0.58Imbalanced Data (1:8): AUC: 0.94, ACC: 0.85 |
| Deep Learning Hybrid Model [34] | Deep Neural Network (DNN) | Raw sequences + hand-crafted features | F1-score: 0.902, ACC: 0.8198, Precision: 0.8786, Recall: 0.9147 |
| Conventional ML Models [34] | SVM, RF, etc. | Hand-crafted features (e.g., AAC, PCPs) | Generally lower performance than DL methods, particularly in recall |
Experimental Protocol: In Vitro Ubiquitination Conjugation Assay
This protocol outlines a foundational biochemical method for validating ubiquitination, which can be used to confirm predictions from computational tools.
1. Objective To reconstitute the ubiquitination reaction in a test tube using purified enzymes and substrate to verify if a predicted lysine residue on a target protein is ubiquitinated.
2. Research Reagent Solutions
| Reagent | Function / Explanation |
|---|---|
| E1 Activating Enzyme | Activates ubiquitin in an ATP-dependent manner, forming the E1~Ub thioester intermediate [16]. |
| E2 Conjugating Enzyme | Accepts activated ubiquitin from E1, forming an E2~Ub thioester complex. The choice of E2 can influence linkage specificity [16]. |
| E3 Ubiquitin Ligase | Recognizes the specific substrate and catalyzes the transfer of ubiquitin from the E2~Ub to the substrate's lysine ε-amino group, forming an isopeptide bond [16] [36]. |
| Ubiquitin | The 76-amino acid modifier protein that is covalently attached to the substrate [16]. |
| Target Substrate Protein | The purified protein containing the computationally predicted ubiquitination site(s). |
| ATP & Mg²⁺ | Provides the necessary energy and cofactors for the E1-mediated activation step [16]. |
| Reaction Buffer | Provides optimal pH and ionic conditions for enzyme activity (typically Tris or HEPES-based) [38]. |
3. Procedure a. Reaction Setup: Combine the following components in a microcentrifuge tube on ice: * Reaction Buffer * 1-2 µg of target substrate protein * 100-200 nM E1 enzyme * 1-5 µM E2 enzyme * 0.1-1 µM E3 ligase * 50-100 µM Ubiquitin * 2 mM ATP * 5 mM MgCl₂ * Nuclease-free water to the final volume. b. Control Reactions: Always include negative control reactions. Essential controls include: * No E3: To confirm ubiquitination is E3-dependent. * No ATP: To confirm the reaction is energy-dependent. * Substrate with a K→R mutation: Where the predicted lysine is mutated to arginine to confirm the specific site of modification. c. Incubation: Incubate the reaction mixture at 30°C for 1-2 hours. d. Termination & Analysis: Stop the reaction by adding SDS-PAGE loading buffer (with or without reducing agent). Analyze the products by: * Western Blotting: Resolve the proteins by SDS-PAGE and immunoblot with an antibody against your target substrate to observe an upward molecular weight shift. Alternatively, use an anti-ubiquitin antibody to detect the ubiquitinated species [16] [38]. * Mass Spectrometry: For precise site mapping, the reaction can be scaled up, the substrate purified, and analyzed by MS to confirm the exact lysine residue modified [36] [34].
4. Workflow Diagram
Tool Selection and Application Workflow
The following diagram outlines a logical pathway for researchers to select and apply computational tools for ubiquitination site identification, culminating in experimental validation.
In ubiquitination research, a fundamental hurdle is the low stoichiometry of this modification; under normal physiological conditions, only a tiny fraction of a given protein substrate is ubiquitinated at any moment [6] [39]. This makes identifying and studying these modifications particularly challenging. The choice of detection method is therefore critical and must be aligned with the specific research question, the type of sample available, and the required depth of information. This guide provides a structured approach to selecting the right methodology, complete with detailed protocols and troubleshooting advice, to successfully navigate the complexities of ubiquitination detection.
Ubiquitination Detection Methodologies at a Glance
The table below summarizes the core techniques available for ubiquitination detection, highlighting their primary applications and considerations for use.
| Method | Key Principle | Best Suited For | Key Advantages | Key Limitations |
|---|---|---|---|---|
| Ubiquitin Tagging (e.g., His/Strep-tag) [6] | Expression of affinity-tagged ubiquitin in cells; enrichment of ubiquitinated proteins via tag-specific resins. | High-throughput screening of ubiquitinated substrates in cultured cell lines. | Relatively low-cost; easy to implement for cellular screens. | Not feasible for animal or patient tissues; potential for artifacts from tagged ubiquitin. |
| Antibody-Based Enrichment [6] [39] [40] | Use of anti-ubiquitin or anti-K-ε-GG antibodies to enrich ubiquitinated proteins or peptides from complex lysates. | Profiling endogenous ubiquitination in diverse samples, including tissues; studying specific chain linkages. | Applicable to clinical/animal samples; linkage-specific antibodies available. | Antibody cost; potential for non-specific binding; sequence bias (for K-ε-GG). |
| Ubiquitin-Binding Domain (UBD) [6] | Utilization of natural protein domains with high affinity for ubiquitin to pull down ubiquitinated proteins. | Enriching for polyubiquitinated proteins and studying chain architecture. | Targets endogenous ubiquitination. | Lower affinity for monoubiquitination; limited site information without MS. |
| Antibody-Free MS (AFUP) [10] | Chemical blocking of free amines, enzymatic removal of ubiquitin, and selective labeling of newly exposed ubiquitination sites. | Deep, unbiased profiling of the ubiquitinome without antibody-related sequence bias. | High throughput and reproducibility; identifies novel sites; avoids antibody cost. | Requires specialized chemical and enzymatic steps; may not preserve linkage information. |
| Western Blot / Immunoblot [6] [39] | Detection of ubiquitinated proteins using anti-ubiquitin antibodies, visualized as higher molecular weight smears or ladders. | Validating ubiquitination of a specific protein of interest; assessing global ubiquitination levels. | Widely accessible; provides information on molecular weight shifts. | Low-throughput; does not provide specific site information. |
| Immunoprecipitation (IP) [39] | Antibodies against the target protein or ubiquitin are used to immunoprecipitate and concentrate the ubiquitinated species for detection (often by WB). | Confirming the ubiquitination status of a specific, known protein substrate. | Confirms specific substrate modification. | Co-precipitates interacting proteins, which can complicate interpretation. |
Detailed Experimental Protocols
Protocol 1: Large-Scale Ubiquitinome Profiling Using Tandem Ubiquitin-Binding Entities (TUBEs)
This protocol is designed for the system-wide enrichment and identification of ubiquitinated proteins from cell lysates, ideal for discovering novel ubiquitination substrates or studying global changes in ubiquitination.
Key Research Reagent Solutions:
- TUBE Agarose Beads: Tandem-repeated ubiquitin-binding entities (e.g., from specific DUBs or UBDs) with high affinity for polyubiquitin chains, used for enrichment [6].
- Proteasome Inhibitor (e.g., MG132): Prevents the degradation of ubiquitinated proteins, thereby increasing their abundance for detection [40].
- Deubiquitinase (DUB) Inhibitor (e.g., PR-619): Preserves the ubiquitin signal by inhibiting enzymes that remove ubiquitin [40].
- Lysis Buffer: Must contain strong denaturants like 1% SDS to inactivate endogenous DUBs and proteases, preserving the ubiquitination state.
Procedure:
- Cell Treatment and Lysis: Treat cells with 10 µM MG132 for 4-6 hours before harvesting. Lyse cells in a pre-heated (95°C) lysis buffer containing 1% SDS and 50 mM N-ethylmaleimide (a DUB inhibitor). Immediately boil the lysates for 10 minutes to fully denature proteins and inactivate enzymes.
- Lysate Clarification and Dilution: Centrifuge the boiled lysates at 20,000 x g for 15 minutes to remove insoluble debris. Dilute the supernatant 10-fold with a non-SDS buffer to reduce the SDS concentration below 0.1% for compatibility with the affinity beads.
- Enrichment with TUBE Beads: Incubate the diluted lysate with TUBE agarose beads for 2 hours at 4°C with gentle rotation.
- Washing: Pellet the beads and wash them stringently with a series of buffers, typically starting with high-salt buffer (e.g., 500 mM NaCl), followed by a no-salt buffer, to remove non-specifically bound proteins.
- Elution: Elute the bound ubiquitinated proteins using Laemmli sample buffer containing 1% β-mercaptoethanol by boiling for 5-10 minutes.
- Downstream Analysis: The eluate can be analyzed by Western Blot for a general assessment or processed for mass spectrometry. For MS, the proteins are digested with trypsin, and the resulting peptides can be analyzed directly or further enriched for K-ε-GG-containing peptides.
Protocol 2: Site-Specific Ubiquitination Mapping via Anti-K-ε-GG Immunoaffinity Enrichment
This method provides the highest level of detail by identifying the exact lysine residues on a protein that are modified by ubiquitin.
Key Research Reagent Solutions:
- Anti-K-ε-GG Antibody Beads: monoclonal antibodies specifically recognizing the di-glycine (K-ε-GG) remnant left on trypsinized peptides from ubiquitination sites [10] [40].
- Trypsin / Lys-C: Protease enzymes used to digest proteins into peptides. The specificity of trypsin creates the K-ε-GG remnant.
- C18 StageTips: Micro-columns for desalting and concentrating peptide samples prior to and after enrichment.
Procedure:
- Protein Digestion: Dissolve or dilute the protein sample (e.g., whole cell lysate or TUBE-enriched proteins) in a urea-based digestion buffer. Reduce disulfide bonds with dithiothreitol (DTT) and alkylate with iodoacetamide. Digest first with Lys-C, then dilute the urea concentration and digest with trypsin overnight at 37°C.
- Peptide Desalting: Acidify the digest with trifluoroacetic acid (TFA) and desalt the peptides using C18 StageTips or solid-phase extraction columns. Lyophilize the eluted peptides to dryness.
- Immunoaffinity Enrichment (IAP): Resuspend the peptides in IAP buffer (e.g., 50 mM MOPS pH 7.2). Incubate the peptide mixture with anti-K-ε-GG antibody-conjugated beads for 1.5 hours at room temperature.
- Washing and Elution: Wash the beads multiple times with ice-cold IAP buffer and then with water. Gently elute the bound K-ε-GG peptides with 0.1-0.2% TFA.
- LC-MS/MS Analysis: Analyze the enriched peptides by liquid chromatography coupled to a tandem mass spectrometer (LC-MS/MS). The resulting spectra are searched against a protein database using software that includes K-ε-GG (114.04293 Da) as a variable modification on lysine.
Visual Guide to Ubiquitination Detection Workflows
Diagram 1: Antibody-Based Ubiquitin Profiling
Diagram 2: Antibody-Free Ubiquitin Profiling (AFUP)
Frequently Asked Questions (FAQs) & Troubleshooting
Q1: My Western Blot for ubiquitination shows a high background smear, making it difficult to interpret the specific signal for my protein of interest. What can I do?
A: A high background smear is a common issue. Here is a systematic troubleshooting approach [41] [42]:
- Confirm the Experiment: First, repeat the experiment to rule out a simple human error.
- Check Antibody Specificity: Ensure your primary antibody is specific for ubiquitin and not cross-reacting with other proteins. Optimize the antibody concentration; too much antibody can increase background.
- Increase Wash Stringency: Add more washes and include detergents like Tween-20 in your wash buffers. Increasing the salt concentration (e.g., 300-500 mM NaCl) in washes can also reduce non-specific binding.
- Validate Your Lysis Buffer: Ensure your lysis buffer contains adequate protease and DUB inhibitors to prevent degradation of the ubiquitin signal during sample preparation [40].
Q2: When performing immunoprecipitation for a specific protein, how can I be sure the higher molecular weight bands I see are due to ubiquitination and not other PTMs or interacting partners?
A: To confirm the modification is ubiquitination, include these critical controls [41]:
- DUB Treatment Control: After IP, split your sample and treat one part with a deubiquitinating enzyme (DUB) like USP2. If the higher molecular weight bands disappear, this confirms they are due to ubiquitin [10].
- Mutation Control: If you suspect a specific lysine is targeted, mutate it to arginine and repeat the experiment. A loss of the ubiquitination signal supports your hypothesis [6].
- Competition Control: Pre-incubate the ubiquitin antibody with free ubiquitin protein before blotting. This should compete away the signal.
Q3: Mass spectrometry analysis failed to identify many ubiquitination sites, even in a sample expected to be highly ubiquitinated. What are the potential reasons?
A: Low ubiquitination site identification in MS can stem from several points in the workflow [10]:
- Insufficient Enrichment: The stoichiometry of ubiquitination is low. If the enrichment step (using TUBEs or anti-K-ε-GG antibodies) is not efficient, the target peptides will be lost in the background of unmodified peptides.
- Sample Preparation Issues: Inadequate inhibition of DUBs during cell lysis can lead to loss of the ubiquitin signal before analysis [40].
- MS Instrument Sensitivity and Settings: The MS instrument may not be sensitive enough to detect low-abundance peptides. Ensure the MS method is optimized for detecting the K-ε-GG signature (a 114.04293 Da mass shift on lysine) [6].
- Peptide Ionization Suppression: Complex samples can suppress the ionization of less abundant K-ε-GG peptides. Incorporating a basic reverse-phase fractionation step before MS can significantly increase coverage by reducing complexity [10].
Q4: What is the key difference between antibodies that produce a "smeared" ladder pattern versus discrete "banded" patterns in a Western Blot?
A: This difference is due to the antibody's epitope recognition [40]:
- "Smeared" Pattern Antibodies: These recognize "open" epitopes on ubiquitin that are accessible whether ubiquitin is free, in a monomeric state, or within a polyubiquitin chain. They are ideal for visualizing the entire spectrum of polyubiquitinated proteins and assessing global ubiquitination levels.
- "Banded" Pattern Antibodies: These recognize "cryptic" epitopes that are only exposed on free ubiquitin or monoubiquitinated proteins. When ubiquitin is incorporated into a chain, the epitope is buried. These are better for studying free ubiquitin pool dynamics. Your research goal should dictate which type of antibody you select.
Optimizing Detection Sensitivity: Practical Strategies for Overcoming Technical Limitations
Within the framework of thesis research focused on overcoming the challenges of detecting low-stoichiometry ubiquitination, the targeted inhibition of the proteasome is a foundational technique. The ubiquitin-proteasome system (UPS) is the primary pathway for cytosolic protein degradation in eukaryotic cells [43]. When the proteasome is inhibited, ubiquitinated proteins that would normally be degraded begin to accumulate, thereby enhancing their recovery and subsequent detection [43]. This technical support center provides detailed protocols and troubleshooting advice to optimize this critical process for researchers and drug development professionals.
Frequently Asked Questions (FAQs)
Q1: Why is proteasome inhibition necessary for enhancing ubiquitinated protein recovery?
Proteasome inhibition creates a "traffic jam" in the UPS. Under normal conditions, poly-ubiquitinated proteins are rapidly degraded by the 26S proteasome in an ATP-dependent process [44]. By inhibiting the proteasome's catalytic activity, you prevent the destruction of these tagged proteins, causing them to accumulate within the cell [43]. This accumulation significantly increases the pool of ubiquitinated proteins available for isolation and study, which is especially critical for detecting transient or low-abundance ubiquitination events central to research on signaling, protein homeostasis, and targeted degradation [45].
Q2: What are the primary mechanisms of resistance to proteasome inhibitors, and how can they affect my experiment?
Malignant cells, often used in research models, can develop resistance to proteasome inhibitors like bortezomib through several mechanisms [43]. These include mutations in the proteasome's catalytic subunits, increased expression of efflux pumps that remove the drug from the cell, and activation of alternative protein clearance pathways like autophagy [43]. In an experimental context, this resistance can manifest as a reduced accumulation of ubiquitinated proteins after inhibitor treatment. To overcome this, researchers may need to use higher concentrations of the inhibitor (after determining a new IC50), employ a combination of inhibitors targeting different catalytic activities, or co-treat with an autophagy inhibitor [43].
Q3: My recovered ubiquitinated protein yields are still low after inhibition. What could be the issue?
Low yield despite inhibition can be attributed to several factors. First, the inhibitor may not be fully effective; verify its activity and concentration using a fluorescent proteasome activity assay. Second, consider that other degradation pathways, such as lysosomal autophagy, may be compensating [44] [43]. Third, the ubiquitination itself might be labile due to the activity of deubiquitinases (DUBs) in your cell lysates. Include broad-spectrum DUB inhibitors in your lysis buffer to preserve the ubiquitin signal. Finally, remember that some proteins are degraded in a ubiquitin-independent manner and will not accumulate with proteasome inhibition alone [43].
Troubleshooting Guides
Problem: Inefficient Accumulation of Ubiquitinated Proteins
Potential Causes and Solutions:
Cause 1: Inadequate inhibitor concentration or duration.
- Solution: Perform a dose-response and time-course experiment. Use a positive control, such as an antibody against poly-ubiquitin chains, to visually confirm accumulation via western blot. Treat cells with a range of inhibitor concentrations (e.g., 10 nM - 1 µM for bortezomib) for 2-16 hours to determine the optimal window.
Cause 2: Upregulation of compensatory protein degradation pathways.
- Solution: Co-treatment with inhibitors of alternative pathways can be effective. For example, to inhibit autophagy, use 5-20 nM Bafilomycin A1 or 10 µM Chloroquine for the final 4-6 hours of proteasome inhibition [43].
Cause 3: Instability of the ubiquitin chain on the target protein.
- Solution: Supplement your standard lysis buffer with 1-10 mM of a deubiquitinase (DUB) inhibitor, such as N-Ethylmaleimide (NEM) or PR-619, to prevent the removal of ubiquitin chains post-lysis.
Problem: High Background Noise in Downstream Mass Spectrometry Analysis
Potential Causes and Solutions:
Cause 1: Co-purification of abundant non-ubiquitinated proteins.
- Solution: Increase the stringency of your wash buffers. After binding the ubiquitinated proteins to your enrichment matrix (e.g., TUBE resin), wash with buffers containing higher salt concentrations (e.g., 750 mM NaCl) and mild detergents (e.g., 0.5% Nonidet P-40) to disrupt non-specific interactions [46].
Cause 2: Persistence of non-volatile salts and buffers interfering with ionization.
- Solution: Perform a buffer exchange into a volatile ammonium acetate buffer (e.g., 30-120 mM) using size-exclusion chromatography or dialysis before MS analysis [47]. This step is crucial for native MS and improves signal-to-noise ratios.
Problem: Proteasome Inhibitor Cytotoxicity Overshadows Experimental Readouts
Potential Causes and Solutions:
- Cause: The required concentration or time of inhibition induces excessive cell death, confounding results.
- Solution: Titrate the inhibitor to find the minimum concentration that achieves maximal ubiquitinated protein accumulation while maintaining acceptable cell viability (>80%). Reduce the treatment duration and consider using a reversible inhibitor like bortezomib instead of an irreversible one like carfilzomib for shorter pulses [43].
Experimental Protocols & Data Presentation
Standard Protocol for Proteasome Inhibition and Ubiquitinated Protein Recovery
The following workflow outlines the key steps from cell culture to ubiquitinated protein enrichment.
Quantitative Comparison of Common Proteasome Inhibitors
The choice of inhibitor can significantly impact the efficiency and outcome of your experiment. The table below summarizes key characteristics of FDA-approved proteasome inhibitors.
Table 1: Properties of Clinically Used Proteasome Inhibitors [43]
| Inhibitor | Mechanism of Action | Primary Target | Common Working Concentration (Cell Culture) | Solubility | Key Consideration |
|---|---|---|---|---|---|
| Bortezomib (BTZ) | Reversible | Chymotrypsin-like (β5) | 10 - 100 nM | DMSO | The first-in-class PI; suitable for shorter treatments. |
| Carfilzomib (CFZ) | Irreversible | Chymotrypsin-like (β5) | 5 - 50 nM | DMSO | Higher specificity; used for resistant cell lines. |
| Ixazomib (IXZ) | Reversible | Chymotrypsin-like (β5) | 10 - 500 nM | DMSO | Oral bioavailability; can be used for prolonged incubation. |
Advanced Methodology: In Vitro Processing for Epitope Mapping
For research focused on the specific peptides generated by proteasomal cleavage (e.g., in immunology), an in vitro processing protocol can be used. This method bypasses cellular compensatory mechanisms and allows for direct analysis of proteasome-generated peptides.
Table 2: Steps for In Vitro Processing of Antigens by Proteasomes [46]
| Step | Procedure | Critical Parameters | Purpose |
|---|---|---|---|
| 1. Proteasome Purification | Obtain cell lines stably expressing tagged proteasome subunits (e.g., PSMB4-HTBH). Purify using affinity chromatography. | Use fresh protease inhibitors in all buffers. Avoid repeated freeze-thaw cycles. | To obtain a highly active and specific proteasome preparation. |
| 2. Antigen Fragmentation | Incubate purified antigen with active proteasomes in reaction buffer (30 mM Tris-HCl pH 7.5, 5 mM MgCl2, 1 mM TCEP). | Optimize antigen-to-proteasome ratio and incubation time (1-18 hours). | To generate a pool of peptides reflecting true proteasomal cleavage. |
| 3. Peptide Pool Prep | Desalt the peptide mixture and concentrate using reverse-phase cartridges. | Use 0.1% formic acid and acetonitrile gradients for elution. | To remove salts and prepare peptides for mass spectrometry. |
| 4. HLA Binding Assay | Incubate peptide pool with purified HLA class I alleles. | Select HLA alleles based on the population or model system being studied. | To identify which proteasome-generated peptides are physiologically relevant for immune presentation. |
The Scientist's Toolkit: Essential Research Reagents
The following table lists key reagents and their functions for successfully executing proteasome inhibition and ubiquitinated protein recovery experiments.
Table 3: Key Research Reagent Solutions for Ubiquitinated Protein Recovery
| Reagent / Material | Function / Application | Example |
|---|---|---|
| Proteasome Inhibitors | Induce accumulation of poly-ubiquitinated proteins by blocking degradation. | Bortezomib, Carfilzomib, MG132 |
| DUB Inhibitors | Preserve ubiquitin chains on proteins during cell lysis and purification. | N-Ethylmaleimide (NEM), PR-619 |
| Lysis Buffer (Mild) | Maintains protein-protein interactions; used for co-immunoprecipitation. | 30 mM Tris, 5 mM MgCl2, 0.5% Nonidet P-40, 1 mM TCEP [46] |
| High-Salt Wash Buffer | Reduces non-specific binding in enrichment steps; critical for clean MS data. | 30 mM Tris, 5 mM MgCl2, 750 mM NaCl, 1 mM TCEP [46] |
| TUBE (Tandem Ubiquitin Binding Entity) | High-affinity reagent for enriching poly-ubiquitinated proteins from complex lysates. | Agarose- or magnetic bead-conjugated TUBE |
| Volatile MS Buffer | Enables native mass spectrometry by minimizing ion adduction and signal suppression. | 120 mM Ammonium Acetate [47] |
The detection of protein ubiquitination is fundamental to understanding cellular regulation, yet researchers are consistently challenged by its characteristically low stoichiometry. This technical support center is designed within the context of a broader thesis aimed at overcoming these detection hurdles. The following guides and FAQs provide detailed, actionable protocols and troubleshooting advice to help you optimize the specificity and yield of your ubiquitination enrichment experiments.
FAQs: Ubiquitination Enrichment
1. What are the primary methods for enriching ubiquitinated proteins from complex cell lysates?
The three most common methodologies are Ubiquitin-Binding Domain (UBD)-based enrichment, antibody-based immunoprecipitation, and affinity purification via tagged ubiquitin. UBD-based approaches use engineered proteins with high affinity for ubiquitin chains to pull down ubiquitinated conjugates. Antibody-based methods utilize antibodies specific to ubiquitin or the di-glycine (diGly) remnant left on trypsinized peptides. Tagged ubiquitin approaches (e.g., His-, Strep-, or HA-tagged Ub) involve expressing tagged ubiquitin in cells and using corresponding affinity resins for purification [6].
2. How can I improve the sensitivity of my ubiquitinome analysis when using mass spectrometry?
To maximize sensitivity in MS-based ubiquitinome analysis, consider these steps:
- Use Spectral Libraries: Employ Data-Independent Acquisition (DIA) MS with comprehensive, pre-established spectral libraries containing over 90,000 diGly peptides. This can double the number of ubiquitination sites identified in a single measurement compared to Data-Dependent Acquisition (DDA) [48].
- Optimize Sample Input and Enrichment: For diGly remnant enrichment, using 1 mg of peptide material and 31.25 µg of anti-diGly antibody provides an optimal balance of yield and depth of coverage. Furthermore, injecting only 25% of the total enriched material can be sufficient when using a highly sensitive DIA workflow [48].
- Pre-fractionate to Manage Abundant Peptides: Separate peptides by basic reversed-phase chromatography into multiple fractions before diGly enrichment. This helps reduce competition for antibody binding sites from highly abundant peptides, such as the K48-linked ubiquitin chain-derived diGly peptide, which is particularly prevalent after proteasome inhibition (e.g., MG132 treatment) [48].
3. My enrichment yields are low and inconsistent. What could be the cause?
Low and inconsistent yield is often a symptom of poor affinity or biased recognition of ubiquitin chains. Traditional Tandem Ubiquitin Binding Entities (TUBEs) can have limited affinity for ubiquitin chains and exhibit bias towards specific linkage types, leading to incomplete capture [12]. Switching to a higher-affinity capture reagent, such as the engineered Tandem Hybrid UBD (ThUBD), which shows unbiased recognition and high affinity for all polyubiquitin chain types, can significantly improve yield and reliability [12]. Furthermore, ensure that your lysis buffer contains sufficient ionic strength (e.g., 150-300 mM NaCl) and protease inhibitors to maintain complex integrity and prevent deubiquitinase (DUB) activity during preparation [6].
4. Are there high-throughput options for monitoring protein ubiquitination status?
Yes, high-throughput options are available. While traditional Western blotting is low-throughput, newer platforms include 96-well plates coated with ubiquitin-binding domains. For example, plates coated with the ThUBD domain enable specific, high-throughput capture and quantification of proteins modified by any ubiquitin chain type, facilitating drug screening or time-course experiments [12]. These assays are compatible with standard plate readers for colorimetric or chemiluminescent detection.
Troubleshooting Guides
Guide 1: Low Specificity in DiGly Peptide Enrichment
Problem: High background of non-modified peptides in the final MS sample, reducing the depth of ubiquitinome coverage.
Solution: Optimize the wash stringency and use competitive elution.
| Step | Parameter | Recommendation | Rationale |
|---|---|---|---|
| 1. Binding | Antibody Bead Ratio | 1:50 (v/v) antibody slurry to peptide lysate | Ensures sufficient binding capacity. |
| 2. Washing | Wash Buffer | Use buffers with added chaotropic agents (e.g., 25 mM HEPES, 500 mM NaCl, 0.5% SDC, 1 M Urea, pH 8.0). | Reduces non-specific hydrophobic and ionic interactions. |
| 3. Elution | Elution Method | Two-step elution: first with 0.1% TFA, then with 0.1% TFA + 25% ACN. | Gently disrupts antibody-antigen binding and efficiently recovers peptides. |
Guide 2: Inefficient Capture of Polyubiquitinated Proteins
Problem: Failure to detect proteins modified with longer ubiquitin chains, especially atypical (non-K48/K63) linkages.
Solution: Implement an unbiased, high-affinity UBD-based capture strategy.
| Step | Action | Details |
|---|---|---|
| 1. Reagent Selection | Use ThUBD-coated beads or plates. | ThUBD is engineered for high affinity and lacks bias for any specific ubiquitin chain linkage [12]. |
| 2. Binding Capacity | Titrate the amount of capture reagent. | For ThUBD-coated 96-well plates, coating with 1.03 µg of ThUBD enables specific binding to ~5 pmol of polyubiquitin chains [12]. |
| 3. Validation | Spike-in a positive control. | Use a recombinant ubiquitinated protein (e.g., Ub~GFP) to confirm efficient pull-down before processing valuable samples. |
Experimental Workflow & Signaling
The following diagram illustrates a robust, high-sensitivity workflow for the mass spectrometry analysis of the ubiquitinome, integrating diGly remnant enrichment with state-of-the-art DIA mass spectrometry.
Research Reagent Solutions
The following table details essential reagents for advanced ubiquitination research, as featured in the cited literature.
| Reagent / Material | Function in Experiment | Key Characteristics |
|---|---|---|
| ThUBD (Tandem Hybrid UBD) [12] | High-affinity, unbiased capture of polyubiquitinated proteins. | Engineered domain with no linkage bias; can be coated on beads or 96-well plates. |
| Anti-diGly Remnant Antibody [48] | Immunoaffinity enrichment of trypsinized ubiquitinated peptides for MS. | Specifically recognizes the K-ε-GG signature left on modified lysines. |
| TUBE (Tandem Ubiquitin Binding Entity) [6] | General enrichment of ubiquitinated proteins; protects chains from DUBs. | Comprises multiple UBDs for increased affinity; some versions have linkage bias. |
| Tagged Ubiquitin (e.g., His-, Strep-) [6] | Affinity purification of ubiquitinated substrates from engineered cells. | Allows pull-down under denaturing conditions; may not mimic endogenous Ub perfectly. |
| PROTAC Assay Plates [12] | High-throughput screening of ubiquitination levels or E3 ligase activity. | Commercial 96-well plates pre-coated with ubiquitin-binding entities. |
| LysC Protease [48] | Protein digestion for diGly proteomics. | Generates longer peptides with the diGly remnant, improving specificity. |
The detection and analysis of protein ubiquitination present a unique set of challenges for researchers studying cellular signaling, protein degradation, and therapeutic development. The core issue lies in the exceptionally low stoichiometry of this modification; ubiquitination site occupancy is typically three orders of magnitude lower than phosphorylation, spanning over four orders of magnitude across the proteome [1]. This low abundance, combined with the transitory nature of ubiquitination and the complexity of ubiquitin chain architectures, means that sample preparation is not merely a preliminary step but a decisive factor in experimental success. Even minor losses or inefficiencies during cell lysis, protein extraction, or digestion can render ubiquitination events undetectable, leading to false negative results and incomplete data.
This technical support guide addresses these challenges by providing targeted, practical solutions for researchers navigating the critical journey from cell culture to mass spectrometry-ready peptides. The following sections outline a robust workflow, highlight essential reagents, and provide troubleshooting guidance to maximize the recovery and detection of ubiquitinated proteins, even when working with demanding samples or limited biological material.
Experimental Workflow for Ubiquitination Analysis
The pathway to successful ubiquitination analysis requires a meticulously planned and executed workflow. The diagram below outlines the critical stages from cell collection to mass spectrometry, highlighting key decision points and recommended practices for preserving labile ubiquitin modifications.
Critical Phase 1: Cell Lysis and Protein Stabilization
The initial minutes of sample preparation are crucial for preserving the native ubiquitination state. The primary goals are rapid cessation of enzymatic activity and complete solubilization of target proteins.
Lysis Buffer Composition: Utilize strong denaturants like 6 M guanidine hydrochloride [49] or high concentrations of urea (e.g., 8 M) to instantly inactivate endogenous proteases and deubiquitinases (DUBs). These denaturants effectively solubilize proteins and disrupt protein-protein interactions that can mask epitopes or ubiquitination sites.
Essential Additives:
- Protease Inhibitor Cocktails: Use fresh, broad-spectrum cocktails containing inhibitors like PMSF, EDTA, pepstatin, and leupeptin [49]. Add these to the lysis buffer immediately before use, as storing inhibitors in buffer, even at 4°C, causes rapid degradation [50].
- Deubiquitinase (DUB) Inhibitors: Include N-Ethylmaleimide (NEM), typically at 5-20 mM, to irreversibly inhibit cysteine-based DUBs that would otherwise strip ubiquitin chains from proteins during lysis [49].
- Proteasome Inhibitors: For studies focused on K48-linked degradation pathways, add inhibitors like MG-132 to prevent the proteasomal degradation of ubiquitinated proteins before they can be analyzed [20].
Lysis Technique: For cultured cells, vigorous vortexing with detergent-based buffers is often sufficient. For tougher samples like yeast or tissues, mechanical disruption with glass beads or a sonication probe may be necessary [51] [49]. Always perform lysis and subsequent steps at 4°C to minimize enzyme activity and protein degradation.
Critical Phase 2: Enrichment of Ubiquitinated Proteins
Due to low stoichiometry, enriching ubiquitinated species from the complex cellular background is essential. The table below compares the most common enrichment strategies.
Table 1: Comparison of Ubiquitinated Protein Enrichment Methods
| Method | Principle | Advantages | Disadvantages | Primary Application |
|---|---|---|---|---|
| Affinity Tags (e.g., His₆-Ub) [20] [52] | Ectopic expression of epitope-tagged ubiquitin (e.g., His, Strep, HA). | High specificity and yield; adaptable to various cell lines. | Does not detect endogenous ubiquitination; potential for artifacts. | Targeted studies in manipulable cell systems. |
| TUBEs (Tandem Ubiquitin Binding Entities) [2] [52] | Use of engineered high-affinity ubiquitin-binding domains. | Captures endogenous ubiquitination; protects chains from DUBs. | Higher cost; requires optimization of binding conditions. | Studying endogenous proteins and linkage-specific dynamics. |
| Ubiquitin Antibodies [52] | Immunoaffinity purification using pan- or linkage-specific anti-ubiquitin antibodies. | Direct analysis of endogenous ubiquitination; linkage-specific options. | High cost; potential for non-specific binding. | Western blot confirmation and linkage-specific analysis of endogenous proteins. |
After enrichment, proteins are typically denatured, reduced (e.g., with DTT), and alkylated (e.g., with iodoacetamide) to prepare them for digestion. Alkylation prevents the reformation of disulfide bonds and is critical for efficient proteolysis.
Critical Phase 3: Proteolytic Digestion and Peptide Cleanup
This phase converts enriched proteins into peptides amenable to LC-MS/MS analysis.
Digestion Strategy: A common and robust approach is in-solution digestion. Following denaturation and alkylation, proteins are digested using a specific protease, most commonly trypsin [53]. Trypsin cleaves after arginine and lysine residues, and a unique feature of ubiquitination is that after trypsin digestion, a di-glycine (Gly-Gly) remnant with a mass shift of 114.0429 Da remains attached to the modified lysine, serving as a diagnostic marker for MS-based identification [52] [49]. For more complete digestion, a combination of Lys-C and trypsin is often used, as Lys-C is more tolerant of denaturants like urea [54].
Post-Digestion Cleanup: After digestion, peptides must be desalted to remove salts, detergents, and other contaminants that suppress ionization during MS analysis [53] [54]. This is typically achieved using C18 solid-phase extraction tips or columns. Clean, concentrated peptides significantly improve chromatographic separation and MS signal quality.
The Scientist's Toolkit: Essential Research Reagents
Table 2: Key Reagents for Ubiquitination Sample Preparation
| Reagent / Kit | Function | Key Considerations |
|---|---|---|
| Protease Inhibitor Cocktail [50] [49] | Broad-spectrum inhibition of serine, cysteine, metallo-, and aspartic proteases. | Must be added fresh; avoid storage in lysis buffer. |
| N-Ethylmaleimide (NEM) [49] | Irreversible inhibitor of cysteine-dependent Deubiquitinases (DUBs). | Critical for preserving ubiquitin chains during lysis. |
| MG-132 / Proteasome Inhibitors [20] | Inhibits the 26S proteasome, preventing degradation of polyubiquitinated proteins. | Essential for studying K48-linked ubiquitination. |
| Ni-NTA Agarose / Beads [20] [49] | Affinity resin for purifying His-tagged ubiquitin-protein conjugates. | High binding capacity; requires denaturing conditions to reduce non-specific binding. |
| Chain-Selective TUBEs [2] [52] | High-affinity reagents for enriching specific ubiquitin chain linkages (e.g., K48, K63). | Enables study of linkage-specific biology; available as magnetic beads for HTS. |
| Anti-Ubiquitin Antibodies (Pan & Linkage-Specific) [52] | Immunoprecipitation of endogenous ubiquitinated proteins. | P4D1, FK1/FK2 are common pan-specific antibodies. |
| Filter-Aided Sample Preparation (FASP) Kits [54] | Combines detergent removal, buffer exchange, and digestion in a centrifugal filter device. | Excellent for removing SDS and other MS-incompatible detergents. |
Troubleshooting FAQs
Q1: My western blot shows weak or no ubiquitination signal, even with overexpressed tagged ubiquitin. What could be wrong?
- Insufficient DUB Inhibition: This is the most common issue. Ensure your lysis buffer contains fresh NEM (5-20 mM) and that you are working quickly on ice. The lysis buffer itself should be a strong denaturant (e.g., containing 6 M guanidine-HCl or 1-2% SDS) to instantaneously inactivate enzymes [49].
- Protein Overexpression Issues: If using transfected plasmids, ensure the DNA is of high quality and endotoxin-free. Optimize transfection efficiency and expression time [20] [51].
- Inefficient Immunoprecipitation: Titrate the amount of antibody or affinity beads used. Include proper wash steps with stringent buffers (e.g., containing 300-500 mM NaCl) to reduce background, but avoid over-washing [49].
Q2: My mass spectrometry results are dominated by high-abundance proteins, masking potential ubiquitination sites. How can I improve depth?
- Implement Robust Enrichment: Do not analyze whole cell lysates. Use one of the enrichment strategies from Table 1 (TUBEs, immunoaffinity, or affinity tags) to specifically isolate the ubiquitinated sub-proteome [2] [52].
- Fractionate or Deplete: Use strong cation exchange (SCX) chromatography to fractionate peptides before LC-MS/MS, reducing sample complexity in each run. For specific samples like serum, consider depleting highly abundant proteins like albumin [53] [49].
- Optimize Digestion and Cleanup: Ensure complete digestion to avoid missed cleavages that complicate spectra. Perform thorough desalting to remove ion-suppressing salts and detergents. Avoid polymeric contaminants like PEG [54].
Q3: My cell lysis is inefficient, leading to low protein yield. What should I check?
- Detergent Concentration and Type: Verify that non-ionic detergents (e.g., NP-40) are used at ~1% concentration. For difficult-to-lyse cells (e.g., bacteria, plants) or insoluble proteins, you may need to incorporate ionic detergents or use specialized extraction reagents [51] [50].
- Cell Type Considerations: Adjust your protocol for the cell type. Some adherent cells may require scraping instead of trypsinization to preserve surface proteins. Bacterial cells may require lysozyme treatment or physical disruption [51].
- Inhibition of Aggregation: Viscosity from released DNA can impede lysis and clarification. Add Benzonase or DNase I to your lysis buffer to digest nucleic acids [51].
Q4: How can I specifically study K48- vs. K63-linked ubiquitination in a physiological context?
- Use Linkage-Specific Tools: The most direct method is to use chain-selective TUBEs or linkage-specific antibodies [2] [52]. For example, you can stimulate cells (e.g., with L18-MDP for K63-linked RIPK2 ubiquitination) or treat with a PROTAC (to induce K48-linked degradation), then use K63- or K48-TUBEs in a pull-down assay to capture and quantify the specific chain types on your target protein [2]. This method works on endogenous proteins without requiring genetic tags.
Troubleshooting Guide: Frequently Asked Questions
Data and Preprocessing
Q1: My model performs well during training but generalizes poorly to new ubiquitination datasets. What parameters should I optimize first?
Poor generalization often stems from data quality issues or incorrect data splitting. Focus on these optimization steps:
- Verify Data Splitting Method: Ensure data is split by protein or experiment, not randomly by sites, to prevent data leakage from highly similar sequences appearing in both training and test sets [55].
- Check for Redundant Sequences: Use clustering tools (e.g., CD-HIT) to remove sequences with high similarity before splitting, ensuring your model learns generalizable features.
- Optimize Input Representations: Test different combinations of sequence encodings. Research shows that combining multiple representations—such as embeddings, one-hot encodings, and physicochemical properties—can significantly enhance predictive power and cross-species generalizability [56] [55].
Q2: How can I handle the issue of low stoichiometry in my ubiquitination training data?
Low stoichiometry leads to weak signal strength, which can be mitigated through data-centric parameter adjustments:
- Apply Sample Weights: Assign higher weights to PTM sites with stronger experimental evidence during training. For example, weight samples by their localization probability or the number of supporting PSMs to make the model focus on high-confidence examples [55].
- Implement Data Augmentation: Carefully augment your positive dataset by adding slightly modified versions of high-confidence ubiquitination sequences. Avoid augmentation for negative samples to prevent introducing false positives.
- Optimize Loss Functions: Use focal loss or other advanced loss functions to down-weight the contribution of easily classified negative examples, helping the model focus on harder, more ambiguous cases that may represent low-stoichiometry events.
Model Architecture and Training
Q3: Which model architecture hyperparameters are most critical for optimizing ubiquitination site prediction?
The optimal architecture depends on your data, but key parameters to tune include:
- Kernel Sizes in Convolutional Layers: Systematically optimize convolutional kernel sizes to capture motifs of varying lengths. Start with a range of 3 to 15 amino acids to identify the most relevant local sequence contexts [55].
- Sequence Window Length: The input sequence window around the potential modification site is a crucial parameter. Perform ablation studies with window sizes from 15 to 51 amino acids to find the optimal context for your specific data.
- Ensemble Methods: Do not rely on a single model. Implement ensemble learning by training multiple models with different architectures or initializations and averaging their predictions. Ensembling is proven to enhance model robustness and performance [55].
Q4: My model training is unstable, with fluctuating loss values. How can I stabilize it?
Training instability can be addressed by optimizing these parameters and strategies:
- Gradient Clipping: Implement gradient clipping to prevent exploding gradients, especially in models containing recurrent layers.
- Adjust Batch Size and Learning Rate: Experiment with smaller batch sizes and reduce your learning rate. Use a learning rate scheduler to decrease the rate as training progresses.
- Incorporate Bidirectional Recurrent Layers: After convolutional feature extraction, adding bidirectional GRU or LSTM layers can help the model capture long-range dependencies in protein sequences, which is often critical for accurate PTM site prediction [55].
Evaluation and Interpretation
Q5: What are the key evaluation metrics I should use beyond accuracy?
For ubiquitination site prediction, which is often a class-imbalanced problem, rely on metrics that are robust to imbalance:
- Area Under the Curve (AUC): The Area Under the Receiver Operating Characteristic (ROC) Curve provides a comprehensive view of model performance across all classification thresholds. State-of-the-art models like MMUbiPred and DeepMVP report AUCs of 0.87 and above on independent tests [56] [55].
- Precision-Recall (PR) Curves: The Area Under the PR Curve is especially informative for imbalanced datasets where the positive class (ubiquitination sites) is rare.
- Delta Score for Variant Impact: When predicting the effect of missense variants, calculate a delta score (the difference in predicted PTM probability between wild-type and mutant sequences). This quantitative score directly indicates the potential for a variant to alter ubiquitination [55].
Q6: How can I interpret my model's predictions to gain biological insights?
Use interpretation techniques to move beyond the "black box":
- Saliency Maps and Feature Visualization: Generate saliency maps to identify which amino acids in the input sequence most strongly influenced the model's prediction. This can reveal potential binding motifs or regulatory contexts.
- In Silico Saturation Mutagenesis: Systematically mutate each position in a sequence window and observe the change in predicted ubiquitination probability. This can map the importance of each residue.
- Compare to Known Biology: Cross-reference your model's high-confidence predictions and important features with existing knowledge in databases like PTMAtlas or UniProt to validate and generate new hypotheses [55].
Experimental Protocols
Protocol 1: Systematic Model Training and Validation Workflow
Purpose: To provide a standardized, reproducible methodology for training and evaluating deep learning models for ubiquitination site prediction, optimized for scenarios with low-stoichiometry sites.
Materials:
- High-confidence PTM sites from a curated database (e.g., PTMAtlas) [55].
- Computing resources with GPU acceleration.
- Python environment with deep learning libraries (e.g., TensorFlow, PyTorch).
Methodology:
- Data Curation:
- Source PTM sites from systematically reanalyzed MS/MS datasets where a 1% false discovery rate (FDR) has been enforced at both the peptide-spectrum match and PTM site levels [55].
- Map all sites to a unified protein sequence database to ensure consistent positioning.
- Extract fixed-length sequence windows centered on the modified residue (e.g., Lysine for ubiquitination).
- Perform strict split-by-protein partitioning to create training, validation, and test sets.
Feature Engineering:
- Encode protein sequences using multiple complementary schemes in parallel:
- One-hot encoding for sequence identity.
- Embeddings from protein language models (e.g., ESM, ProtBERT).
- Physicochemical property encodings (e.g., hydrophobicity, charge, volume).
- Encode protein sequences using multiple complementary schemes in parallel:
Model Architecture Optimization:
- Employ a genetic algorithm or Bayesian optimization to search the hyperparameter space.
- Core architecture should combine Convolutional Neural Networks (CNNs) for local motif detection and Bidirectional Gated Recurrent Units (GRUs) for long-range context [55].
- Train multiple models with different random seeds to create a robust ensemble.
Evaluation:
- Assess the final ensemble model on the held-out test set.
- Report AUC, AUPRC, and calculate delta scores for variant analysis.
Protocol 2: Computational Assessment of Variant Impact on Ubiquitination
Purpose: To use a trained prediction model to determine whether a missense variant increases or decreases the likelihood of ubiquitination at or near the mutation site.
Materials:
- A trained and validated Deep Learning model for ubiquitination site prediction (e.g., DeepMVP) [55].
- Wild-type and mutant protein sequences.
Methodology:
- Input Preparation:
- For a given variant, generate two FASTA sequences: the wild-type and the mutant.
- If the variant creates or destroys a modifiable residue (e.g., a lysine), the PTM site for analysis will be the variant position itself.
- If the variant is adjacent to a modifiable residue, analyze the sequence window centered on that existing site.
Prediction:
- Run both the wild-type and mutant sequences through the trained model to obtain the predicted ubiquitination probability at the site of interest.
Delta Score Calculation:
- Calculate the delta score (Δ) as: Δ = Pmutant - Pwild-type
- Interpret the score:
- Δ < 0: Variant is predicted to decrease ubiquitination (loss-of-function).
- Δ > 0: Variant is predicted to increase ubiquitination (gain-of-function).
- Δ ≈ 0: Variant is predicted to have minimal effect.
Validation:
- Where possible, validate predictions against experimental data from literature-curated variants or cancer proteogenomic datasets [55].
Performance Metrics of Deep Learning Models
The table below summarizes the quantitative performance of contemporary deep learning models for PTM site prediction, providing benchmarks for your own work.
Table 1: Model Performance on Independent Test Sets
| Model Name | PTM Type | Key Methodology | Performance (AUC) | Reference / Tool |
|---|---|---|---|---|
| DeepMVP | Ubiquitination, Phosphorylation, Acetylation, etc. | Ensemble CNN+GRU on curated PTMAtlas | ~0.87 (Ubiquitination, independent test) | [55] |
| MMUbiPred | Ubiquitination | Unified model using multiple sequence encodings | 0.87 (AUC) | [56] |
Research Reagent Solutions
This table details key computational tools and data resources essential for building accurate ubiquitination prediction models.
Table 2: Essential Computational Tools and Data Resources
| Item Name | Function / Purpose | Brief Description |
|---|---|---|
| PTMAtlas | High-Quality Training Data | A curated compendium of 397,524 PTM sites from systematic reanalysis of 241 public MS datasets, ensuring low global FDR for robust model training [55]. |
| DeepMVP Framework | Prediction & Variant Analysis | A deep learning framework trained on PTMAtlas to predict sites for 6 major PTM types and calculate delta scores for missense variants [55]. |
| MaxQuant | Mass Spectrometry Data Reanalysis | Standard software used for the systematic reprocessing of raw MS/MS data to generate high-confidence PTM site identifications for databases like PTMAtlas [55]. |
| Ensemble CNN-BiGRU Architecture | Core Model Design | A neural network architecture that combines CNNs to detect local motifs and bidirectional GRUs to understand long-range context in protein sequences, optimized via genetic algorithms [55]. |
Workflow and Model Diagrams
Ubiquitination Prediction Workflow
Deep Learning Model Architecture
FAQs: Understanding Cross-Validation in Biological Research
Q: What is the core purpose of cross-validation in biological data analysis? A: Cross-validation (CV) is a statistical technique used to assess how well a predictive model will generalize to unseen data. It provides an estimate of a model's performance in real-world scenarios by repeatedly partitioning the original dataset into training and testing subsets [57] [58]. In bioinformatics, such as when building models to predict gene regulatory networks or ubiquitination sites, this is crucial for ensuring that the discovered relationships (e.g., TF-gene interactions) are robust and not just tailored to the specific samples in the dataset [57].
Q: What is the critical difference between Record-wise and Subject-wise cross-validation, and why does it matter? A: The difference lies in how the data is split, which is critical for avoiding over-optimistic performance estimates.
- Record-wise CV: Splits individual observations randomly into training and test sets. This can be problematic if multiple observations come from the same biological subject (e.g., patient, cell culture), as highly similar data can end up in both the training and test sets. A model may then perform well simply by "recognizing" the subject rather than learning the underlying biology [59].
- Subject-wise CV: Ensures that all data from a single subject are placed entirely in either the training set or the test set. This better simulates the real-world use case where the model will be applied to entirely new subjects, providing a more realistic and rigorous assessment of generalizability [59].
Q: My dataset includes different experimental conditions or cell types. How should I approach cross-validation? A: Standard random CV may produce inflated performance if training and test sets contain samples from the same condition. A more robust strategy is Clustering-based CV (CCV). This involves first clustering the experimental conditions and then placing entire clusters of similar conditions into a single CV fold [57]. This tests the model's ability to predict outcomes in a genuinely new regulatory context, which is often the goal in biological research [57].
Q: When is cross-validation not sufficient, and what should I do instead? A: Cross-validation is an internal validation technique. It is not sufficient when the goal is to confirm the absolute accuracy of a method for regulatory purposes or when comparing two different analytical methods. In these cases, external validation is required [60].
- For bioanalytical method validation (e.g., a new LC-MS assay), a full validation establishing specificity, accuracy, precision, and linearity is mandatory [60].
- For method comparison (e.g., comparing two ubiquitination detection assays), a cross-validation study must be performed where a set of samples is analyzed by both methods, and the results are statistically compared (e.g., via regression analysis) to understand and quantify any bias [58].
Troubleshooting Guide: Common Cross-Validation Pitfalls in Biological Studies
Problem 1: Over-optimistic Model Performance
- Symptoms: The model achieves high accuracy during cross-validation but fails dramatically when applied to new data from a different study or laboratory.
- Diagnosis: This is a classic sign of information leakage or a poorly chosen validation strategy. The most common cause is using Record-wise CV on data with multiple samples per subject or highly correlated experimental conditions, allowing the model to "cheat" by seeing similar data in both training and testing [57] [59].
- Solution: Implement Subject-wise or Clustering-based CV. Ensure the splitting strategy matches the intended use case: if the model will be applied to new subjects or conditions, they must be excluded from the training data during validation [57] [59].
Problem 2: Unstable and Variable Model Performance
- Symptoms: Model performance metrics (e.g., accuracy, AUC) fluctuate widely with different random seeds for data splitting.
- Diagnosis: The dataset may be too small, or the random splits may be creating training and test sets with fundamentally different distributions. This violates the "identically distributed" assumption of many CV approaches [59].
- Solution:
- Use stratified splitting to preserve the distribution of important labels (e.g., disease state) across folds.
- Increase the number of CV folds (e.g., 10-fold instead of 5-fold) to reduce variance in the performance estimate [58].
- Consider a simulated annealing method (SACV) to systematically construct partitions with gradually increasing "distinctness," allowing for a more controlled evaluation of how performance decays as test sets become less similar to training data [57].
Problem 3: Poor Performance on Specific Data Subsets
- Symptoms: The model works well on data from one cell type or experimental batch but performs poorly on others.
- Diagnosis: The model has failed to learn generalizable biological principles and is instead fitting batch-specific or context-specific noise.
- Solution:
- Pre-process data to remove technical batch effects.
- Explicitly test for this issue by using a CV strategy where entire batches or cell types are left out as the test set (similar to CCV) [57].
- Incorporate domain adaptation techniques or include more diverse data in the training set to force the model to learn robust features.
Experimental Protocol: Implementing a Rigorous Cross-Validation Workflow
The following protocol outlines a robust workflow for evaluating a computational predictor, such as a machine learning model for ubiquitination site prediction [34].
Objective
To implement a cross-validation strategy that provides a reliable estimate of a predictive model's performance on unseen biological data, minimizing bias from sample correlations.
Materials
- Dataset with biological samples (e.g., protein sequences, gene expression profiles).
- Computing environment (e.g., Python with scikit-learn, R).
- Metadata detailing sample origins (e.g., subject ID, experimental condition, cell type).
Methodology
Step 1: Data Preparation and Metadata Integration
- Curate the dataset. For ubiquitination site prediction, this involves extracting protein sequence fragments centered on lysine residues, labeled as ubiquitinated (positive) or non-ubiquitinated (negative) [36] [34].
- Handle class imbalance. If negative examples vastly outnumber positives, consider under-sampling the majority class or using a balanced subset for training to prevent model bias [61].
- Integrate critical metadata. This includes information like the protein of origin, the experimental study of origin, or the species. This metadata is essential for creating meaningful splits in the following steps.
Step 2: Selection of an Appropriate Cross-Validation Strategy The choice of strategy depends on the data structure and research goal. The following table summarizes the options.
Table 1: Cross-Validation Strategies for Biological Data
| Strategy | Splitting Method | Best For | Advantages | Limitations |
|---|---|---|---|---|
| Record-wise (k-fold) | Random partition of individual samples. | Preliminary analysis on i.i.d. data where samples are truly independent. | Simple to implement; maximizes data use. | High risk of over-optimism with correlated samples (e.g., multiple reads from one subject) [59]. |
| Subject-wise | All data from a single subject/biological unit is kept in one fold. | Data with multiple measurements per subject (e.g., clinical trials, repeated experiments). | Mimics real-use case on new subjects; prevents identity confounding [59]. | Requires subject metadata; can be problematic if subjects have different data distributions [59]. |
| Clustering-based (CCV) | Partition based on clusters of similar conditions or samples. | Datasets with distinct experimental contexts, cell types, or species. | Tests generalizability across fundamentally new environments; highly rigorous [57]. | Dependent on clustering algorithm and parameters [57]. |
Step 3: Model Training and Evaluation
- For each fold, train the model (e.g., Random Forest, SVM, Deep Neural Network) on the training set [34] [61].
- Apply the trained model to the held-out test set and calculate performance metrics (e.g., Accuracy, Precision, Recall, F1-score, Area Under the ROC Curve (AUC)) [34].
- Aggregate the metrics from all folds to produce a final performance estimate (e.g., mean and standard deviation).
The logical workflow for selecting and implementing these strategies is summarized in the diagram below.
The Scientist's Toolkit: Research Reagent Solutions
The following table details key reagents and materials used in experimental studies of ubiquitination, as cited in the literature.
Table 2: Key Research Reagents for Ubiquitination Studies
| Reagent / Material | Function / Application | Example & Notes |
|---|---|---|
| Ubiquitin-Trap Beads | Immunoprecipitation of monomeric ubiquitin, ubiquitin chains, and ubiquitinated proteins from cell extracts. | ChromoTek Ubiquitin-Trap (Agarose or Magnetic Agarose). Used for pulldown assays followed by western blot or mass spectrometry [62]. |
| Proteasome Inhibitors | To preserve and increase the levels of ubiquitinated proteins in cell samples by blocking their degradation. | MG-132. A common treatment prior to cell harvesting to enrich for ubiquitinated substrates [62]. |
| Ubiquitination Site Predictors | Computational prediction of ubiquitination sites on protein sequences to guide experimental work. | UbPred: A random forest-based predictor for S. cerevisiae [36]. DeepTL-Ubi: A deep learning predictor for multiple species [34]. |
| Linkage-Specific Antibodies | Differentiating between types of polyubiquitin chains (e.g., K48 vs. K63) in western blot analysis. | Critical for determining the functional consequence of ubiquitination (e.g., degradation vs. signaling), as the Ubiquitin-Trap is not linkage-specific [62]. |
| Mutant Yeast Strains | Used to perturb the ubiquitination system and identify novel substrates or sites, particularly of short-lived proteins. | Example: CDC34 and grr1Δ mutant strains in S. cerevisiae used in conjunction with LC-MS/MS to identify 141 new ubiquitination sites [36]. |
Validation Frameworks and Comparative Analysis: Ensuring Data Reliability Across Platforms
Protein ubiquitination is a crucial post-translational modification that regulates virtually all cellular processes, from protein degradation and cell cycle control to DNA repair and immune responses [16] [52]. Despite its biological significance, studying ubiquitination presents a fundamental challenge: the low stoichiometry of this modification under normal physiological conditions [63] [52]. This means that at any given moment, only a small fraction of a target protein may be ubiquitinated, making these modified forms difficult to detect amid the abundance of non-ubiquitinated proteins.
The transient nature of ubiquitination further complicates its study. Ubiquitinated proteins are typically unstable and rapidly deubiquitinated by cellular deubiquitinating enzymes (DUBs), necessitating prompt sample processing and analysis to preserve the native ubiquitination state [63]. Additionally, the dynamic nature of this modification means ubiquitination levels and patterns can vary significantly under different physiological and pathological conditions, complicating both experimental design and data interpretation [63].
This technical support guide addresses these challenges by presenting integrated validation approaches that combine mass spectrometry, biochemical, and computational data to provide robust, reproducible analysis of protein ubiquitination, even at low stoichiometry levels.
Essential Research Reagent Solutions
Successful ubiquitination research requires specialized reagents to overcome the challenges of low abundance and transient modification. The table below summarizes key solutions for ubiquitination studies.
Table 1: Essential Research Reagent Solutions for Ubiquitination Studies
| Reagent Category | Specific Examples | Function and Application |
|---|---|---|
| Ubiquitin-Binding Domains | Tandem Ubiquitin Binding Entities (TUBEs), ThUBD (Tandem hybrid UBD) | High-affinity capture of polyubiquitinated proteins; protects ubiquitin chains from DUBs during isolation [12] [52]. |
| Linkage-Specific Binders | TRABID-NZF1 (K29/K33-specific), linkage-specific Ub antibodies | Enrichment of ubiquitinated proteins with specific chain linkages (e.g., K48, K63) [52] [64]. |
| Proteasome Inhibitors | MG-132, Bortezomib | Blocks degradation of ubiquitinated proteins, increasing their intracellular abundance for detection [48] [65]. |
| Affinity Tags | 6× His-tagged Ub, Strep-tagged Ub | Purification of ubiquitinated substrates from cell lysates after tagged ubiquitin expression [52]. |
| Deubiquitinase Inhibitors | Broad-spectrum DUB inhibitors | Prevents removal of ubiquitin chains during sample preparation, preserving the native ubiquitination state [63]. |
Troubleshooting Guides and FAQs
Pre-Experimental Considerations
Q: What preliminary steps are crucial before starting a ubiquitination experiment? Before beginning, carefully consider your biological question and which method is most likely to answer it. Check the abundance and regulation of your protein of interest, as proteins with very low natural abundance may require enrichment prior to analysis. Always include proteasome inhibitors (e.g., 5-25 µM MG-132 for 1-2 hours before harvesting) to preserve ubiquitination signals, though optimization is needed for different cell types as overexposure can cause cytotoxicity [65].
Q: How can I prevent the loss of ubiquitination signals during sample preparation? Ubiquitinated proteins are inherently unstable. Work quickly at low temperatures (4°C for processing; -20°C to -80°C for storage) and add protease inhibitor cocktails to all buffers during sample preparation. These inhibitors should be active against a broad range of aspartic, serine, and cysteine proteases. Use EDTA-free cocktails if possible, with PMSF being a recommended component [66].
Mass Spectrometry-Specific Challenges
Q: I'm not detecting my ubiquitinated protein via mass spectrometry. What could be wrong? First, verify that your protein was present in the input sample using Western Blot. If it was present but not detected by MS, sample loss during processing is likely. Scale up your experiment or enrich low-abundance proteins through immunoprecipitation. Additionally, check your digestion protocol - unsuitable peptide sizes (too long or short) from improper digestion can prevent detection. Adjust digestion time, try different proteases, or consider double digestion with two different proteases [66].
Q: How can I improve the coverage of ubiquitinated peptides in MS analysis? Employ data-independent acquisition (DIA) methods rather than data-dependent acquisition (DDA). DIA markedly improves the number of identifications and quantitative accuracy for ubiquitination studies. One study combining diGly antibody-based enrichment with optimized DIA identified approximately 35,000 distinct diGly peptides in single measurements - double what was achievable with DDA [48].
Q: What are the critical parameters to evaluate in MS data analysis for ubiquitination?
- Intensity: Measures peptide abundance, influenced by original protein abundance and peptide ionization efficiency.
- Peptide Count: Number of different detected peptides from the same protein; low counts suggest low abundance or suboptimal peptide sizes.
- Coverage: Proportion of the protein covered by detected peptides; aim for 40-80% in purified samples.
- Statistical Significance: P-value/Q-value/Score should be <0.05, indicating reliable identification [66].
Method Selection and Optimization
Q: How do I choose between ubiquitin tagging approaches and antibody-based enrichment? Ubiquitin tagging (e.g., His- or Strep-tagged Ub) is easier and more cost-effective for screening ubiquitinated substrates in cells but may not completely mimic endogenous Ub and isn't feasible for animal or patient tissues [52]. Antibody-based approaches work with endogenous proteins and are applicable to tissues but come with higher costs and potential non-specific binding issues [52]. UBD-based approaches like TUBEs or ThUBD-coated plates offer high-affinity capture with unbiased linkage recognition and protection from DUBs [12] [52].
Q: Why do I see smeared bands in Western blots for ubiquitinated proteins? This is expected and actually indicates successful detection. Smearing occurs because the Ubiquitin-Trap binds monomeric ubiquitin, ubiquitin polymers, and ubiquitinated proteins of varying lengths and molecular weights. This heterogeneity creates a continuous smear rather than discrete bands [65].
Integrated Experimental Protocols
Comprehensive Workflow for Ubiquitinome Analysis
The following diagram illustrates an integrated workflow combining biochemical enrichment with advanced mass spectrometry for comprehensive ubiquitination analysis:
Diagram Title: Integrated Ubiquitinome Analysis Workflow
Protocol Details:
Sample Preparation with Proteasome Inhibition:
- Treat cells with 10 µM MG-132 for 4 hours to enhance detection of K48-linked ubiquitination by blocking proteasomal degradation [48].
- Extract proteins using conditions that preserve ubiquitination: work at 4°C, include protease inhibitors, and avoid harsh detergents that might disrupt protein interactions [63] [66].
Protein Digestion and Peptide Handling:
diGly Peptide Enrichment:
- For antibody-based enrichment: Use 1/8 of an anti-diGly antibody vial (31.25 µg) per 1 mg of peptide material for optimal results [48].
- For UBD-based approaches: Consider ThUBD-coated 96-well plates that provide unbiased enrichment across different ubiquitin chain types with high affinity, capturing approximately 5 pmol of polyubiquitin chains [12].
Peptide Fractionation (Optional but Recommended for Depth):
- Separate peptides by basic reversed-phase (bRP) chromatography into 96 fractions, then concatenate into 8-9 pools to reduce complexity.
- Process highly abundant K48-linked ubiquitin-chain derived diGly peptides separately to prevent competition during enrichment and interference with co-eluting peptides [48].
Mass Spectrometry Analysis with Optimized DIA:
- Utilize data-independent acquisition (DIA) with optimized settings: 46 precursor isolation windows with MS2 resolution of 30,000.
- Inject only 25% of the total enriched material due to the improved sensitivity of DIA methods [48].
High-Throughput Ubiquitination Detection Using ThUBD-Coated Plates
Protocol for High-Throughput Screening:
- Plate Coating: Coat Corning 3603-type 96-well plates with 1.03 µg ± 0.002 of ThUBD per well to enable specific binding to polyubiquitin chains [12].
- Sample Application: Apply cell lysates or purified protein samples to coated wells and incubate to allow binding of ubiquitinated proteins.
- Washing: Use optimized washing buffers to remove non-specifically bound proteins while retaining ubiquitinated targets.
- Detection: Detect captured ubiquitinated proteins using ThUBD-HRP conjugates or other detection methods suitable for high-throughput screening [12].
This platform enables unbiased, high-affinity capture, identification, and quantification of proteins modified by all ubiquitin chain types, making it particularly valuable for drug discovery applications where throughput is essential.
Data Integration and Validation Framework
Quantitative Comparison of Ubiquitination Detection Methods
When designing experiments or troubleshooting existing protocols, understanding the performance characteristics of different ubiquitination detection methods is crucial. The table below provides a comparative analysis of major techniques.
Table 2: Performance Comparison of Ubiquitination Detection Methods
| Method | Throughput | Sensitivity | Linkage Specificity | Key Advantages | Main Limitations |
|---|---|---|---|---|---|
| diGly DIA-MS [48] | Medium | High (35,000+ sites in single run) | No (pan-specific) | Superior quantitative accuracy, minimal missing data | Requires specialized spectral libraries, technically complex |
| ThUBD Plate Assay [12] | High | High (5 pmol capacity) | No (unbiased recognition) | High-throughput, preserves native ubiquitination | Limited to in vitro applications, may miss monoubiquitination |
| Western Blot/ Immunoblotting [16] [52] | Low | Low to Medium | Depends on antibody | Widely accessible, semi-quantitative | Low throughput, qualitative, antibody-dependent variability |
| Immunoprecipitation-MS with Tagged Ub [52] | Medium | Medium | No (pan-specific) | Works well for overexpression studies | May not reflect endogenous regulation, artifacts possible |
| TUBE-based Enrichment [52] [64] | Medium | Medium to High | No (pan-specific) | Protects chains from DUBs, good for low-abundance targets | Potential bias in chain recognition, moderate affinity |
Integrated Validation Pathway
The relationship between different validation methods demonstrates how mass spectrometry, biochemical, and computational data interconnect to provide robust evidence for ubiquitination events:
Diagram Title: Ubiquitination Data Validation Pathway
Implementation Strategy:
Mass Spectrometry Data Generation: Begin with DIA-MS analysis of diGly-enriched peptides to identify ubiquitination sites and, if possible, determine linkage types through advanced spectral libraries [48].
Computational Analysis: Process MS data using specialized software for spectral matching and quantitative comparison. Statistical measures should include P-values, Q-values, or Scores <0.05 to ensure identification reliability [48] [66].
Biochemical Validation: Confirm MS findings through independent methods:
Functional Correlation: Connect ubiquitination findings to biological outcomes by examining changes in protein stability, activity, or localization corresponding to ubiquitination status [64].
This integrated framework ensures that ubiquitination events identified through high-sensitivity MS are biologically relevant and not artifacts of the detection process, which is particularly crucial when studying low-stoichiometry ubiquitination events that might otherwise be dismissed as noise.
Addressing the challenges of low stoichiometry ubiquitination detection requires a multifaceted approach that integrates advanced mass spectrometry techniques, careful biochemical validation, and robust computational analysis. By implementing the integrated workflows, troubleshooting guides, and validation strategies outlined in this technical support document, researchers can significantly enhance the reliability and biological relevance of their ubiquitination studies. The key to success lies not in relying on a single methodology, but in the strategic combination of complementary techniques that together provide compelling evidence for genuine ubiquitination events, even when they occur at low abundance in complex biological systems.
Ubiquitination is a crucial post-translational modification that regulates diverse cellular functions, including protein degradation, signal transduction, and DNA repair. However, detecting ubiquitination presents significant challenges due to its low stoichiometry; the median ubiquitylation site occupancy is three orders of magnitude lower than that of phosphorylation [1]. This low abundance, combined with the transient nature of the modification and the complexity of ubiquitin chain architectures, makes accurate detection difficult. Researchers must carefully select detection platforms based on their specific needs for sensitivity (the ability to detect true ubiquitination events) and specificity (the ability to avoid false positives) [6] [16]. This technical guide provides troubleshooting advice and methodologies to optimize ubiquitination detection across various experimental platforms.
Platform Comparison and Performance Benchmarking
The following table summarizes the key characteristics, advantages, and limitations of major ubiquitination detection platforms, providing a benchmark for their relative sensitivity and specificity.
Table 1: Performance Benchmarking of Ubiquitination Detection Platforms
| Detection Platform | Theoretical Sensitivity | Theoretical Specificity | Key Advantages | Major Limitations |
|---|---|---|---|---|
| Immunoblotting [6] [16] | Low to Moderate (requires high-abundance substrates) | High (when using linkage-specific antibodies) | Low cost; widely accessible; provides molecular weight information. | Low-throughput; semi-quantitative; limited multiplexing capability. |
| Tagged Ubiquitin Systems (e.g., His, Strep, HA) [6] [67] | High (due to affinity enrichment) | Moderate (co-purification of endogenous His-rich/biotinylated proteins can occur) | Enables high-throughput enrichment; identifies substrates and sites via MS. | Cannot mimic endogenous Ub perfectly; genetic manipulation required. |
| Ubiquitin Antibody-Based Enrichment [6] [68] | High for enriched samples | Moderate to High (linkage-specific antibodies offer higher specificity) | Applicable to native tissues/clinical samples; can use linkage-specific antibodies. | High cost of quality antibodies; potential for non-specific binding. |
| UBD-Based Enrichment [6] | Variable (depends on UBD affinity) | High (especially with tandem UBDs for specific linkages) | Can be highly specific for certain chain types; utilizes natural Ub recognition. | Low affinity of single UBDs; requires optimization of binding domains. |
| Mass Spectrometry (without enrichment) [1] | Very Low (due to low stoichiometry) | High (if GG-peptide is definitively identified) | Gold standard for site identification; can characterize chain linkages. | Ubiquitinated peptides are masked by abundant unmodified peptides. |
| Mass Spectrometry (with enrichment) [67] [68] | High (when combined with effective enrichment) | High (with rigorous validation, e.g., virtual blotting) | High-throughput site mapping; can quantify changes under different conditions. | Complex workflow; requires specialized instrumentation and expertise. |
| Computational Prediction (e.g., ResUbiNet) [69] [70] | N/A (theoretical prediction) | N/A (theoretical prediction) | Rapid, low-cost hypothesis generation; guides experimental design. | Requires experimental validation; accuracy is not 100%. |
Troubleshooting Guides and FAQs
FAQ 1: I am getting a weak or no signal in my ubiquitin Western blot, even though my positive control works. What could be the cause?
Answer: Low signal in immunoblotting is a common issue, often stemming from the inherently low stoichiometry of ubiquitination. Below is a troubleshooting guide for this problem [71].
Table 2: Troubleshooting Low Signal in Ubiquitin Western Blots
| Problem | Possible Cause | Recommended Solution |
|---|---|---|
| Low Protein Expression/Modification | The target protein is expressed at low levels or has a low basal ubiquitination level. | Use expression profiling tools (e.g., BioGPS) to verify expression. Include a known positive control. Increase protein load (e.g., 50-100 µg for tissue lysates) [71]. |
| Inefficient Lysis | Incomplete lysis fails to extract membrane-bound or nuclear ubiquitinated proteins. | Implement sonication. Use 3 x 10-second bursts with a microtip probe sonicator on ice. Alternatively, pass lysate repeatedly through a fine-gauge needle [71]. |
| Sub-optimal Antibody Conditions | The antibody dilution or buffer is not optimal for detection. | Check the datasheet for recommended dilution and use the specified buffer (BSA or milk). Reusing diluted antibodies is not recommended [71]. |
| Sub-optimal Transfer | The ubiquitinated species, which can be high molecular weight, did not transfer efficiently. | For high molecular weight proteins, decrease methanol in transfer buffer to 5-10% and increase transfer time to 3-4 hours [71]. |
| Protein Degradation | Ubiquitinated proteins have been degraded in the lysate. | Always use fresh protease inhibitors (e.g., leupeptin, PMSF) and phosphatase inhibitors in the lysis buffer. Keep samples on ice [71]. |
FAQ 2: In my mass spectrometry ubiquitinome study, I have a long list of candidate proteins. How can I validate that they are genuine ubiquitin conjugates and not contaminants?
Answer: A major challenge in proteomic studies is distinguishing true ubiquitin conjugates from co-purified contaminants. We recommend a multi-faceted validation strategy:
- Virtual Western Blot Analysis: This is a powerful large-scale validation method. Compute the experimental molecular weight of your candidate proteins from the gel electrophoresis data. Genuine ubiquitin conjugates, especially polyubiquitinated ones, will show a dramatic increase in molecular weight compared to their theoretical weight. One study noted that after this stringent filtering, only ~30% of initially identified candidates were accepted, significantly reducing false discovery rates [67].
- Map Ubiquitination Sites: The gold standard for validation is the MS/MS identification of the signature di-glycine (GG) remnant (a 114.0429 Da mass shift) on modified lysine residues. However, this requires nearly 100% peptide coverage and is not always possible for every candidate [67] [68].
- Orthogonal Validation: Confirm key findings using an independent method, such as traditional immunoprecipitation followed by Western blotting (IP-WB) for a subset of candidates.
FAQ 3: What is the best method for detecting ubiquitination in clinical tissue samples where genetic manipulation is not possible?
Answer: For clinical samples, the most direct and robust method is Ubiquitin Antibody-Based Enrichment. Linkage-specific ubiquitin antibodies (e.g., for K48 or K63 chains) can be used to enrich ubiquitinated proteins directly from tissue lysates, which can then be analyzed by Western blot or mass spectrometry. This method does not require genetic tags and works under physiological conditions, making it ideal for native tissues [6].
Detailed Experimental Protocols
Protocol 1: In Vitro Ubiquitination Assay
This assay is used to reconstitute the ubiquitination cascade using purified components to study enzyme specificity and substrate modification [68].
Principle: The assay combines E1 (activating), E2 (conjugating), and E3 (ligase) enzymes with ubiquitin and a substrate protein in an ATP-dependent reaction. The formation of ubiquitin-substrate conjugates is detected by a shift in molecular weight on a Western blot.
Reagents and Workflow:
Procedure:
- Recombinant Enzymes Preparation: Combine the following components in a reaction tube on ice:
- 50 nM E1 enzyme
- 1.5 µM E2 enzyme
- 2.5 µM E3 ligase
- 5-10 µg Substrate protein
- 50 µM Ubiquitin
- 2 mM ATP
- Reaction buffer (e.g., 50 mM Tris-HCl, pH 7.5, 5 mM MgCl2, 0.5 mM DTT)
- Incubation: Mix the components and incubate the reaction at 30°C for 30-60 minutes.
- Termination: Stop the reaction by adding SDS-PAGE loading buffer and boiling at 95°C for 5-10 minutes.
- Analysis: Resolve the proteins by SDS-PAGE and perform Western blotting using an antibody against your substrate protein or ubiquitin. A successful reaction will show higher molecular weight smears or bands corresponding to mono- or poly-ubiquitinated forms of the substrate [68].
Protocol 2: Tandem Affinity Purification of Ubiquitinated Proteins for Mass Spectrometry
This protocol describes a robust method for enriching ubiquitinated proteins from cells expressing tagged ubiquitin for subsequent identification by mass spectrometry [6] [67].
Principle: Cells are engineered to express a tandem-tagged ubiquitin (e.g., 6xHis-myc-Ub). Under denaturing conditions, ubiquitinated proteins are purified using two sequential affinity steps, reducing non-specific binding. The purified conjugates are then separated by SDS-PAGE, digested with trypsin, and analyzed by LC-MS/MS.
Reagents and Workflow:
Procedure:
- Cell Lysis: Grow cells expressing 6xHis-myc-ubiquitin to log phase. Lyse cells in denaturing buffer (e.g., 8 M urea, 0.1 M NaH2PO4, 10 mM Tris-HCl, pH 8.0, 10 mM β-mercaptoethanol). Clarify the lysate by high-speed centrifugation [67].
- First Affinity Purification (Ni2+-NTA): Incubate the clarified lysate with Ni2+-NTA agarose resin. Wash the resin extensively with denaturing buffer, followed by a wash buffer at pH 6.0. Elute the bound proteins with a low-pH elution buffer (e.g., pH 4.5) [67].
- Second Affinity Purification (myc-IP): Adjust the pH of the eluate to neutrality. Perform immunoprecipitation using an anti-myc antibody conjugated to beads. Wash and elute the purified ubiquitin conjugates.
- GeLC-MS/MS Analysis:
- Resolve the eluted proteins on a 6-12% gradient SDS-PAGE gel.
- Stain the gel with Coomassie blue and cut the entire lane into multiple fractions.
- Digest proteins in each gel slice with trypsin.
- Analyze the resulting peptides by nanoLC-MS/MS.
- Search MS/MS data against a protein database, specifying a dynamic modification of +114.0429 Da on lysine for the GG-remnant to identify ubiquitination sites [67].
The Scientist's Toolkit: Key Research Reagents
Table 3: Essential Reagents for Ubiquitination Detection
| Reagent Category | Specific Examples | Function in Experiment |
|---|---|---|
| Affinity Tags [6] | 6xHis, Strep, HA, FLAG, Biotin | Genetically fused to ubiquitin for high-affinity purification of ubiquitinated conjugates from complex cell lysates. |
| Ubiquitin Antibodies [6] [16] | P4D1, FK1, FK2, Linkage-specific (K48, K63, etc.) | Used for immunoprecipitation, Western blotting, and immunofluorescence to detect and enrich ubiquitinated proteins. |
| Ubiquitin-Binding Domains (UBDs) [6] | Tandem-repeated UBA, UIM, NZF | Used as recombinant proteins to enrich endogenous ubiquitinated proteins or specific ubiquitin linkages. |
| Enzymes for In Vitro Assays [68] | Recombinant E1, E2, and E3 enzymes | Used to reconstitute the ubiquitination cascade in a test tube to study specific enzyme-substrate relationships. |
| Proteasome Inhibitors [1] | MG132, Bortezomib | Used in cell treatments to block the degradation of ubiquitinated proteins, thereby increasing their intracellular abundance for easier detection. |
| Deubiquitinase (DUB) Inhibitors | PR-619, N-Ethylmaleimide (NEM) | Added to lysis buffers to prevent the removal of ubiquitin from substrates by endogenous DUBs during sample preparation. |
| Mass Spectrometry Standards | TMT, SILAC | Enable relative quantification of ubiquitination levels across different samples or conditions. |
Technical Support Center: Troubleshooting Ubiquitination Detection
Troubleshooting Guides
This section addresses common experimental challenges in detecting low-stoichiometry ubiquitination, a key hurdle in proteostasis research relevant to cancer and neurodegenerative diseases [6].
Issue 1: Low Sensitivity in Detecting Ubiquitinated Proteins from Complex Proteomes
- Problem: Inability to detect ubiquitination signals, especially for trace or ultra-trace target proteins in low-input samples [12].
- Solution A (Utilize High-Affinity Capture Reagents): Replace traditional TUBEs (Tandem Ubiquitin Binding Entities) with more advanced binders like the ThUBD (Tandem hybrid Ubiquitin-Binding Domain). ThUBD demonstrates higher affinity for polyubiquitinated proteins and exhibits no bias towards different ubiquitin chain types, enabling more sensitive and unbiased capture [12].
- Solution B (Employ High-Throughput Enrichment Platforms): Use ThUBD-coated high-density 96-well plates. Systematically optimized conditions for these plates allow for the specific binding to approximately 5 pmol of polyubiquitin chains, facilitating high-throughput, sensitive capture from complex mixtures [12].
- Solution C (Linkage-Specific Antibodies): For investigating specific ubiquitin chain functions (e.g., K48-linked degradation signals), use linkage-specific antibodies (e.g., for K48, K63, M1 chains) for immunoprecipitation or western blotting [6].
Issue 2: Methodological Bias in Ubiquitin Chain Detection
- Problem: Detection results do not accurately reflect the true cellular ubiquitination status due to affinity reagents that favor certain ubiquitin chain linkages [12].
- Solution A (Use Unbiased Binders): Implement ThUBD-based methods (like TUF-WB or the 96-well plate platform) which are engineered for unbiased recognition of all ubiquitin chain types [12].
- Solution B (Mass Spectrometry (MS) Validation): Confirm ubiquitination sites and chain linkage types using MS-based proteomics. While MS can be complex, it provides unbiased, high-throughput identification and quantification when combined with effective enrichment strategies [6].
Issue 3: High Background or Non-Specific Binding in Affinity Purification
- Problem: Co-purification of non-ubiquitinated proteins during enrichment, impairing identification sensitivity [6].
- Solution A (Optimize Wash Buffers): When using tagged-Ub or UBD-based purifications, systematically optimize the composition and stringency of wash buffers to reduce non-specific binding. The ThUBD-coated plate method, for instance, requires specific optimized washing buffers [12].
- Solution B (Validate with Control Cell Lines): Use control cell lines that do not express the tagged ubiquitin (for ectopic expression systems) or that are deficient in the ubiquitin machinery to distinguish specific signals from background [6].
Frequently Asked Questions (FAQs)
Q1: What are the primary methods for enriching ubiquitinated proteins from cell lysates? A: The three main approaches are:
- Ubiquitin Tag-Based: Expressing His- or Strep-tagged ubiquitin in cells for purification with Ni-NTA or Strep-Tactin resins. This is easy but may not mimic endogenous ubiquitin perfectly [6].
- Antibody-Based: Using anti-ubiquitin antibodies (e.g., P4D1, FK2) or linkage-specific antibodies to immunoprecipitate endogenous ubiquitinated proteins. This is applicable to tissue samples but can be costly [6].
- UBD-Based: Using ubiquitin-binding domains (e.g., TUBEs, ThUBD) as high-affinity reagents to capture polyubiquitinated proteins. ThUBD offers improved affinity and reduced linkage bias [12] [6].
Q2: Why is the detection of low-stoichiometry ubiquitination so challenging? A: Key challenges include the inherently low abundance of many ubiquitinated species, interference from abundant non-modified proteins, the complexity and diversity of ubiquitin chain architectures, and limitations in the affinity and specificity of available detection tools [6].
Q3: How can I monitor the ubiquitination status of a target protein in a high-throughput format for drug screening? A: ThUBD-coated 96-well plates are designed for this purpose. They enable high-throughput, rapid, and precise detection of ubiquitination signals, making them suitable for screening applications such as evaluating PROTAC (Proteolysis-Targeting Chimera) efficacy [12].
Q4: My immunoblot results for ubiquitin are inconsistent. What could be the reason? A: Common issues include the use of low-affinity antibodies against the highly conserved ubiquitin protein, antibody bias toward specific ubiquitin chain types, and the low stoichiometry of the modification itself. Cross-validating with an alternative method, such as a ThUBD-based assay (e.g., TUF-WB) or MS, is recommended [12] [6].
Experimental Protocols for Key Methodologies
Protocol 1: High-Throughput Ubiquitination Detection Using ThUBD-Coated 96-Well Plates [12]
This protocol is adapted from the recent high-throughput method for specific, rapid, and precise detection of protein ubiquitination.
Plate Coating:
- Use Corning 3603-type 96-well plates.
- Coat each well with 1.03 μg ± 0.002 of purified ThUBD protein.
- Incubate overnight at 4°C to allow for proper immobilization.
Sample Preparation and Incubation:
- Prepare cell lysates from your experimental system (e.g., HEK293T cells treated with a compound of interest) using a non-denaturing lysis buffer.
- Centrifuge the lysates to remove insoluble debris.
- Add the clarified lysate to the ThUBD-coated wells and incubate for 2 hours at room temperature with gentle shaking to allow ubiquitinated proteins to bind.
Washing:
- Aspirate the lysate and wash the wells three times with 200 μL of a pre-optimized washing buffer (specific composition is critical as per the method) to remove non-specifically bound proteins.
Detection:
- The detection method can be tailored based on the downstream application.
- For colorimetric/chemiluminescent detection: Add a primary antibody against your protein of interest, followed by an HRP-conjugated secondary antibody. Develop the signal with an appropriate substrate.
- For direct detection of ubiquitin chains: Use a ThUBD-HRP conjugate to directly detect captured polyubiquitin chains.
- Quantify the signal using a plate reader.
Protocol 2: Enrichment of Ubiquitinated Proteins using Tandem Hybrid Ubiquitin-Binding Domains (ThUBD) for MS Analysis [12] [6]
ThUBD Immobilization:
- Purify recombinant ThUBD protein (e.g., with a GST or His tag).
- Immobilize ThUBD onto the appropriate affinity resin (e.g., Glutathione Sepharose for GST-ThUBD or Ni-NTA agarose for His-ThUBD).
Lysate Preparation:
- Lyse cells in a buffer compatible with downstream MS analysis, typically containing protease inhibitors and DUB inhibitors (e.g., N-Ethylmaleimide) to preserve ubiquitination states.
Affinity Enrichment:
- Incubate the cell lysate with the ThUBD-bound resin for 2-4 hours at 4°C.
- Wash the resin thoroughly with lysis buffer, followed by a final wash with a mild buffer like PBS or ammonium bicarbonate to remove detergents and salts.
Elution and Digestion:
- Elute the bound ubiquitinated proteins using a denaturing solution (e.g., SDS-containing buffer) or by competitive elution (e.g., with free ubiquitin).
- Denature, reduce, and alkylate the eluted proteins.
- Digest the proteins into peptides using trypsin.
Peptide Cleanup and MS Analysis:
- Desalt the peptides using a C18 stage tip.
- Analyze the peptides by liquid chromatography-tandem mass spectrometry (LC-MS/MS). The identification of ubiquitination sites relies on detecting the characteristic di-glycine (Gly-Gly) remnant (a 114.04 Da mass shift) on modified lysine residues after tryptic digestion [6].
Table 1: Performance Comparison of Ubiquitin Enrichment Methodologies
| Methodology | Throughput | Sensitivity | Linkage Bias | Key Applications |
|---|---|---|---|---|
| Antibody-based (e.g., P4D1/FK2) | Low-Medium | Medium | High (varies by antibody) | Immunoblotting, IP for specific proteins [6] |
| Tagged Ubiquitin (e.g., His-Ub) | Medium | Medium | Low (general capture) | Proteomic profiling of substrates [6] |
| TUBE-based Assays | Medium | Medium | High (low affinity, biased) [12] | General enrichment, commercial assay plates [12] |
| ThUBD-based Assays | High (96-well format) | High (captures ~5 pmol Ub chains) | None (unbiased recognition) [12] | High-throughput screening, sensitive detection from complex proteomes [12] |
Table 2: Key Research Reagent Solutions for Ubiquitination Studies
| Reagent / Tool | Function / Description | Example Use Case |
|---|---|---|
| ThUBD (Tandem hybrid UBD) | Engineered ubiquitin-binding domain with high affinity and no linkage bias for polyubiquitin chains [12]. | High-sensitivity capture for WB (TUF-WB) or in 96-well plate format for screening [12]. |
| Linkage-Specific Ub Antibodies | Antibodies that recognize specific ubiquitin chain linkages (K48, K63, M1, etc.) [6]. | Investigating the role of specific chain types in signaling pathways (e.g., K48 for degradation). |
| Tandem Affinity Tags (Strep/His) | Tags (e.g., Strep-tag II, 6xHis) fused to ubiquitin for affinity purification of ubiquitinated proteins [6]. | Large-scale purification of ubiquitinated substrates for proteomic analysis. |
| PROTAC Molecules | Bifunctional molecules that recruit E3 ligases to target proteins, inducing their ubiquitination and degradation [12] [72]. | Targeted protein degradation; studying the role of specific proteins in disease [12]. |
| Deubiquitinase (DUB) Inhibitors | Small molecules (e.g., IU1-47) that inhibit DUB activity, stabilizing ubiquitination signals [72]. | Used in lysates to prevent deubiquitination during experiments, enhancing detection [72]. |
Signaling Pathways and Workflow Diagrams
Diagram 1: ThUBD assay overview
Diagram 2: UPS dysfunction in disease
Diagram 3: Ubiquitination enzyme cascade
Core Challenges in Low Stoichiometry Ubiquitination Detection
The analysis of protein ubiquitination is fraught with methodological hurdles, primarily due to the characteristically low stoichiometry of this modification, where only a tiny fraction of any given substrate is ubiquitinated at any moment [73]. This section outlines the primary challenges and their implications for research.
| Challenge | Impact on Research & Detection |
|---|---|
| Low Stoomatic Stoichiometry | The very low abundance of ubiquitinated species relative to their non-modified counterparts makes enrichment an essential pre-analytical step [73]. |
| Transient and Reversible Nature | The dynamic actions of E1/E2/E3 enzymes and deubiquitinases (DUBs) mean ubiquitination is a fleeting signal, often requiring proteasome inhibition (e.g., MG-132) to preserve modifications for analysis [74]. |
| Complex Chain Architecture | Ubiquitin itself can form polymers (polyUb chains) of different lengths and linkages (e.g., K48, K63), each with distinct biological functions. Standard enrichment methods often cannot differentiate these architectures [74] [52]. |
| Antibody Specificity and Affinity | Antibodies against ubiquitin (e.g., K-ε-GG) can exhibit non-specific binding or cross-react with similar modifications from ubiquitin-like proteins (UBLs) like NEDD8 and ISG15, leading to false positives [73] [74]. |
| Signal Dilution in Global Proteomics | In the absence of enrichment, ubiquitinated peptides are often undetectable by mass spectrometry, with one study finding less than 0.02% of identified peptides were ubiquitinated without enrichment [73]. |
Troubleshooting Guides & FAQs
Sample Preparation & Enrichment
Q: My ubiquitin enrichment yields are low, and I cannot detect target substrates. What steps can I take?
- A: Focus on preserving the labile ubiquitin-substrate bond and optimizing your enrichment protocol.
- Prevent Deubiquitination: Include broad-spectrum DUB inhibitors in your lysis and wash buffers to maintain the ubiquitinated state of proteins during sample preparation.
- Increase Input Material: The low stoichiometry of modification often requires significant starting material. Use 3-5 mg of total protein lysate as input for peptide-level immunoaffinity enrichments [73].
- Verify Enrichment Efficiency: Always run a western blot on your pre-enrichment lysate, flow-through, and eluate fractions using a general anti-ubiquitin antibody (like P4D1 or FK2) to confirm successful pull-down.
- Use Denaturing Conditions: To minimize co-purification of non-specific interacting proteins, perform lysates under denaturing conditions (e.g., with 1-2% SDS) whenever compatible with your enrichment method [75] [52].
Q: How can I increase the amount of ubiquitinated protein in my cell samples before harvesting?
- A: Treat cells with proteasome inhibitors like MG-132. A recommended starting point is to incubate cells with 5-25 µM MG-132 for 1–2 hours before harvest. Note that overexposure can lead to cytotoxic effects, so conditions should be optimized for each cell type [74].
Antibody and Affinity Reagent Issues
Q: My western blots for ubiquitin show a high background smear. Is this expected, and how can I improve specificity?
- A: A smear is often expected because the Ubiquitin-Trap binds monomeric ubiquitin, ubiquitin polymers, and ubiquitinylated proteins of varying lengths [74]. To improve specificity:
- Increase Wash Stringency: Incorporate higher salt concentrations (e.g., 300-500 mM NaCl) and detergents like 0.1% SDS in your wash buffers to reduce non-specific binding.
- Include Negative Controls: Use a sample from cells not expressing the tagged ubiquitin (for tagged approaches) or a sample treated with a relevant DUB in vitro to remove ubiquitin as a negative control.
- Validate with Linkage-Specific Antibodies: If investigating a specific chain type (e.g., K48 or K63), use linkage-specific antibodies for western blotting to confirm the identity of the smear [74].
Q: The anti-K-ε-GG antibody is central to MS studies. What are its key limitations?
- A: The K-ε-GG antibody is powerful but has two major caveats [73]:
- It does not distinguish between ubiquitin and the ubiquitin-like proteins (UBLs) NEDD8 and ISG15, as they all leave a di-glycine remnant after trypsin digestion. Identified sites should be referred to as "di-glycine modified" without follow-up validation.
- The iTRAQ labeling reagent can modify the primary amine of the di-glycine remnant itself. Database searches for MS data must include a variable modification of +258.1449 Da on lysine residues to account for this, or sites will be missed.
Mass Spectrometry and Data Analysis
Q: What are the critical search parameters for identifying ubiquitination sites from mass spectrometry data?
- A: When searching MS/MS data against a protein database, the following variable modifications are essential [73] [75]:
GlyGly (K): +114.0429 Da. This is the diagnostic mass shift for the tryptic di-glycine remnant.iTRAQ (K): +258.1449 Da (for 4-plex). Required if iTRAQ labeling was performed after K-ε-GG enrichment, as the tag modifies the ε-amino group of the modified lysine.Oxidation (M): +15.9949 Da. A common artifact.Carbamidomethyl (C): +57.0215 Da. A standard modification from alkylation.- Set "Max Missed Cleavages" to a higher number (e.g., 3-4) because trypsin does not cleave at di-glycine-modified lysine residues, providing greater confidence in site localization [73].
Detailed Experimental Protocols
Protocol: Integrated Analysis of Global and Ubiquitylated Proteomes using iTRAQ
This protocol, adapted from a 2015 study, allows for the simultaneous quantification of changes in total protein abundance and specific ubiquitination events [73].
1. Protein Extraction and Digestion:
- Homogenize tissue samples (e.g., patient-derived xenografts) in a denaturing lysis buffer.
- Reduce, alkylate, and digest the extracted proteins with trypsin.
2. Peptide Labeling for Global Proteome:
- Label the resulting peptides from each sample with different isobaric tags from a 4-plex iTRAQ or TMT kit according to the manufacturer's instructions.
- Combine the labeled samples and analyze a portion by LC-MS/MS to quantify changes in total protein levels.
3. Immunoaffinity Enrichment of Ubiquitinated Peptides:
- Take another portion of the combined, digested peptide mixture (e.g., 3 mg total) and subject it to enrichment using an anti-K-ε-GG antibody conjugated to beads [73].
- Wash the beads stringently and elute the bound ubiquitinated peptides.
4. Peptide Labeling for Ubiquitinated Proteome:
- Label the enriched ubiquitinated peptides with iTRAQ reagents. Critical step: Because the labeling occurs after enrichment, the database search must account for the iTRAQ tag on the modified lysine [73].
5. LC-MS/MS Analysis and Data Integration:
- Analyze the labeled, enriched peptides by LC-MS/MS.
- Integrate the data from the global and ubiquitinated proteome runs to distinguish changes in ubiquitination from changes in total protein abundance.
Protocol: Enriching Ubiquitinated Proteins from Tissues using Anti-Ubiquitin Antibodies
This protocol is ideal for samples where genetic manipulation (e.g., His-tagging) is not feasible, such as clinical or animal tissues [52].
1. Tissue Lysis under Denaturing Conditions:
- Snap-freeze tissue samples in liquid nitrogen and grind to a powder.
- Lyse the powder in a buffer containing 1-2% SDS and 50-100 mM Tris-HCl (pH 7.5) with protease and DUB inhibitors. Boil for 5-10 minutes to fully denature proteins and inactivate enzymes.
2. Pre-Clearing and Antibody Incubation:
- Dilute the lysate 10-fold with a no-SDS buffer to reduce detergent concentration.
- Pre-clear the diluted lysate with Protein A/G beads for 1 hour to reduce non-specific binding.
- Incubate the pre-cleared supernatant with an anti-ubiquitin antibody (e.g., P4D1 or FK2) overnight at 4°C.
3. Immunoprecipitation and Wash:
- Add Protein A/G beads and incubate for 2-4 hours.
- Pellet the beads and wash 3-4 times with a mild wash buffer.
4. Elution and Analysis:
- Elute the bound ubiquitinated proteins by boiling the beads in SDS-PAGE loading buffer.
- Analyze by western blot or prepare for MS by in-gel or on-bead digestion.
The Scientist's Toolkit: Research Reagent Solutions
| Research Reagent | Function & Application | Key Considerations |
|---|---|---|
| K-ε-GG Antibody | Immunoaffinity enrichment of ubiquitinated peptides for mass spectrometry; recognizes the di-glycine remnant left after trypsin digestion [73]. | Does not distinguish between ubiquitin, NEDD8, and ISG15 modifications. Requires specific MS search parameters [73]. |
| Ubiquitin-Trap (Nanobody) | Pulls down mono- and poly-ubiquitinated proteins from cell extracts under native or denaturing conditions for western blot or MS [74]. | Not linkage-specific. Can be used for IP-MS workflows. Binding capacity is hard to define due to variable chain lengths [74]. |
| Linkage-Specific Ub Antibodies | Enrich or detect polyubiquitin chains with specific linkages (e.g., K48, K63) to study their unique functions [52]. | Essential for validating chain topology in western blots after general enrichment. Quality and specificity vary by vendor. |
| Tandem Ubiquitin-Binding Entities (TUBEs) | High-affinity tools to protect ubiquitinated proteins from deubiquitination and proteasomal degradation during isolation [52]. | Useful for stabilizing labile ubiquitination events. Can be tagged for affinity purification. |
| His-/Strep-Tagged Ubiquitin | For expression in cells to allow purification of ubiquitinated proteins under fully denaturing conditions via Ni-NTA or Strep-Tactin resin [75] [52]. | Cannot be used in human/animal tissues. May cause artifacts as it does not fully mimic endogenous ubiquitin pools. |
| Proteasome Inhibitors (MG-132) | Increases the cellular pool of ubiquitinated proteins by blocking their degradation, thereby enhancing detection signal [74]. | Can be cytotoxic with prolonged exposure. Requires optimization for different cell types (e.g., 5-25 µM for 1-2 hours). |
Visualizing the Ubiquitin Conjugation Pathway
Conclusion
The evolving landscape of ubiquitination detection methodologies provides increasingly powerful tools to overcome the persistent challenge of low stoichiometry. The integration of complementary approaches—from advanced mass spectrometry techniques and high-throughput biochemical assays to sophisticated computational predictions—enables researchers to capture the dynamic complexity of the ubiquitin code with unprecedented sensitivity and precision. As these technologies continue to mature, they promise to unlock deeper understanding of ubiquitination roles in disease pathogenesis, particularly in cancer and neurodegenerative disorders. Future directions will likely focus on developing even more sensitive enrichment strategies, creating standardized validation frameworks across platforms, and establishing integrated workflows that seamlessly connect ubiquitination site discovery to functional characterization. These advances will be crucial for translating ubiquitination research into novel therapeutic strategies that target the ubiquitin-proteasome system, ultimately enabling more effective interventions for a wide range of human diseases.
References
- 1. Global, site-resolved analysis of ubiquitylation occupancy ... [https://www.sciencedirect.com/science/article/pii/S0092867424003155]
- 2. Unraveling chain specific ubiquitination in cells using ... [https://www.nature.com/articles/s41598-025-07242-9]
- 3. Aging and diet alter the protein ubiquitylation landscape in ... [https://www.nature.com/articles/s41467-025-60542-6]
- 4. Small Molecule‐Induced Alterations of Protein ... [https://pmc.ncbi.nlm.nih.gov/articles/PMC12322627/]
- 5. Tips and tricks for successful Mass spec experiments [https://www.ptglab.com/news/blog/tips-and-tricks-for-successful-mass-spec-experiments/?srsltid=AfmBOoowyMxeS6NZI9Y6kEgTaWu2J5KCFooUauZsJkZuZn4W_sUtWJxj]
- 6. Current methodologies in protein ubiquitination ... [https://pmc.ncbi.nlm.nih.gov/articles/PMC9373315/]
- 7. Selective ubiquitination of drug-like small molecules by the ... [https://www.nature.com/articles/s41467-025-63442-x]
- 8. Ubiquitin [https://en.wikipedia.org/wiki/Ubiquitin]
- 9. Global approaches to understanding ubiquitination [https://genomebiology.biomedcentral.com/articles/10.1186/gb-2005-6-10-233]
- 10. Antibody-free approach for ubiquitination profiling by ... [https://www.sciencedirect.com/science/article/abs/pii/S0003267023000983]
- 11. Monoubiquitination empowers ubiquitin chain elongation [https://pmc.ncbi.nlm.nih.gov/articles/PMC10944112/]
- 12. A High-Throughput Method for Specific, Rapid, Precise and ... [https://www.sciencedirect.com/science/article/abs/pii/S0039914025015681]
- 13. A high-throughput method for specific, rapid, precise and ... [https://pubmed.ncbi.nlm.nih.gov/41197384/]
- 14. Use of a High-Affinity Ubiquitin-Binding Domain to Detect and ... [https://pmc.ncbi.nlm.nih.gov/articles/PMC12423275/]
- 15. Study reveals how aging reshapes protein chemistry in the ... [https://www.news-medical.net/news/20251120/Study-reveals-how-aging-reshapes-protein-chemistry-in-the-brain.aspx]
- 16. Ubiquitination detection techniques - PMC - PubMed Central [https://pmc.ncbi.nlm.nih.gov/articles/PMC10625345/]
- 17. Ubiquitin modifications | Cell Research [https://www.nature.com/articles/cr201639]
- 18. How to Better Study Ubiquitination [https://www.ptglab.com/news/blog/how-to-better-study-ubiquitination/?srsltid=AfmBOorFYNBGMGFStwF7ThaPMQOj1XcAKYarAVmvpxbFHJGdOT2Xu568]
- 19. A High-Throughput Assay for Monitoring Ubiquitination in ... [https://www.frontiersin.org/journals/chemistry/articles/10.3389/fchem.2019.00816/full]
- 20. An optimized protocol to detect protein ubiquitination and ... [https://pmc.ncbi.nlm.nih.gov/articles/PMC10050764/]
- 21. Quantifying Ubiquitin Signaling - PMC - PubMed Central [https://pmc.ncbi.nlm.nih.gov/articles/PMC4441763/]
- 22. Site-directed multivalent conjugation of antibodies to ... [https://www.nature.com/articles/s41551-024-01342-z]
- 23. Advancing Antibody Conjugates with Ubi-Tagging [https://communities.springernature.com/posts/behind-the-paper-advancing-antibody-conjugates-with-ubi-tagging]
- 24. Investigating the Interaction Profile of Unconjugated Ubiquitin [https://pmc.ncbi.nlm.nih.gov/articles/PMC12447379/]
- 25. Systematic and quantitative assessment of the ubiquitin ... [https://pmc.ncbi.nlm.nih.gov/articles/PMC3200427/]
- 26. Application of quantitative to the integrated analysis of... proteomics [https://link.springer.com/article/10.1186/s12014-015-9086-5]
- 27. Proteomics Sample Preparation FAQ [https://www.metwarebio.com/proteomic-sample-preparation-faq/]
- 28. A Quantitative Chemical Proteomics Approach for Site-specific... [https://pubmed.ncbi.nlm.nih.gov/30444082/]
- 29. A Quantitative Chemical Proteomics Approach for Site-specific... [https://experts.umn.edu/en/publications/a-quantitative-chemical-proteomics-approach-for-site-specific-sto]
- 30. Mass Spectrometry Standards and Calibrants Support ... [https://www.thermofisher.com/us/en/home/technical-resources/technical-reference-library/mass-spectrometry-support-center/mass-spectrometry-reagents-support/ms-standards-calibrants-support/ms-standards-calibrants-support-troubleshooting.html]
- 31. [Evaluation of high-throughput detection technology for ... [https://pubmed.ncbi.nlm.nih.gov/40873330/]
- 32. Immunoprecipitation Troubleshooting Guide [https://www.cellsignal.com/learn-and-support/troubleshooting/ip-troubleshooting-guide?srsltid=AfmBOookTjX-WasxT9WKsQRkG9b_fBJxMMkgUjwNg5stbCOsBip5CxoI]
- 33. In vitro Protein Ubiquitination Assays [https://en.bio-protocol.org/en/bpdetail?id=928&type=0]
- 34. Machine learning-based approaches for ubiquitination site ... [https://bmcbioinformatics.biomedcentral.com/articles/10.1186/s12859-023-05581-w]
- 35. UbPred: predictor of protein ubiquitination sites [https://thetruth.ccs.neu.edu/ubpred/help.html]
- 36. Identification, Analysis and Prediction of Protein Ubiquitination ... [https://pmc.ncbi.nlm.nih.gov/articles/PMC3006176/]
- 37. Ubigo-X: Protein ubiquitination site prediction using ... [https://www.sciencedirect.com/science/article/pii/S2001037025002910]
- 38. Protocols & Troubleshooting Guides [https://www.rndsystems.com/resources/protocols-troubleshooting-guides]
- 39. Ubiquitination Detection Methods [https://www.mtoz-biolabs.com/ubiquitination-detection-methods.html]
- 40. Ubiquitination Antibodies: How to Precisely Select ... - ANT Bio [https://www.antbioinc.com/blogs/technical-articles/ubiquitination-antibodies-how-to-precisely-select-the-appropriate-clone-based-on-research-needs]
- 41. Troubleshooting Protocols - Biological Sciences: Summer ... [https://guides.library.cmu.edu/biologicalsciencesSRI/troubleshooting]
- 42. How to Troubleshoot Experimental Protocols in the Lab [https://www.linkedin.com/advice/1/what-some-strategies-troubleshooting-experimental-jekfe]
- 43. Different Strategies to Overcome Resistance ... [https://www.mdpi.com/1422-0067/25/16/8949]
- 44. Proteasome dynamics in response to metabolic changes - PMC [https://pmc.ncbi.nlm.nih.gov/articles/PMC11911490/]
- 45. Mechanisms that matter: unbiased cellular screening for ... [https://www.nature.com/articles/s44386-025-00028-z]
- 46. Protocol for hybrid mass spectrometry-AI mapping of ... [https://pmc.ncbi.nlm.nih.gov/articles/PMC12590422/]
- 47. Reduced Pressure Ionization Enhances Native Mass ... [https://pmc.ncbi.nlm.nih.gov/articles/PMC12559447/]
- 48. Data-independent acquisition method for ubiquitinome ... [https://www.nature.com/articles/s41467-020-20509-1]
- 49. Protocol of Preparation of Ubiquitinated Protein Samples [https://www.creativebiomart.net/resource/principle-protocol-protocol-of-preparation-of-ubiquitinated-protein-samples-428.htm]
- 50. Why is my lysis buffer not working? 9 Lysis Buffer Issues [https://www.goldbio.com/blogs/articles/why-is-my-lysis-buffer-not-working-how-to-resolve-9-lysis-buffer-issues-that-might-be-holding-you-back?srsltid=AfmBOoqJEC3DA1c2AisXqS5qrJ7-yKoVa0C_iyrAmhW67AcYi3cBThGd]
- 51. Cell Lysis and Fractionation Support—Troubleshooting [https://www.thermofisher.com/us/en/home/technical-resources/technical-reference-library/protein-purification-isolation-support-center/cell-lysis-fractionation-support/cell-lysis-fractionation-support-troubleshooting.html]
- 52. Current methodologies in protein ubiquitination characterization [https://cellandbioscience.biomedcentral.com/articles/10.1186/s13578-022-00870-y]
- 53. Protein Sample Preparation for Mass Spectrometry [https://www.thermofisher.com/us/en/home/life-science/protein-biology/protein-biology-learning-center/protein-biology-resource-library/pierce-protein-methods/sample-preparation-mass-spectrometry.html]
- 54. Sample Preparation Guide for Mass Spectrometry–Based ... [https://www.spectroscopyonline.com/view/sample-preparation-guide-mass-spectrometry-based-proteomics]
- 55. DeepMVP: deep learning models trained on high-quality ... [https://www.nature.com/articles/s41592-025-02797-x]
- 56. New deep learning model for ubiquitination site prediction [https://www.linkedin.com/posts/iscb---international-society-for-computational-biology_httpsdoiorg101093bioadvvbaf200-activity-7383811502169837568-801a]
- 57. A closer look at cross-validation for assessing the accuracy ... [https://www.nature.com/articles/s41598-018-24937-4]
- 58. Cross-Validation - an overview [https://www.sciencedirect.com/topics/pharmacology-toxicology-and-pharmaceutical-science/cross-validation]
- 59. Using and understanding cross-validation strategies ... [https://pmc.ncbi.nlm.nih.gov/articles/PMC5441396/]
- 60. Frequently Asked Questions about Method Validation [https://www.ofnisystems.com/services/method-validation/frequently-asked-questions-about-method-validation/]
- 61. Computational prediction of protein ubiquitination sites ... [https://www.sciencedirect.com/science/article/abs/pii/S1476927118309654]
- 62. How to Better Study Ubiquitination [https://www.ptglab.com/news/blog/how-to-better-study-ubiquitination/?srsltid=AfmBOoqcjAaySzhODhMZSq2Y3ZgE2PTfzflXkVaux8cjILM4fBvnrYCT]
- 63. Precautions and Challenges in Protein Ubiquitination ... [https://www.mtoz-biolabs.com/precautions-and-challenges-in-protein-ubiquitination-detection-experiments.html]
- 64. Combinatorial ubiquitin code degrades deubiquitylation- ... [https://www.nature.com/articles/s41467-025-57873-9]
- 65. How to Better Study Ubiquitination [https://www.ptglab.com/news/blog/how-to-better-study-ubiquitination/?srsltid=AfmBOoo6ydVmHtHnvtvUXo1JuXhAY2eZM9VVeOIAL18ozz03Ui-p-7O6]
- 66. Tips and tricks for successful Mass spec experiments [https://www.ptglab.com/news/blog/tips-and-tricks-for-successful-mass-spec-experiments/?srsltid=AfmBOooSOc2wkEGq5Dk1dKxxOezRjSS57pJUDpibH94lS8QUojwOjrts]
- 67. Systematic approach for validating the ubiquitinated proteome [https://pmc.ncbi.nlm.nih.gov/articles/PMC2673951/]
- 68. Protein Ubiquitination: Assays, Sites & Proteomics Methods [https://www.creative-proteomics.com/resource/protein-ubiquitination-detection-assays-site-identification-proteomics.htm]
- 69. ResUbiNet: A Novel Deep Learning Architecture for ... [https://pmc.ncbi.nlm.nih.gov/articles/PMC12606654/]
- 70. Predictive modeling for ubiquitin proteins through ... [https://www.sciencedirect.com/science/article/pii/S2405844024085487]
- 71. Western Blotting Troubleshooting Guide [https://www.cellsignal.com/learn-and-support/troubleshooting/western-blot-troubleshooting-guide?srsltid=AfmBOoqZa_tYEo-qhzEg5OmfC1FvrhRA5hpDIKa1BnH5Pv2EJVjj5Iio]
- 72. The Ubiquitin–Proteasome System in Brain Disorders [https://link.springer.com/article/10.1007/s11481-025-10258-7]
- 73. Application of quantitative proteomics to the integrated analysis of the... [https://clinicalproteomicsjournal.biomedcentral.com/articles/10.1186/s12014-015-9086-5]
- 74. How to Better Study Ubiquitination [https://www.ptglab.com/news/blog/how-to-better-study-ubiquitination/?srsltid=AfmBOorCP3h12UOu7O47f8j09XMuWz4ebmtWSjZPy8tPYKlJ4XgIGfvb]
- 75. Dissecting the ubiquitin pathway by mass spectrometry - PMC [https://pmc.ncbi.nlm.nih.gov/articles/PMC1828906/]