Troubleshooting Ubiquitination Site Identification by Mass Spectrometry: Strategies to Overcome Key Challenges
This article provides a comprehensive guide for researchers and drug development professionals facing challenges in identifying protein ubiquitination sites using mass spectrometry.
Troubleshooting Ubiquitination Site Identification by Mass Spectrometry: Strategies to Overcome Key Challenges
Abstract
This article provides a comprehensive guide for researchers and drug development professionals facing challenges in identifying protein ubiquitination sites using mass spectrometry. It covers the foundational principles of ubiquitin biology and the tryptic diGly remnant, evaluates mainstream enrichment methodologies like anti-K-ε-GG antibodies and tagged ubiquitin systems, and offers a detailed troubleshooting framework for common pitfalls such as low stoichiometry, deubiquitinase activity, and poor enrichment specificity. Furthermore, it outlines rigorous validation techniques and comparative analysis of quantitative strategies to ensure data accuracy and biological relevance, ultimately enabling more robust profiling of the ubiquitinome in biomedical research.
Understanding Ubiquitination and Core Challenges in MS-Based Detection
The Ubiquitin Conjugation System and the Critical diGly Signature
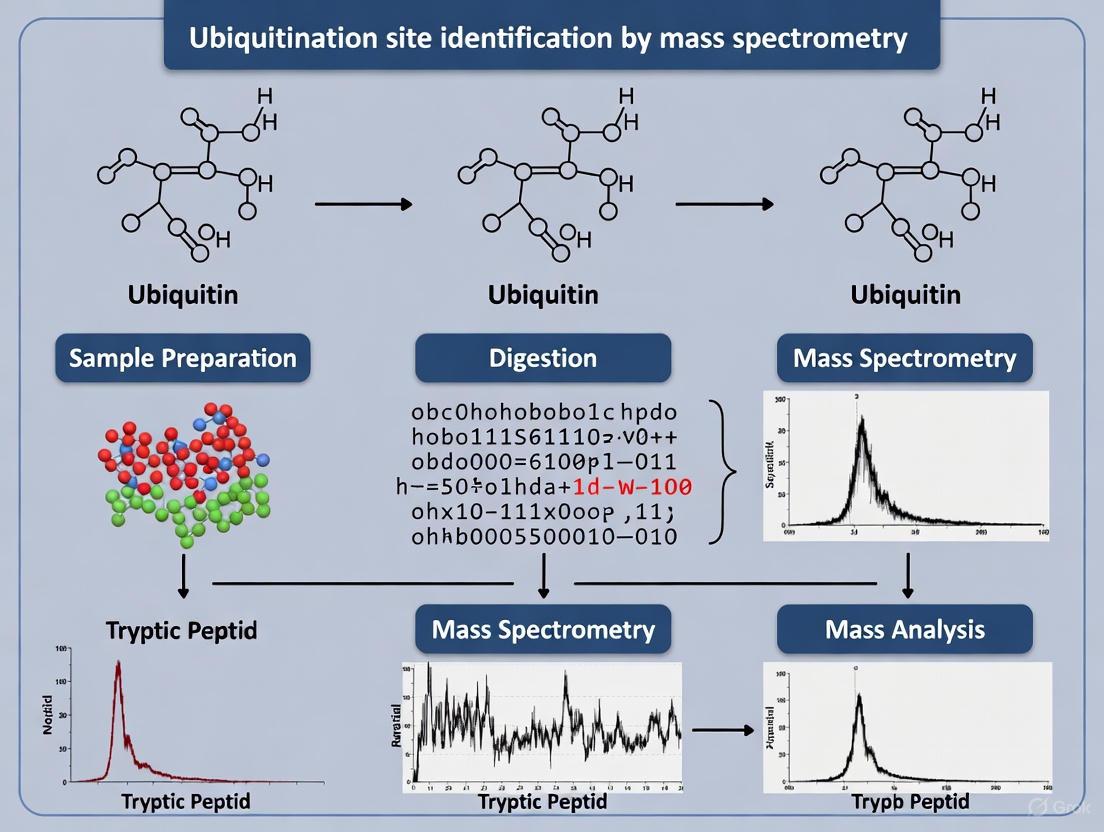
Protein ubiquitination is a fundamental post-translational modification that regulates nearly every cellular process in eukaryotes, from proteasome-mediated degradation to cell signaling, DNA repair, and inflammation [1] [2]. This modification is orchestrated by a sequential enzymatic cascade involving E1 (activating), E2 (conjugating), and E3 (ligase) enzymes, which culminates in the covalent attachment of the C-terminus of ubiquitin to a lysine residue on a target protein [3] [2]. When trypsin is used to digest proteins for mass spectrometry (MS) analysis, this modification leaves a tell-tale signature: a di-glycine (diGLY) remnant attached to the modified lysine, resulting in a characteristic mass shift of 114.043 Da [4] [5]. The antibody-based enrichment of peptides containing this diGLY motif, coupled with advanced MS, has become an indispensable tool for ubiquitinome research, enabling the identification of tens of thousands of ubiquitination sites [4] [6]. However, researchers often encounter challenges in sensitivity, specificity, and quantification when applying this technique. This guide addresses these specific issues with detailed troubleshooting and methodological support.
The Scientist's Toolkit: Essential Research Reagents
The following table details key reagents and materials critical for successful diGLY proteomics experiments.
Table 1: Key Research Reagents for diGLY Proteomics
| Reagent/Material | Function/Application | Key Considerations |
|---|---|---|
| diGLY Motif-specific Antibody [4] | Immunoaffinity enrichment of diGLY-modified peptides from a complex peptide digest. | Critical for specificity. Commercial kits (e.g., PTMScan) are widely used. Note that it also enriches for identical remnants from NEDD8 and ISG15 [4]. |
| SILAC (Stable Isotope Labeling with Amino acids in Cell culture) Media [4] | Metabolic labeling for accurate quantitative comparison of ubiquitination sites between different cell states (e.g., treated vs. untreated). | Requires dialyzed FBS and heavy isotopes of Lysine (K8) and Arginine (R10) [4]. |
| Strong Denaturing Lysis Buffer (e.g., 8M Urea) [4] | Efficiently extracts and denatures proteins, halting enzymatic activity to preserve the native ubiquitination state. | Essential for deactivating deubiquitinases (DUBs). Must include protease inhibitors and N-Ethylmaleimide (NEM) to inhibit DUBs [4]. |
| LysC and Trypsin Proteases [4] | Sequential enzymatic digestion of proteins to generate peptides for MS analysis. | Trypsin cleavage C-terminal to lysine creates the diagnostic diGLY motif on modified peptides [4]. |
| SepPak tC18 Reverse Phase Column [4] | Desalting and cleaning up peptide digests prior to enrichment and MS analysis. | Improves subsequent enrichment efficiency and protects the LC-MS system from contaminants. |
Core Experimental Protocol: diGLY Proteomics Workflow
The standard workflow for ubiquitinome analysis involves specific steps from cell culture to data acquisition, each critical for reliable results. The following diagram illustrates this process, highlighting key stages where problems frequently occur.
Detailed Methodologies for Key Steps
Cell Culture and Metabolic Labeling (SILAC):
- Culture cells in SILAC "heavy" media (containing 13C6,15N2 L-Lysine-2HCl and 13C6,15N4 L-Arginine-HCl) and "light" media (with normal amino acids) for at least five cell doublings to ensure full incorporation of the labels [4].
- Treat cells according to your experimental design (e.g., with a proteasome inhibitor like MG132 to accumulate ubiquitinated substrates). Combine light and heavy cell pellets in a 1:1 ratio based on protein amount.
Cell Lysis and Protein Extraction:
- Lyse cells in a denaturing lysis buffer (e.g., 8M Urea, 50mM Tris-HCl pH 8, 150mM NaCl) supplemented with complete protease inhibitors and 5mM N-Ethylmaleimide (NEM) [4]. The denaturing conditions and NEM are critical for inactivating deubiquitinating enzymes (DUBs) and preserving the ubiquitination state.
Protein Digestion and Peptide Clean-up:
- Reduce disulfide bonds with DTT and alkylate with iodoacetamide.
- Digest proteins first with LysC (Wako, 0.005AU/μL) for 2-3 hours, then dilute the urea concentration and digest with trypsin (Sigma, TPCK-treated) overnight at 25°C [4].
- Desalt the resulting peptide mixture using a reverse-phase SepPak tC18 cartridge [4].
diGLY Peptide Immunoaffinity Enrichment:
- Use the PTMScan Ubiquitin Remnant Motif (K-Ɛ-GG) Kit or an equivalent diGLY-specific antibody.
- Incubate the desalted peptide sample with the antibody beads. A recommended starting point is 1 mg of peptide material with 31.25 μg of antibody [6].
- Wash the beads thoroughly to remove non-specifically bound peptides. Elute the enriched diGLY peptides with 0.15% trifluoroacetic acid (TFA) [4].
Mass Spectrometry Analysis:
- Analyze the enriched peptides by LC-MS/MS. For maximum coverage and quantitative accuracy, Data-Independent Acquisition (DIA) is now recommended over traditional Data-Dependent Acquisition (DDA). A DIA method with 46 precursor isolation windows and high MS2 resolution (30,000) has been shown to significantly improve results [6].
- DIA requires a project-specific or public spectral library. For the deepest coverage, generate a library by fractionating a representative sample (e.g., via basic reversed-phase chromatography) and analyzing each fraction by DDA [6].
Troubleshooting Guide: Common Issues and Solutions
Table 2: Troubleshooting diGLY Proteomics Experiments
| Problem | Potential Cause | Solution |
|---|---|---|
| Low Number of Identified diGLY Sites | Inefficient enrichment; DUB activity during lysis. | - Confirm lysis includes 8M Urea and fresh NEM [4].- Titrate antibody-to-peptide ratio (use ~31.25 µg antibody per 1 mg peptide) [6].- Pre-fractionate samples before enrichment to reduce complexity [4]. |
| High Background in MS Data | Non-specific binding during enrichment; incomplete digestion. | - Ensure stringent wash steps are performed after antibody incubation.- Validate complete protein digestion by QC (e.g., running a small aliquot on a gel).- Use a tandem His-biotin tag purification strategy to reduce background in tagged-ubiquitin approaches [5]. |
| Poor Quantitative Reproducibility | Technical variation in enrichment; sub-optimal MS acquisition. | - Switch from DDA to a DIA method, which provides higher reproducibility, more complete data, and better quantitative accuracy [6].- Ensure proper mixing of SILAC-labeled samples before combining. |
| DiGLY Peptides Masked by Abundant K48-chain Peptides | Proteasome inhibition leads to massive accumulation of K48-linked polyubiquitin. | - Use basic reversed-phase (bRP) fractionation to separate the highly abundant K48-ubiquitin chain-derived diGLY peptide from the rest of the sample pool before enrichment [6]. |
Frequently Asked Questions (FAQs)
Q1: The diGLY antibody also enriches for peptides modified by NEDD8 and ISG15. How can I be sure I'm studying ubiquitination? While the diGLY remnant is identical for ubiquitin, NEDD8, and ISG15, studies have shown that in typical diGLY enrichment experiments, the vast majority (>95%) of identified peptides originate from ubiquitination [4]. If specific analysis of NEDD8 or ISG15 is required, alternative antibodies or genetic manipulation would be necessary.
Q2: What is the advantage of using Data-Independent Acquisition (DIA) over standard Data-Dependent Acquisition (DDA) for ubiquitinome analysis? DIA provides superior sensitivity, quantitative accuracy, and data completeness. A single DIA measurement can identify over 35,000 distinct diGLY sites—nearly double the amount typically identified with DDA—and demonstrates significantly better reproducibility across replicates [6]. This makes DIA particularly powerful for capturing dynamic changes in ubiquitination in response to stimuli.
Q3: How can I distinguish between ubiquitination sites that target a protein for degradation versus those that have non-proteolytic functions? The functional outcome is largely determined by the type of polyubiquitin chain linkage. While MS identification of the diGLY site itself does not reveal linkage type, specific enrichment strategies using ubiquitin-binding domains (UBDs) that recognize certain linkages (e.g., K48 for degradation, K63 for signaling) can be employed [3] [7]. Furthermore, correlating ubiquitination data with changes in protein abundance (from global proteome analysis) can provide functional clues; a site whose increase correlates with a decrease in the substrate's protein level may be degradation-related.
Q4: Our lab is new to diGLY proteomics. What is the most common pitfall in sample preparation? The most critical step is the immediate and complete inhibition of deubiquitinating enzymes (DUBs) during cell lysis. Failure to do so will result in rapid loss of the ubiquitination signal. Always use a strong denaturing lysis buffer (e.g., 8M Urea) and include specific DUB inhibitors like N-Ethylmaleimide (NEM) to ensure the ubiquitome is preserved as it exists in the living cell [4].
Why Ubiquitination Sites Are Inherently Difficult to Detect by MS
Protein ubiquitination is a fundamental post-translational modification (PTM) that regulates critical cellular processes including protein degradation, signaling, and DNA repair. Despite its biological significance, the precise detection and mapping of ubiquitination sites by mass spectrometry (MS) present substantial technical challenges. This technical support guide examines the inherent difficulties researchers face and provides targeted troubleshooting methodologies to overcome these obstacles in proteomic research and drug development.
The Core Challenges in Ubiquitination Site Detection
Biological and Technical Hurdles
The detection of ubiquitination sites faces significant biological and technical hurdles that complicate MS analysis. These challenges stem from both the natural properties of the modification and limitations in current analytical techniques.
Low Stoichiometry and Abundance: Ubiquitinated proteins typically exist in very low abundance compared to their unmodified counterparts [3] [8]. This creates a "needle in a haystack" scenario where ubiquitinated peptides are masked by abundant non-modified peptides in complex samples, making them difficult to detect without extensive enrichment.
Transient Nature and Lability: Ubiquitination is a highly dynamic and reversible process regulated by deubiquitinating enzymes (DUBs) [8]. During cell lysis and sample preparation, DUBs remain active and can rapidly remove ubiquitin modifications, leading to significant loss of signal before analysis can occur.
Structural Complexity: Ubiquitin can form complex polymeric chains through its own lysine residues, creating diverse chain architectures (homotypic, heterotypic, and branched) with different biological functions [3] [8]. These complex structures generate complicated fragmentation patterns that are difficult to interpret by standard MS/MS approaches.
Substrate Heterogeneity: A single protein substrate can be modified at multiple lysine residues simultaneously (multi-monoubiquitination), and each ubiquitin molecule in a chain contains multiple potential linkage sites (K6, K11, K27, K29, K33, K48, K63, M1) [8]. This heterogeneity significantly increases the analytical complexity compared to simpler PTMs.
Mass Spectrometry-Specific Limitations
Inefficient Ionization and Detection: The addition of the ubiquitin remnant (Gly-Gly modification, +114.04 Da) to lysine residues can alter peptide ionization efficiency in MS analysis [7]. Furthermore, ubiquitinated peptides often exhibit suboptimal fragmentation patterns under standard Collision-Induced Dissociation (CID) conditions, yielding insufficient sequence information for confident site localization [7].
Cross-Talk with Other PTMs: Proteins can be modified by multiple PTMs simultaneously, including phosphorylation, acetylation, and methylation [3] [9]. These competing modifications can sterically hinder ubiquitination sites or create complex spectral signatures that are challenging to decipher, requiring specialized multi-omics approaches for complete characterization.
Troubleshooting Guide: Frequently Asked Questions
FAQ 1: How can I improve the detection of low-abundance ubiquitinated peptides?
Challenge: Ubiquitinated peptides are present in low stoichiometry compared to unmodified peptides, making them difficult to detect without enrichment.
Solution: Implement a multi-dimensional enrichment strategy:
- Immunoaffinity Enrichment: Use anti-K-ε-GG (diGly) remnant antibodies for highly specific enrichment of ubiquitinated peptides after tryptic digestion [10] [11] [12]. Cross-link antibodies to beads to prevent antibody leaching and improve reproducibility.
- Pre-fractionation: Implement offline high-pH reverse-phase chromatography to reduce sample complexity before enrichment [10] [11]. Fractionating peptides into 3-8 fractions prior to diGly enrichment significantly improves depth of coverage.
- Tandem Enrichment: For challenging samples, combine protein-level enrichment (using ubiquitin-binding domains or tagged ubiquitin) with peptide-level diGly enrichment [8].
Protocol: Ubiquitin Remnant Immunoaffinity Profiling
- Lyse cells in denaturing buffer (e.g., 50 mM Tris-HCl with 0.5% sodium deoxycholate) containing 5-10 mM chloroacetamide to inhibit deubiquitinases [12].
- Digest proteins with Lys-C (1:200 ratio) for 4 hours followed by trypsin (1:50 ratio) overnight at 30°C [10].
- Fractionate peptides using high-pH reverse-phase chromatography (pH 10) with stepwise elution (7%, 13.5%, and 50% acetonitrile) [10] [11].
- Enrich diGly-modified peptides using cross-linked anti-K-ε-GG antibody beads.
- Analyze by LC-MS/MS using high-resolution mass spectrometers (Orbitrap platforms recommended) [10] [7].
FAQ 2: What strategies can overcome complex ubiquitin chain architecture?
Challenge: Polyubiquitin chains generate complex fragmentation patterns that complicate site assignment and linkage determination.
Solution: Employ advanced fragmentation techniques and specialized data analysis:
- Alternative Fragmentation Methods: Implement Electron-Transfer/Higher-Energy Collisional Dissociation (EThcD) alongside standard CID to improve fragmentation of modified peptides and facilitate site localization [7].
- Linkage-Specific Reagents: Use ubiquitin-binding domains (UBDs) or linkage-specific antibodies to enrich for particular chain types (e.g., K48- or K63-linked chains) [8].
- Middle-Down/Top-Down Approaches: For characterizing polyubiquitin chain topology, use middle-down (minimal enzymatic digestion) or top-down (intact protein analysis) MS approaches to preserve connectivity information [3] [8].
Protocol: Linkage-Specific Ubiquitin Chain Analysis
- Enrich ubiquitinated proteins using linkage-specific antibodies (e.g., K48- or K63-specific) or tandem ubiquitin-binding entities (TUBEs) [8].
- For middle-down approach: Use limited proteolysis with Glu-C or Asp-N to generate larger ubiquitin-containing fragments that retain linkage information.
- Analyze using LC-MS/MS with alternating CID and HCD fragmentation.
- Utilize specialized software (e.g., MaxQuant, Proteome Discoverer) with custom settings for ubiquitin chain analysis [3].
FAQ 3: How can I prevent loss of ubiquitination during sample preparation?
Challenge: The dynamic nature of ubiquitination leads to rapid deubiquitination during cell lysis and processing.
Solution: Implement rigorous enzyme inhibition and optimized lysis conditions:
- Deubiquitinase Inhibition: Include multiple DUB inhibitors in lysis buffers:
- 5-10 mM N-ethylmaleimide (NEM) or iodoacetamide
- 5 mM chloroacetamide
- 1-5 μM PR-619 (broad-spectrum DUB inhibitor)
- Rapid Denaturation: Use boiling or strong denaturants (e.g., 4-6 M urea, 1-2% SDS) immediately after lysis to inactivate enzymes quickly [10].
- Work Quickly: Process samples rapidly at low temperatures (4°C) to minimize degradation.
Protocol: Preservation of Ubiquitination During Sample Preparation
- Prepare lysis buffer containing 50 mM Tris-HCl (pH 8.2), 0.5% sodium deoxycholate, 5 mM NEM, and 5 mM chloroacetamide [10] [12].
- Aspirate culture media and immediately add pre-heated (95°C) lysis buffer to cells.
- Boil samples for 5 minutes at 95°C to denature proteins and inactivate enzymes.
- Sonicate to reduce viscosity and complete protein extraction.
- Process samples through digestion without intermediate freezing steps.
Experimental Workflow for Robust Ubiquitination Site Identification
This optimized workflow incorporates key troubleshooting strategies to address the major challenges in ubiquitination site detection. The inclusion of DUB inhibitors during lysis preserves modifications, while fractionation and enrichment steps overcome stoichiometry limitations. High-resolution MS instrumentation is essential for confident identification of the diGly remnant and localization of modification sites.
Research Reagent Solutions for Ubiquitination Studies
Table: Essential reagents for ubiquitination site mapping by mass spectrometry
| Reagent Category | Specific Examples | Function & Application |
|---|---|---|
| Enrichment Antibodies | Anti-K-ε-GG (diGly remnant) monoclonal antibody [10] [11] | Immunoaffinity enrichment of ubiquitinated peptides after trypsin digestion |
| Linkage-Specific Reagents | K48-linkage specific antibody, K63-linkage specific antibody [8] | Selective enrichment of ubiquitin chains with specific linkages |
| Ubiquitin-Binding Domains | Tandem Ubiquitin-Binding Entities (TUBEs) [8] | High-affinity enrichment of ubiquitinated proteins at the protein level |
| Deubiquitinase Inhibitors | N-ethylmaleimide (NEM), chloroacetamide, PR-619 [10] [12] | Prevention of deubiquitination during sample preparation |
| Tagged Ubiquitin Systems | His₆-Ubiquitin, Strep-tagged Ubiquitin [8] | Affinity purification of ubiquitinated proteins in engineered cell systems |
| Proteases | Trypsin, Lys-C [10] | Protein digestion generating diGly-modified peptides for detection |
| Quantification Reagents | SILAC amino acids (light/heavy Lys and Arg), TMT isobaric tags [3] [11] | Relative quantification of ubiquitination changes across conditions |
Advanced Methodologies for Specific Challenges
Computational Prediction Tools
Machine learning approaches can complement MS data and guide experimental design:
- UbPred: Random forest-based predictor using sequence and structural features [9]
- DeepUni: Convolutional neural network utilizing multiple sequence features and physicochemical properties [9]
- Hybrid Models: Combine raw amino acid sequences with hand-crafted features for improved accuracy (up to 0.902 F1-score reported) [9]
Quantitative Ubiquitin Profiling
Implement quantitative methods to study ubiquitination dynamics:
- SILAC (Stable Isotope Labeling with Amino Acids in Cell Culture): Metabolic labeling for precise quantification of ubiquitination changes [3] [11]
- TMT (Tandem Mass Tagging): Multiplexed isobaric labeling enabling comparison of up to 16 conditions simultaneously [3]
- Label-Free Quantification: Intensity-based measurement suitable for tissue samples and clinical specimens [3]
The inherent difficulties in detecting ubiquitination sites by mass spectrometry stem from fundamental biological and technical challenges, including low stoichiometry, structural complexity, and dynamic regulation. However, through implementation of the optimized protocols and troubleshooting strategies outlined in this guide - including rigorous deubiquitinase inhibition, multidimensional enrichment, advanced fragmentation techniques, and appropriate computational tools - researchers can overcome these limitations to achieve comprehensive mapping of ubiquitination sites. These methodologies provide the foundation for robust investigation of ubiquitin signaling in both basic research and drug development contexts, enabling deeper understanding of this crucial regulatory mechanism in health and disease.
Protein ubiquitination is a crucial post-translational modification involved in diverse cellular events, but its identification by mass spectrometry (MS) presents significant challenges due to low stoichiometry [8]. In complex biological samples, the abundance of ubiquitinated peptides is very low compared to their non-modified counterparts, making enrichment and sensitive detection difficult [10] [13]. This technical support center provides targeted troubleshooting guides and FAQs to help researchers overcome these specific experimental hurdles in ubiquitination site identification.
Key Challenges & Troubleshooting FAQs
Frequently Asked Questions
Q1: Why is the yield of diGly peptides so low in my ubiquitination experiments, despite starting with ample protein material?
- Potential Cause: Inefficient immunopurification of K-ε-diglycine (diGly) peptides due to non-specific binding or antibody bead loss.
- Solution: Implement a filter-based plug during sample cleanup to better retain antibody beads, which increases specificity for diGly peptides and reduces non-specific binding [10] [13]. Ensure proper washing of beads with PBS before use [10].
Q2: How can I improve the depth of ubiquitinome coverage in complex samples like tissue lysates?
- Potential Cause: Insufficient fractionation prior to enrichment, leading to sample complexity overwhelming the MS detection capacity.
- Solution: Incorporate offline high-pH reverse-phase fractionation of peptides before immunopurification. Crude fractionation into just three fractions (using 7%, 13.5%, and 50% acetonitrile in 10 mM ammonium formate, pH 10) simultaneously desalts and reduces sample complexity, significantly enhancing sensitivity [10] [13].
Q3: What steps can I take to enhance the specificity of diGly peptide enrichment?
- Potential Cause: Co-purification of non-diGly peptides and contaminants.
- Solution: Optimize the antibody-to-bead coupling ratio as per manufacturer guidelines and use strict wash conditions. Avoid deubiquitinase inhibitors like N-ethylmaleimide (NEM) that can introduce unwanted protein modifications and complicate peptide identification [10].
Advanced Troubleshooting
Q4: My mass spectrometry data shows poor fragmentation spectra for diGly peptides. How can I improve this?
- Potential Cause: Suboptimal fragmentation settings in the mass spectrometer.
- Solution: Gain better control of the peptide fragmentation settings in the Orbitrap HCD cell. Using more advanced peptide fragmentation settings in the ion routing multipole significantly improves the quality of MS/MS spectra [10] [13].
Q5: How can I validate ubiquitination sites identified in my SILAC experiments?
- Potential Cause: False positive identifications from non-specific binding or incomplete labeling.
- Solution: Ensure complete labeling by culturing cells for at least six doublings in heavy medium containing lysine-8 (13C6;15N2) and arginine-10 (13C6;15N4). Always mix light and heavy labeled proteins in a 1:1 ratio based on total protein amount determined by a colorimetric absorbance BCA assay [10].
Experimental Workflow & Protocol
Optimized Sample Preparation Protocol
The following workflow has been demonstrated to enable the routine detection of over 23,000 diGly peptides from HeLa cells upon proteasome inhibition [10] [13].
Step 1: Cell Culture and Lysis
- Culture cells in appropriate medium (e.g., DMEM with 10% FBS).
- For SILAC experiments: Use DMEM lacking arginine and lysine, supplemented with dialyzed FBS and either light (normal) or heavy (lysine-8 and arginine-10) amino acids [10].
- Treat cells with proteasome inhibitor (e.g., 10 µM bortezomib) or DMSO control for 8 hours [10].
- Lyse cell pellet in ice-cold 50 mM Tris-HCl (pH 8.2) with 0.5% sodium deoxycholate (DOC) [10].
- Boil lysate at 95°C for 5 minutes and sonicate for 10 minutes at 4°C [10].
Step 2: Protein Digestion
- Quantify protein using BCA assay [10].
- Reduce proteins with 5 mM 1,4-dithiothreitol (30 min, 50°C) [10].
- Alkylate with 10 mM iodoacetamide (15 min, in the dark) [10].
- Digest with Lys-C (1:200 enzyme-to-substrate ratio) for 4 hours [10].
- Follow with tryptic digestion overnight (1:50 enzyme-to-substrate ratio) at 30°C or room temperature [10].
- Acidify with TFA to 0.5% final concentration and centrifuge to remove precipitated detergent [10].
Step 3: Peptide Fractionation
- Use high pH reverse-phase C18 chromatography with polymeric stationary phase material (300 Å, 50 µM) [10].
- Load peptides onto column and wash with 0.1% TFA followed by H₂O [10].
- Elute into three fractions with 10 mM ammonium formate (pH 10) containing 7%, 13.5%, and 50% acetonitrile [10].
- Lyophilize all fractions completely [10].
Step 4: diGly Peptide Immunoprecipitation
- Use ubiquitin remnant motif (K-ε-GG) antibodies conjugated to protein A agarose beads [10].
- Wash beads twice with PBS before use [10].
- Follow manufacturer's recommended batch size definitions to ensure proper antibody-to-bead ratios [10].
Workflow Visualization
Performance Metrics of Optimized Protocol
Table 1: Ubiquitination Site Identification Performance Across Sample Types
| Sample Type | Treatment | Number of diGly Peptides Identified | Key Methodological Improvements |
|---|---|---|---|
| HeLa cells | Proteasome inhibition (10 µM bortezomib) | >23,000 peptides [10] [13] | Offline high-pH fractionation, optimized HCD fragmentation, filter-based cleanup [10] [13] |
| HeLa cells | Untreated (mock with DMSO) | ~10,000 peptides [10] | Offline high-pH fractionation, optimized HCD fragmentation, filter-based cleanup [10] |
| Mouse brain tissue | None | Significant improvement in depth [10] [13] | Method applicable to in vivo tissues, enhanced sensitivity [10] [13] |
Table 2: Critical Methodological Parameters for Optimal Results
| Parameter | Standard Approach | Optimized Protocol | Impact on Sensitivity |
|---|---|---|---|
| Fractionation | Single fraction or no fractionation | High-pH RP into 3 fractions (7%, 13.5%, 50% AcN) [10] | Reduces complexity, enables identification of low-abundance peptides [10] [13] |
| Cleanup | Standard bead handling | Filter plug to retain antibody beads [10] [13] | Increases specificity, reduces non-specific binding [10] [13] |
| MS Fragmentation | Default HCD settings | Optimized settings in ion routing multipole [10] [13] | Improves quality of fragmentation spectra [10] [13] |
| Sample Input | Variable, often lower | Several milligrams of protein [10] | Ensures sufficient diGly peptide material for detection [10] |
The Scientist's Toolkit: Essential Research Reagents
Table 3: Key Reagents for Ubiquitination Site Mapping
| Reagent/Category | Specific Example | Function in Workflow |
|---|---|---|
| Cell Lines | HeLa, U2OS [10] | Model systems for method development and application |
| SILAC Media | DMEM lacking Arg/Lys, supplemented with light/heavy amino acids [10] | Enables quantitative comparison between experimental conditions |
| Lysis Buffer | 50 mM Tris-HCl (pH 8.2), 0.5% sodium deoxycholate [10] | Efficient protein extraction while maintaining ubiquitination state |
| Protease Inhibitors | Bortezomib (proteasome inhibitor) [10] | Enhances detection by accumulating ubiquitinated substrates |
| Digestion Enzymes | Lys-C, Trypsin [10] | Generate diGly-containing peptides from ubiquitinated proteins |
| Fractionation Material | High pH RP C18 chromatography material (300 Å, 50 µM) [10] | Reduces sample complexity prior to immunopurification |
| Enrichment Antibodies | Ubiquitin remnant motif (K-ε-GG) antibodies [10] | Immunopurification of diGly peptides from complex mixtures |
| MS Instrumentation | Orbitrap with HCD cell [10] [13] | High-sensitivity detection and identification of diGly peptides |
Addressing the challenge of low stoichiometry in ubiquitination site mapping requires a comprehensive strategy targeting each step of the workflow. Through optimized sample preparation, strategic fractionation, improved cleanup methods, and advanced mass spectrometry techniques, researchers can significantly enhance the depth and reliability of ubiquitinome analyses. The troubleshooting guides and optimized protocols provided here offer practical solutions to the most common experimental hurdles faced in this technically demanding field.
Deubiquitinating Enzyme (DUB) Activity and Sample Degradation
The identification of ubiquitination sites by mass spectrometry (MS) is a cornerstone of proteomics research, enabling the deciphering of critical regulatory mechanisms in cellular processes. However, the inherent enzymatic activity of deubiquitinating enzymes (DUBs) presents a significant technical challenge, often leading to the premature removal of ubiquitin marks and compromising experimental integrity. DUBs are a large family of proteases, with nearly 100 members in humans, responsible for cleaving ubiquitin from modified proteins [14] [15]. This technical support document outlines the mechanisms of DUB-mediated sample degradation and provides validated troubleshooting methodologies to preserve ubiquitin signatures for robust and reproducible mass spectrometry analysis.
Understanding Your Adversary: The Biology and Mechanism of DUBs
What are Deubiquitinating Enzymes (DUBs)?
Deubiquitinating enzymes are a critical component of the ubiquitin-proteasome system (UPS), functioning as the primary antagonists of ubiquitin signaling. They are proteases that catalyze the cleavage of ubiquitin from protein substrates and ubiquitin precursors [14] [15]. The human genome encodes approximately 100 DUB genes, which are classified into two major mechanistic classes and several families [14] [16]:
- Cysteine Proteases: This class includes:
- Ubiquitin-Specific Proteases (USPs)
- Ubiquitin C-Terminal Hydrolases (UCHs)
- Ovarian Tumor Proteases (OTUs)
- Machado-Josephin Domain Proteases (MJDs)
- MOTU Interacting with Ub-containing Novel DUB Family (MINDYs)
- Metalloproteases: This class contains the JAB1/MPN/MOV34 (JAMM) domain proteases.
The catalytic activity of DUBs relies on specific active site residues. Cysteine proteases use a catalytic cysteine residue in a dyad or triad to perform a nucleophilic attack on the isopeptide bond, while JAMM metalloproteases coordinate a zinc ion to activate a water molecule for hydrolysis [15].
How Do DUBs Compromise Ubiquitination Site Mapping?
During sample preparation for MS, the natural balance of the ubiquitin system is disrupted. Cell lysis releases active DUBs, which, without proper inhibition, will rapidly deubiquitinate substrates. The consequences are severe [5] [17]:
- Loss of Ubiquitin Signal: The primary ubiquitin modification on the substrate protein is removed, erasing the signal you intend to measure.
- Altered Ubiquitin Chain Architecture: Polyubiquitin chains of specific linkages (e.g., K48, K63) can be disassembled, destroying information about the functional consequence of the modification.
- Introduction of Artifacts: Inefficient or promiscuous DUB activity can generate incomplete or aberrant ubiquitin remnants, complicating data interpretation.
The diagram below illustrates how DUBs actively reverse the ubiquitination process, directly attacking the isopeptide bond that mass spectrometry aims to detect.
Diagram 1: DUB-Mediated Deubiquitination. This figure shows the core problem: DUB enzymes recognize and cleave the isopeptide bond between a substrate protein and ubiquitin, reversing the post-translational modification.
Frequently Asked Questions (FAQs) and Troubleshooting Guide
FAQ 1: My ubiquitin signal is weak or absent in my MS data, even with enrichment. What is the most likely cause?
This is a classic symptom of DUB activity during sample preparation. DUBs remain active after cell lysis and can efficiently remove ubiquitin from your substrates before they can be captured and identified. The solution requires a multi-pronged approach focusing on rapid inhibition.
Troubleshooting Steps:
- Immediate Inhibition: Add a pan-DUB inhibitor (e.g., N-Ethylmaleimide (NEM) or Iodoacetamide (IAA)) directly to your lysis buffer. Ensure your lysis buffer is at a denaturing strength (e.g., containing 8 M Urea or 1-2% SDS) to inactivate DUBs and other proteases physically [17] [18].
- Thermal Denaturation: For critical samples, consider a rapid heat denaturation step immediately after lysis to irreversibly denature DUBs.
- Check Inhibitor Efficacy: Verify the concentration and freshness of your DUB inhibitors. NEM and IAA are light-sensitive and can degrade in solution.
FAQ 2: I see high levels of free ubiquitin and a low ratio of ubiquitin conjugates in my Western blots. Is this related to DUBs?
Yes, this is a strong indicator of DUB activity. DUBs not only remove ubiquitin from substrates but are also responsible for processing ubiquitin precursors (like polyubiquitin genes) and recycling ubiquitin from chains. Excessive activity during sample prep will artificially increase free ubiquitin levels and decrease the conjugate population you wish to study [15].
Troubleshooting Steps:
- Use Denaturing Purification: When using tagged-ubiquitin systems (e.g., His-tag), perform purifications under fully denaturing conditions (e.g., with 8 M Urea or Guanidine HCl) to dissociate non-covalent interactions and inactivate DUBs [5] [17].
- Include Chelating Agents: For JAMM family metalloprotease DUBs, include metal chelators like EDTA or 1,10-Phenanthroline in your buffers, as these DUBs are zinc-dependent [19].
FAQ 3: How can I be sure my DUB inhibition strategy is working?
The most direct way is to monitor the accumulation of polyubiquitinated proteins.
Validation Protocol:
- Step 1: Prepare two aliquots of the same cell sample.
- Step 2: Lyse one sample with your optimized, inhibitor-containing denaturing buffer. Lyse the other with a mild, non-denaturing buffer without inhibitors.
- Step 3: Perform a Western blot for ubiquitin on both samples.
- Step 4: Compare the smearing pattern indicative of polyubiquitinated proteins. A strong, high-molecular-weight smear in the denaturing/inhibitor sample versus a weak smear and more free ubiquitin in the non-denaturing sample confirms successful DUB inhibition [20].
Research Reagent Solutions: A Toolbox for Combating Sample Degradation
The following table summarizes key reagents essential for preventing DUB-mediated sample degradation in ubiquitination studies.
Table 1: Essential Reagents for DUB Inhibition in Ubiquitin MS Workflows
| Reagent | Function/Mechanism | Example Usage in Protocol |
|---|---|---|
| N-Ethylmaleimide (NEM) | Irreversible, cysteine-alkylating agent that inhibits cysteine protease DUBs. | Add 10-50 mM to lysis buffer immediately before use [18]. |
| Iodoacetamide (IAA) | Cysteine-alkylating agent; commonly used for alkylation in MS sample prep but also inhibits DUBs. | Use at 10-20 mM in lysis or denaturing buffers [17]. |
| PR-619 | A broad-spectrum, cell-permeable DUB inhibitor. Useful for pre-treating cells before lysis. | Treat cells at 10-50 µM for several hours before harvesting [19]. |
| Ubiquitin Aldehydes | Mechanism-based inhibitors that form a thiohemiacetal with the active site cysteine of DUBs. | Can be added to lysis buffers at low micromolar concentrations. |
| EDTA / EGTA | Chelators of divalent cations; inhibit zinc-dependent JAMM metalloprotease DUBs. | Include at 1-10 mM in all non-metal-requiring buffers [19]. |
| Urea / Guanidine HCl | Denaturants that disrupt protein structure, inactivating all classes of DUBs. | Use at 6-8 M Urea or 4-6 M GuHCl in lysis and initial wash buffers [5] [17]. |
| His-Biotin Tandem Tag | Affinity tags for ubiquitin, enabling purification under fully denaturing conditions. | Critical for specific enrichment of ubiquitinated conjugates away from DUBs and other interfering proteins [5] [18]. |
Optimized Experimental Protocol for DUB-Free Sample Preparation
This protocol is designed for the identification of ubiquitination sites from mammalian cells via immunoaffinity or tandem ubiquitin-binding entity (TUBE)-based enrichment, followed by mass spectrometry.
Diagram 2: Secure Ubiquitin Sample Prep Workflow. This optimized workflow emphasizes DUB inhibition from the moment of cell lysis through to digestion, ensuring the preservation of ubiquitin modifications.
Step-by-Step Methodology
Step 1: Cell Harvest and Lysis under Denaturing Conditions
- Pre-chill all equipment and buffers on ice.
- Prepare Fresh Lysis Buffer:
- 8 M Urea in PBS or 50 mM Tris-HCl (pH 8.0)
- 10-50 mM N-Ethylmaleimide (NEM) or 10-20 mM Iodoacetamide
- 5-10 mM EDTA (to inhibit metallo-DUBs)
- 1x Protease Inhibitor Cocktail (without EDTA if using it separately)
- Note: NEM and IAA are incompatible with DTT or β-mercaptoethanol. Add these inhibitors fresh and avoid reducing agents at this stage.
- Lyse Cells: Aspirate culture media and immediately add ice-cold denaturing lysis buffer to the cells. Scrape and transfer the lysate to a microcentrifuge tube.
- Vortex vigorously and incubate on ice for 15-30 minutes.
- Clarify Lysate: Centrifuge at 16,000-20,000 x g for 15 minutes at 4°C. Transfer the supernatant to a new tube [17] [18].
Step 2: Protein Extraction, Reduction, and Alkylation
- Determine Protein Concentration using a compatible assay (e.g., BCA).
- Reduce Proteins: Add DTT to a final concentration of 5-10 mM and incubate at 56°C for 30 minutes. This step can now be performed as the DUBs are already denatured and inhibited.
- Alkylate Proteins: Add Iodoacetamide to a final concentration of 15-20 mM (if not already in the lysis buffer) and incubate for 30 minutes at room temperature in the dark. This alkylates cysteine residues to prevent reformation of disulfide bonds.
- Quench Alkylation: If IAA was not in the lysis buffer, add DTT to a final concentration of 10 mM to quench any excess IAA.
Step 3: Enrichment of Ubiquitinated Proteins This step can be performed using anti-ubiquitin antibodies, TUBEs, or tagged-ubiquitin systems (e.g., FLAG, HA, His). The following is a general outline for immunoaffinity enrichment:
- Dilute Lysate: If necessary, dilute the urea concentration to below 2 M using PBS or a compatible buffer to prevent interference with antibody binding.
- Pre-clear Lysate: Incubate with control beads (e.g., Protein A/G) for 1 hour at 4°C to remove non-specifically binding proteins.
- Immunoprecipitation: Incubate the pre-cleared lysate with antibody-conjugated beads overnight at 4°C.
- Wash Beads: Perform a series of stringent washes (e.g., with 1-2 M Urea-containing buffers, high-salt buffers) to remove non-specifically bound proteins [5] [17].
Step 4: On-Bead Digestion and Peptide Cleanup
- Wash Beads with 50 mM Ammonium Bicarbonate (ABC) pH 8.0 to remove detergents and salts.
- Digest Proteins: Resuspend beads in 50 mM ABC with Trypsin (1:50 enzyme-to-protein ratio) and incubate overnight at 37°C with shaking.
- Acidify and Collect Peptides: Stop the digestion by adding Trifluoroacetic Acid (TFA) to a final concentration of 0.5-1%. Collect the supernatant containing the peptides.
- Desalt Peptides using C18 solid-phase extraction tips or columns before LC-MS/MS analysis [5] [17].
Step 5: LC-MS/MS Analysis and Data Interrogation
- Analyze the peptides using a nano-flow LC system coupled to a high-resolution tandem mass spectrometer.
- For database searching, enable the "GlyGly (K)" remnant as a variable modification (+114.04293 Da on lysine). This is the signature tryptic remnant left on a lysine that was modified by ubiquitin [5] [17].
- Utilize the appropriate software to filter for high-confidence spectra and localize the ubiquitination sites.
Polyubiquitin Chain Complexity and Linkage Ambiguity
Protein ubiquitination is a pivotal post-translational modification that regulates nearly all cellular processes in eukaryotes, including protein degradation, cellular signaling, and protein turnover [3] [1]. This modification involves the covalent attachment of ubiquitin—a small 76-amino acid protein—to lysine residues on target proteins [8]. The versatility of ubiquitination arises from its ability to form diverse architectures, including monoubiquitination, multi-monoubiquitination, and various polyubiquitin chains that differ in length and linkage types [1] [8].
A central challenge in ubiquitination research lies in the inherent complexity of polyubiquitin signals. Ubiquitin itself contains seven lysine residues (K6, K11, K27, K29, K33, K48, K63) and one N-terminal methionine (M1), each capable of forming distinct polyubiquitin chain linkages [8]. These different linkages can function as distinct molecular codes, with K48-linked chains typically targeting substrates for proteasomal degradation, while K63-linked chains are often involved in non-proteolytic functions like signaling and trafficking [3] [8]. The situation is further complicated by the existence of mixed linkage chains, branched ubiquitin chains, and additional modifications on ubiquitin itself, such as phosphorylation and acetylation [21] [8].
For researchers studying ubiquitination, linkage ambiguity presents a significant experimental hurdle. Traditional methods often struggle to differentiate between these various chain architectures, creating a bottleneck in deciphering the precise molecular mechanisms underlying ubiquitin signaling in both health and disease states [21] [8]. This technical support article addresses these challenges by providing targeted troubleshooting guidance for researchers encountering linkage ambiguity during mass spectrometry-based ubiquitination studies.
Frequently Asked Questions (FAQs)
Q1: Why can't I identify the specific ubiquitin chain linkages on my protein of interest using standard mass spectrometry approaches?
- A: Standard shotgun proteomics approaches excel at identifying ubiquitinated proteins but often fail to resolve specific ubiquitin chain linkages. This limitation stems from several factors:
- Low Stoichiometry: Ubiquitinated forms of proteins typically represent a very small fraction of the total cellular pool of that protein [8].
- Signal Suppression: In complex mixtures, signals from non-modified peptides can suppress the detection of lower-abundance ubiquitinated peptides [3].
- Complex Fragmentation: Polyubiquitin chains generate complex fragmentation patterns that are difficult to interpret with standard database search algorithms, especially for branched or atypical linkages [21].
Q2: My ubiquitination site mapping data is inconsistent between biological replicates. What could be causing this variability?
- A: Inconsistent site identification often results from:
- Incomplete Enrichment: Variations in the efficiency of immunoprecipitation or affinity-based enrichment of ubiquitinated peptides between experiments [3] [8].
- Dynamic Turnover: The ubiquitination landscape is highly dynamic. Differences in cell state, stress responses, or confluency at the time of harvesting can alter ubiquitination patterns [22].
- Sample Processing Artifacts: Inadequate inhibition of deubiquitinases (DUBs) during cell lysis can lead to rapid removal of ubiquitin signals, while prolonged processing can introduce non-specific modifications [8].
Q3: How can I distinguish between degradation-targeted ubiquitination (e.g., K48-linked) and non-degradation ubiquitination (e.g., K63-linked) on my substrate?
- A: Several specialized methods can address this:
- Linkage-Specific Reagents: Utilize linkage-specific ubiquitin-binding domains (UBDs) or antibodies (e.g., K48- or K63-specific) for enrichment prior to MS analysis [23] [8].
- Functional Assays with Proteasome Inhibition: Treat cells with a proteasome inhibitor (e.g., MG132) and monitor changes in protein abundance and ubiquitin occupancy. An increase in both ubiquitin occupancy and total protein levels suggests a degradation-targeted signal [22].
- Advanced MS Techniques: Employ methodologies like Ub-clipping or middle-down MS that are specifically designed to characterize polyubiquitin chain topology and linkage [21].
Troubleshooting Guides
Problem: Inability to Detect Polyubiquitin Chain Linkages
Specific Error: Mass spectrometry data identifies ubiquitinated proteins but provides no information on chain linkage type or architecture.
Solutions:
- Implement Linkage-Specific Enrichment:
- Protocol: Use tandem ubiquitin-binding entities (TUBEs) or linkage-specific monoclonal antibodies (e.g., FK2 for pan-ubiquitin, or K48/K63-specific antibodies) for affinity purification. Incubate cell lysates with these reagents for 2-4 hours at 4°C, followed by extensive washing under native or mildly denaturing conditions to isolate ubiquitinated proteins with specific chain types [23] [8].
- Rationale: These reagents provide selectivity for particular ubiquitin linkages, reducing complexity and enriching for chains of interest before MS analysis.
- Adopt Advanced MS Methodologies:
- Ub-clipping Protocol: Engineer the viral protease Lbpro* to selectively cleave ubiquitin, leaving a di-glycine (GlyGly) remnant on the modified lysine. This simplifies the direct assessment of ubiquitination on substrates and within polyubiquitin chains. For branched chains, monoubiquitin generated by Lbpro* retains GlyGly-modified residues, enabling quantification of branch points [21].
- Middle-Down Mass Spectrometry: Analyze larger ubiquitin chain fragments (e.g., ~10-20 kDa) using high-resolution mass spectrometers. This approach preserves connectivity information and allows for direct characterization of chain topology and mixed linkages within a single polymer [21].
Problem: Low Yield of Ubiquitinated Peptides After Enrichment
Specific Error: Poor recovery of ubiquitinated peptides following anti-K-ε-GG antibody enrichment, leading to limited site identification.
Solutions:
- Optimize Enrichment Conditions:
- Protocol: Divide the peptide sample into multiple sub-fractions and incubate each with fresh anti-K-ε-GG antibody resin for 2 hours at 4°C with rotation. Pool the extracted ubiquitinated peptides after enrichment. Pre-clear lysates with protein A/G beads to reduce non-specific binding [22] [8].
- Troubleshooting Tips: Include a positive control (e.g., a synthetic GG-modified peptide) to monitor enrichment efficiency. Ensure the use of fresh protease and deubiquitinase inhibitors throughout sample preparation to prevent ubiquitin removal.
- Utilize Tandem Enrichment Strategies:
- Protocol: Combine two orthogonal enrichment methods. First, purify ubiquitinated proteins under denaturing conditions using His-tagged ubiquitin and nickel chromatography. Then, digest the enriched proteins and perform a second enrichment step at the peptide level using anti-K-ε-GG antibodies [8] [5].
- Rationale: This two-step process significantly reduces sample complexity and non-specific binders, thereby increasing the relative abundance of ubiquitinated peptides and improving detection sensitivity.
Problem: Difficulty Distinguishing Degradation vs. Signaling Ubiquitination
Specific Error: Successful identification of ubiquitination sites but inability to determine their functional consequences.
Solutions:
- Quantitative Proteomics with Proteasome Inhibition:
- Protocol: Implement a SILAC (Stable Isotope Labeling by Amino Acids in Cell Culture) experiment. Treat "heavy"-labeled cells with a proteasome inhibitor (e.g., 20 μM MG132 for 6 hours) while maintaining "light"-labeled cells as a control. Mix lysates in a 1:1 ratio, enrich for ubiquitinated peptides, and analyze by LC-MS/MS. Monitor changes in both protein abundance (degradation signal) and ubiquitin occupancy at specific sites [22].
- Data Interpretation: Substrates targeted for degradation will show increased ubiquitin occupancy at specific sites and increased total protein abundance upon proteasome inhibition. Non-degradation ubiquitination will show stable or decreased ubiquitin occupancy without significant changes in protein abundance [22].
Key Experimental Protocols
Ub-clipping for Chain Architecture Analysis
Purpose: To directly decipher polyubiquitin chain topology, including branched chains, which represent 10-20% of cellular ubiquitin polymers [21].
Step-by-Step Workflow:
- Sample Preparation: Prepare cell lysates under denaturing conditions (e.g., 8M urea) to preserve ubiquitin chains and inhibit DUBs.
- Protease Cleavage: Incubate lysates with engineered Lbpro* protease (1:50 enzyme-to-substrate ratio) for 2 hours at 37°C. Lbpro* incompletely removes ubiquitin, leaving the signature C-terminal GlyGly dipeptide on modified residues.
- Peptide Digestion: Digest the sample with trypsin overnight at 25°C using a 1:50 enzyme-to-substrate ratio.
- Mass Spectrometry Analysis: Desalt peptides and analyze by high-resolution tandem MS. Identify GlyGly-modified lysine residues within ubiquitin itself to map inter-ubiquitin linkages.
- Data Interpretation: Use software to identify branched ubiquitin chains by detecting multiple GlyGly-modified lysines on a single ubiquitin molecule.
Troubleshooting Notes:
- Incomplete Cleavage: Optimize Lbpro* concentration and incubation time. Include a control ubiquitin substrate to verify cleavage efficiency.
- Low Signal: Pre-enrich ubiquitinated proteins using TUBEs prior to Ub-clipping to increase target abundance.
SILAC-Based Quantification of Ubiquitin Occupancy
Purpose: To quantitatively measure changes in ubiquitination stoichiometry at specific sites in response to cellular perturbations [22].
Step-by-Step Workflow:
- Metabolic Labeling: Culture two populations of cells in "light" (normal Lys/Arg) and "heavy" (13C6 15N4-Arg and 13C6-Lys) SILAC media for at least 6 cell doublings.
- Treatment: Expose the "heavy" cells to an experimental condition (e.g., proteasome inhibition with 20 μM MG132 for 6 hours), while "light" cells serve as control.
- Cell Lysis and Mixing: Lyse cells in 8M urea buffer, measure protein concentration, and combine heavy and light lysates in a 1:1 ratio.
- Reduction and Alkylation: Reduce proteins with 10 mM TCEP for 1 hour at 37°C, then alkylate with 12 mM iodoacetamide for 30 minutes at room temperature.
- Trypsin Digestion: Dilute urea concentration to 1M and digest with trypsin overnight at 25°C.
- Ubiquitin Remnant Enrichment: Enrich for K-ε-GG-modified peptides using anti-GG remnant motif antibody resin.
- LC-MS/MS Analysis: Analyze enriched peptides by liquid chromatography coupled to tandem mass spectrometry.
- Data Analysis: Use quantitative software (e.g., MaxQuant) to calculate heavy:light ratios for both modified peptides (ubiquitin occupancy) and protein abundance.
Research Reagent Solutions
Table 1: Essential Research Reagents for Ubiquitination Studies
| Reagent Category | Specific Examples | Function & Application | Key Considerations |
|---|---|---|---|
| Enrichment Tools | Anti-K-ε-GG Antibody [22] | Immunoaffinity enrichment of ubiquitinated peptides for MS | High specificity crucial; optimize binding conditions |
| Tandem Ubiquitin Binding Entities (TUBEs) [23] [8] | High-affinity purification of polyubiquitinated proteins | Broad specificity; preserves ubiquitin signals from DUBs | |
| Linkage-Specific Antibodies (K48, K63) [8] | Selective isolation of chains with specific linkages | Variable specificity; requires validation for each application | |
| Enzymatic Tools | Lbpro* Protease [21] | Ub-clipping methodology for chain architecture analysis | Engineered for specific cleavage; reveals branching |
| Deubiquitinase (DUB) Inhibitors [8] | Preserve ubiquitin signals during sample preparation | Essential in lysis buffer to prevent signal loss | |
| Proteomic Standards | SILAC Amino Acids (13C6 15N4-Arg, 13C6-Lys) [22] | Metabolic labeling for quantitative ubiquitin occupancy | Ensure full incorporation (>98%) for accurate quantification |
| Tandem Mass Tag (TMT) Reagents [3] | Multiplexed quantification of ubiquitination sites | Enables comparison of multiple conditions in one experiment | |
| Affinity Tags | His-Tagged Ubiquitin [8] [5] | Purification of ubiquitinated conjugates under denaturing conditions | May not fully mimic endogenous ubiquitin |
| Strep-Tagged Ubiquitin [8] | Alternative affinity purification with high specificity | Less non-specific binding compared to His-tag |
Navigating the complexity of polyubiquitin chains and overcoming linkage ambiguity requires a sophisticated toolkit of biochemical and mass spectrometry techniques. By implementing the troubleshooting strategies, optimized protocols, and reagent solutions outlined in this guide, researchers can significantly enhance their ability to decipher the ubiquitin code. The key to success lies in selecting the appropriate enrichment strategy, employing quantitative methods to understand functional consequences, and utilizing cutting-edge techniques like Ub-clipping to unravel the architectural complexity of polyubiquitin signals. As these methodologies continue to evolve, they will undoubtedly yield deeper insights into the multifaceted roles of ubiquitination in health and disease, ultimately paving the way for novel therapeutic interventions targeting the ubiquitin-proteasome system.
Distinguishing Ubiquitination from NEDD8 and ISG15 Modifications
A central challenge in proteomics research is the accurate identification of specific post-translational modifications (PTMs) amidst complex cellular signaling networks. Ubiquitination, along with ubiquitin-like modifiers NEDD8 and ISG15, plays crucial roles in regulating protein stability, function, and cellular signaling pathways. The significant structural and biochemical similarities between these modification systems create a persistent identification challenge for researchers [24] [25].
The fundamental issue stems from a shared tryptic signature. When ubiquitinated proteins are digested with trypsin, the C-terminal glycine residues of ubiquitin remain attached to the modified lysine residue, producing a Lys-ε-Gly-Gly (K-ε-GG) remnant on the substrate peptide [26] [10]. Crucially, NEDD8 and ISG15 also generate this identical K-ε-GG signature upon tryptic digestion because they share the same C-terminal di-glycine motif [26] [27]. This makes these three distinct PTMs indistinguishable in standard mass spectrometry workflows that rely on K-ε-GG antibody enrichment.
Table 1: Key Characteristics of Ubiquitin and Ubiquitin-Like Modifiers
| Feature | Ubiquitin | NEDD8 | ISG15 |
|---|---|---|---|
| Size | 76 amino acids | 81 amino acids | 165 amino acids (two Ub-like domains) |
| C-terminal Motif | LRLRGG | LRGG | LRLRGG |
| Tryptic Remnant | K-ε-GG | K-ε-GG | K-ε-GG |
| Primary Functions | Protein degradation, signaling | CRL activation, regulation | Antiviral response, inflammation |
| Estimated % of K-ε-GG Sites | >94% [26] | Minor contributor | Minor contributor |
Biochemical Separation Strategies
Genetic and Molecular Tools for Differentiation
While antibodies cannot distinguish the K-ε-GG remnants from different Ub/UbLs, several genetic and molecular approaches enable specific isolation of each modification type:
Tagged Ubiquitin System: Express affinity-tagged ubiquitin (e.g., His-, HA-, or Strep-tagged) in cells to specifically purify ubiquitinated substrates. The StUbEx (Stable Tagged Ubiquitin Exchange) system replaces endogenous ubiquitin with tagged versions, allowing selective enrichment of ubiquitinated proteins without contamination from NEDD8/ISG15 modified proteins [8].
Linkage-Specific Antibodies: Utilize antibodies that recognize specific ubiquitin chain linkages (K48, K63, M1, etc.) rather than the K-ε-GG remnant. These can confirm genuine ubiquitination events, as NEDD8 and ISG15 form different chain architectures [8].
ISG15 System Manipulation: For identifying ISG15-specific modifications, employ Ube1L knockout cell lines (lacking the ISG15 E1 enzyme) or use lysine-free ubiquitin mutants (UBB+1 K0) to distinguish ISG15-ubiquitin mixed chains [27].
Proteomic and Enrichment Techniques
Advanced proteomic methods can further refine PTM identification:
Tandem Ubiquitin Binding Entities (TUBEs): These engineered molecules with multiple ubiquitin-binding domains show high affinity for polyubiquitin chains over monoubiquitination or other UbLs, enabling preferential enrichment of ubiquitinated proteins [8].
Chain Linkage Analysis: Since NEDD8 primarily modifies cullin proteins and ISG15 shows preference for specific ubiquitin lysines (particularly K29), mapping modification sites can provide clues to the modifying protein [27].
Cross-linking Enhancement: Chemical cross-linking of anti-K-ε-GG antibodies to beads reduces antibody leaching and contamination, improving enrichment specificity for all GG-modified peptides while maintaining compatibility with subsequent differentiation methods [26].
Experimental Design & Workflow
The following diagram illustrates a comprehensive experimental strategy for distinguishing ubiquitination from NEDD8 and ISG15 modifications:
Diagram: Experimental workflow for distinguishing ubiquitin-like modifications. The yellow nodes represent core MS steps, green nodes show differentiation strategies, and red nodes indicate final modification assignments.
Step-by-Step Protocol for Ubiquitinome Analysis
The following protocol is adapted from large-scale ubiquitination identification methods [26] [10]:
Sample Preparation (Days 1-2)
- Lyse cells or tissue in fresh urea lysis buffer (8 M urea, 50 mM Tris HCl pH 8.0, 150 mM NaCl) supplemented with protease inhibitors and deubiquitinase inhibitors (e.g., PR-619)
- Reduce proteins with 5 mM DTT (30 min, 50°C) and alkylate with 10 mM iodoacetamide (15 min, dark)
- Digest with Lys-C (1:200 enzyme:substrate, 4 h) followed by trypsin (1:50, overnight, 30°C)
Peptide Fractionation (Day 3)
- Use high pH reverse-phase chromatography for offline fractionation
- Elute peptides with 10 mM ammonium formate (pH 10) with increasing acetonitrile concentrations (7%, 13.5%, 50%)
- Lyophilize fractions completely
K-ε-GG Peptide Enrichment (Day 4)
- Cross-link anti-K-ε-GG antibody to protein A agarose beads using dimethyl pimelimidate
- Incubate peptide fractions with cross-linked antibodies (2-4 h, 4°C)
- Wash beads extensively with PBS and elute with 0.1-0.2% TFA
Mass Spectrometry Analysis (Day 5)
- Analyze enriched peptides by LC-MS/MS using high-resolution Orbitrap instruments
- Use advanced fragmentation methods (HCD with stepped collision energies)
- Search data against protein databases including Ub/UbL sequences
Troubleshooting Common Experimental Issues
Frequently Asked Questions
Table 2: Troubleshooting Guide for Ubiquitin/Like Modifications Research
| Problem | Possible Causes | Solutions |
|---|---|---|
| Low K-ε-GG peptide recovery | Inefficient antibody enrichment; Insufficient starting material | Cross-link antibody to beads; Increase protein input to 10-20 mg; Include positive controls [26] |
| No peaks in MS data | Column cracks; Detector issues; Sample preparation failure | Check MS system for leaks; Verify syringe function; Ensure proper sample preparation [28] |
| Cannot distinguish Ub vs. UbL modifications | Reliance solely on K-ε-GG enrichment | Implement tagged ubiquitin systems; Use linkage-specific antibodies; Employ genetic knockout lines [27] [8] |
| High background in enrichments | Non-specific antibody binding; Antibody leaching | Optimize wash stringency; Use cross-linked antibodies; Include control IgG enrichments [26] |
| Inconsistent results between replicates | Variable digestion efficiency; Protease instability | Standardize digestion protocols; Use fresh protease inhibitors; Control reaction temperature [10] |
Q: What percentage of K-ε-GG identifications typically represent genuine ubiquitination versus NEDD8 or ISG15 modifications?
A: In HCT116 cells, experiments have demonstrated that >94% of K-ε-GG sites result from ubiquitination, with NEDD8ylation and ISG15ylation constituting minor contributors [26]. However, this distribution can vary significantly under specific conditions, such as interferon stimulation which dramatically upregulates ISG15 expression.
Q: How can we specifically identify hybrid ubiquitin-ISG15 chains?
A: Research has revealed that ISG15 modifies ubiquitin primarily at Lys29 [27]. To identify these hybrid chains:
- Express tagged ISG15 with wild-type ubiquitin
- Use ubiquitin mutants (K29R) to confirm specificity
- Employ Ube1L knockout cells to verify ISG15 dependence
- Look for characteristic mass shifts corresponding to both modifications
Q: What controls should be included to validate ubiquitination-specific signals?
A: Implement a multi-layered control strategy:
- Genetic controls: Use cells expressing tagged ubiquitin versus tagged NEDD8/ISG15
- Enzymatic controls: Treat samples with linkage-specific DUBs
- Negative controls: Perform immunoprecipitations with isotype control antibodies
- Pharmacological controls: Use proteasome inhibitors (bortezomib) to accumulate ubiquitinated substrates [10]
Essential Research Reagents and Tools
Table 3: Key Research Reagents for Ubiquitin/UbL Differentiation
| Reagent/Tool | Function | Application Notes |
|---|---|---|
| Anti-K-ε-GG Antibody | Enriches tryptic peptides with diGly remnant | Does not distinguish Ub/UbLs; Cross-link to beads to reduce contamination [26] |
| Linkage-Specific Ub Antibodies | Recognizes specific ubiquitin chain linkages | Confirms genuine ubiquitination; Available for K48, K63, M1 linkages [8] |
| Tagged Ubiquitin (His/Strep) | Selective ubiquitinome isolation | StUbEx system allows replacement of endogenous ubiquitin [8] |
| Proteasome Inhibitors | Stabilizes ubiquitinated proteins | Bortezomib (10 μM, 8h treatment) increases ubiquitinome depth [10] |
| UBE1L Knockout Cells | Eliminates ISG15 conjugation | Controls for ISG15-specific modifications [27] |
| TUBEs (Tandem Ubiquitin Binding Entities) | High-affinity ubiquitin chain enrichment | Prefers polyubiquitin over other UbLs; Reduces substrate degradation [8] |
Accurately distinguishing ubiquitination from NEDD8 and ISG15 modifications remains technically challenging but essential for understanding the nuanced regulation of cellular processes. While the shared K-ε-GG signature complicates direct discrimination, integrated methodological approaches combining genetic tools, biochemical enrichment, and advanced proteomics can successfully resolve these distinct modification events.
Future methodological developments will likely focus on creating modification-specific antibodies or exploiting structural differences in the protein-modifier interfaces for more straightforward differentiation. Additionally, the emerging understanding of mixed chain architectures and their biological functions highlights the need for more sophisticated analytical tools that can decipher the complex language of ubiquitin and ubiquitin-like signaling in cellular regulation and disease pathogenesis.
Selecting and Implementing the Right Enrichment and MS Strategy
Comparative Analysis of Primary Enrichment Techniques
This technical support center provides focused troubleshooting guides and FAQs for researchers identifying ubiquitination sites by mass spectrometry. The content is framed within a broader thesis on troubleshooting this complex process, addressing specific challenges in enrichment techniques to improve data quality and reliability.
FAQs and Troubleshooting Guides
Q1: My ubiquitination site identification experiment yielded very few diGly peptides. What could be the cause?
A: Low diGly peptide recovery can stem from several issues:
- Insufficient Protein Input: Ensure you use at least 1 mg of total protein input for enrichment experiments to detect low-abundance ubiquitination events [29].
- Sample Degradation: Add broad-spectrum protease inhibitor cocktails (aspartic, serine, and cysteine protease inhibitors) to all buffers during sample preparation. Use EDTA-free cocktails; PMSF is recommended [30].
- Antibody Enrichment Efficiency: Verify cross-linking of K-ε-GG antibody to beads and optimize binding conditions. Without enrichment, typically only 100-150 low-abundance diGly peptides are identifiable from whole cell lysates [29].
- Peptide Loss: Routinely monitor each experimental step by Western Blot or Coomassie staining to track sample integrity [30].
Q2: How can I improve the specificity of my ubiquitinome analysis?
A: Implement these protocol improvements:
- Offline Fractionation: Use offline high-pH reverse-phase fractionation of peptides prior to immunoenrichment to reduce complexity [29] [31].
- Advanced Fragmentation: Employ more advanced peptide fragmentation settings in the ion routing multipole for better identification [29].
- Efficient Cleanup: Use a filter-based plug to retain antibody beads during washing, enhancing specificity for diGly peptides [29].
- Buffer Compatibility: Check compatibility of all buffer components, including detergents, EDTA, and reducing agents, as they can affect enrichment efficiency [30].
Q3: What quantitative methods are available for ubiquitination studies?
A: Stable Isotope Labeling by Amino Acids in Cell Culture (SILAC) is the primary method for relative quantification in ubiquitination studies. Culture cells in DMEM lacking arginine and lysine, supplemented with stable isotope-labeled amino acids (e.g., Lysine-8 [13C6;15N2], Arginine-10 [13C6;15N4]) before proceeding with your enrichment protocol [29].
Experimental Protocols
Detailed Methodology for diGly Peptide Enrichment
Sample Preparation (Cells):
- Culture cells (e.g., HeLa or U2OS) in appropriate medium. For quantitative proteomics, use SILAC-compatible medium [29].
- Treat cells with proteasome inhibitor (e.g., Bortezomib) for 4-12 hours to enrich ubiquitinated substrates [29].
- Lyse cells in buffer containing 1% sodium deoxycholate or N-Lauroylsarcosine, 100 mM Tris pH 8.5, with added phosphatase and protease inhibitors [29].
- Reduce proteins with 1,4-Dithioerythritol and alkylate with iodoacetamide [29].
- Digest proteins first with LysC (Wako Pure Chemicals) followed by trypsin digestion [29].
Peptide Fractionation and Enrichment:
- Perform offline high-pH reverse-phase fractionation using Sep-Pak tC18 cartridges or similar [31] [29].
- Cross-link K-ε-GG antibody (Cell Signaling Technology, #5562) to protein A agarose beads using dimethyl pimelimidate [31].
- Incubate peptide fractions with cross-linked antibody beads for 2 hours at 4°C [29].
- Wash beads extensively with cold PBS and elute diGly peptides with 0.15% trifluoroacetic acid [29].
- Desalt peptides using C18 StageTips or similar prior to LC-MS/MS analysis [29].
LC-MS/MS Analysis:
- Analyze enriched peptides using nanoflow LC-MS/MS (e.g., EASY-nanoLC 1200 coupled to Orbitrap Fusion Lumos) [29].
- Use a 2-hour linear gradient from 5% to 30% acetonitrile in 0.1% formic acid [29].
- Set MS1 resolution to 120,000 and MS2 resolution to 30,000 [29].
- Use higher-energy collisional dissociation (HCD) fragmentation with stepped normalized collision energies [29].
Data Presentation
Table 1: Comparison of Ubiquitination Site Enrichment Techniques
| Technique | Principle | Typical Yield | Key Advantages | Key Limitations |
|---|---|---|---|---|
| K-ε-GG Immunoaffinity | Antibody enrichment of diglycine remnant after tryptic digest [31] | >23,000 diGly peptides from HeLa cells [29] | High specificity; Compatible with SILAC quantification [31] | Antibody cost; Cross-linking optimization required [29] |
| TiO2 Enrichment | Metal oxide affinity chromatography [32] | Varies with sample complexity | Useful for simultaneous phosphopeptide enrichment [32] | Lower specificity for diGly peptides [32] |
| Combined Methods | Sequential application of complementary techniques [32] | Enhanced coverage vs. single method [32] | Maximizes identifications; Overcomes individual method limitations [32] | Increased processing time; Potential sample loss [32] |
Table 2: Troubleshooting Common Experimental Issues
| Problem | Potential Causes | Solutions | Preventive Measures |
|---|---|---|---|
| Low peptide counts | Protein degradation; Under-digestion; Low abundance [30] | Add protease inhibitors; Optimize digestion time; Scale up input [30] | Monitor steps by Western Blot; Use fresh inhibitors [30] |
| High background | Non-specific binding; Incomplete washing [29] | Optimize cross-linking; Increase wash stringency; Use filter-based cleanup [29] | Include control samples without antibody [29] |
| Poor reproducibility | Inconsistent sample handling; Variable enrichment [30] | Standardize protocols; Use stable isotope standards [29] | Implement quality control checkpoints [30] |
Workflow Visualization
Ubiquitination Site Identification Workflow
Troubleshooting Decision Pathway
The Scientist's Toolkit
Table 3: Essential Research Reagents for Ubiquitination Studies
| Reagent/Kit | Supplier | Function | Key Considerations |
|---|---|---|---|
| PTMScan Ubiquitin Remnant Motif (K-ε-GG) Kit | Cell Signaling Technologies [29] | Immunoaffinity enrichment of diGly-modified peptides | Includes specific antibody; Requires cross-linking to beads for optimal performance [29] |
| Lysyl Endopeptidase (LysC) | Wako Pure Chemicals [29] | Protein digestion prior to trypsinization | Improves digestion efficiency; Reduces missed cleavages [29] |
| TPCK-Treated Trypsin | ThermoFisher [29] | Proteolytic digestion of ubiquitinated proteins | Essential for generating diGly remnant (K-ε-GG) on lysine residues [31] |
| Protease Inhibitor Cocktails | Various (Sigma-Aldrich, etc.) [30] | Prevent protein degradation during sample preparation | Use EDTA-free versions; PMSF recommended; Add to all buffers [30] |
| Stable Isotope Amino Acids | Cambridge Isotope Laboratories [29] | SILAC quantification of ubiquitination dynamics | Lysine-8 (13C6;15N2), Arginine-10 (13C6;15N4) for heavy labeling [29] |
| Bortezomib | UBPbio [29] | Proteasome inhibition to accumulate ubiquitinated proteins | Typically used at 10 μM for 4-12 hours before harvesting [29] |
The identification of protein ubiquitination sites by mass spectrometry (MS) represents a cornerstone of proteomic research, enabling insights into critical regulatory mechanisms in cellular function and signaling. Central to this methodology is the use of anti-K-ε-GG antibodies, which specifically recognize the di-glycine remnant left on lysine residues after tryptic digestion of ubiquitinated proteins. This di-glycine tag adds a monoisotopic mass of 114.043 Da to modified lysines, creating a unique MS signature [5] [33]. While this approach has revolutionized the large-scale mapping of ubiquitination sites, researchers often encounter technical challenges that compromise data quality and reproducibility. This guide addresses these challenges through refined protocols and targeted troubleshooting, framed within the broader context of optimizing ubiquitination site identification for drug development and basic research applications.
The following diagram illustrates the core workflow for ubiquitination site identification using anti-K-ε-GG antibody enrichment:
Critical Protocol Refinements and Optimized Procedures
Antibody Cross-Linking and Input Requirements
Problem: Researchers frequently report antibody leaching during enrichment procedures, leading to inconsistent results and increased background noise in mass spectrometry data.
Solution: Implement chemical cross-linking of the anti-K-ε-GG antibody to protein A agarose beads. This refinement significantly reduces antibody contamination in downstream MS analysis and allows for antibody reuse across multiple experiments, improving reproducibility [34] [35]. The cross-linking process should be performed using standard cross-linkers such as dimethyl pimelimidate (DMP) according to established protocols.
Optimal peptide input represents another critical parameter. For single experiments aiming to identify thousands of ubiquitination sites, researchers should utilize ≥10 mg of peptide starting material [34]. This substantial input ensures sufficient abundance of low-stoichiometry ubiquitinated peptides for reliable detection after enrichment.
Advanced Fractionation Strategies
Problem: Direct analysis of enriched peptides without prior fractionation yields limited ubiquitination site identifications due to sample complexity.
Solution: Implement off-line high-pH reversed-phase chromatography as a pre-fractionation step before immunoaffinity enrichment. This technique separates the complex peptide mixture into multiple fractions (typically 12-24), dramatically reducing sample complexity and increasing proteome coverage [11] [35]. The protocol involves:
- Separating peptides using a high-pH (pH 10) reversed-phase column
- Collecting timed fractions across an acetonitrile gradient
- Concatenating fractions to reduce the number of LC-MS/MS runs
- Proceeding with immunoaffinity enrichment of each fraction pool
This approach enables identification of >20,000 distinct ubiquitination sites from a single experiment when combined with SILAC labeling [34].
Quantitative Ubiquitin Profiling
Problem: Many biological questions require comparative analysis of ubiquitination changes under different conditions, not just cataloging sites.
Solution: Incorporate stable isotope labeling strategies such as SILAC (Stable Isotope Labeling by Amino Acids in Cell Culture) or isobaric tags (e.g., iTRAQ, TMT) for quantitative assessments [17] [36]. The integrated workflow below demonstrates how SILAC labeling combines with K-ε-GG enrichment for quantitative ubiquitinome analysis:
This methodology enables researchers to distinguish true ubiquitination changes from global protein abundance alterations, particularly important when studying E3 ligase substrates or DUB targets [1] [36].
Frequently Asked Questions: Troubleshooting Guide
Q1: My enrichment efficiency is low, with few ubiquitinated peptides identified. What could be the issue?
A1: Several factors could contribute to poor enrichment efficiency:
- Insufficient peptide input: Ensure you're using at least 10 mg of peptide material as a starting point [34]
- Antibody capacity: Check the binding capacity of your antibody-bead conjugate and do not exceed recommended amounts
- Digestion efficiency: Verify complete protein digestion through quality control steps, as incomplete digestion masks ubiquitination sites
- Sample complexity: Implement high-pH fractionation to reduce complexity before enrichment [11]
Q2: I'm detecting high background and non-specific bindings. How can I improve specificity?
A2: High background signals often result from:
- Non-cross-linked antibody: Always use cross-linked antibodies to minimize leaching [35]
- Insufficient washing: Increase wash stringency and volume while maintaining denaturing conditions (8 M urea) [5] [17]
- Carryover contamination: Use dedicated columns and solutions for ubiquitin enrichment separate from other proteomic workflows
Q3: How can I distinguish ubiquitination from modifications by ubiquitin-like proteins?
A3: The anti-K-ε-GG antibody also recognizes the di-glycine remnant from NEDD8 and ISG15 modifications [36]. To distinguish true ubiquitination events:
- Genetic approaches: Express epitope-tagged ubiquitin in cells and combine with antibody enrichment [5] [8]
- Biochemical separation: Isolate ubiquitinated proteins prior to digestion using tandem ubiquitin-binding entities (TUBEs) [8]
- Contextual validation: Correlate identified sites with known ubiquitination-dependent biological processes
Q4: What is the typical yield and success rate for a standard experiment?
A4: Under optimized conditions, researchers can expect:
- Peptide yield: Approximately 5 μg of enriched peptides from 3 mg of input peptides [36]
- Enrichment selectivity: >80% of identified peptides should contain K-ε-GG motifs [36]
- Site identification: >10,000 distinct ubiquitination sites from a single experiment using the refined protocol [34]
Quantitative Performance Metrics
The refinement of anti-K-ε-GG antibody protocols has dramatically improved the scale and reliability of ubiquitination site identification. The following table summarizes key performance metrics from foundational studies:
Table 1: Performance Metrics of Anti-K-ε-GG Antibody Enrichment in Key Studies
| Study Reference | Starting Material | Fractionation Method | Number of Ubiquitination Sites Identified | Quantitative Approach |
|---|---|---|---|---|
| Udeshi et al. [34] | 10 mg peptides | High-pH reversed-phase | >20,000 | SILAC |
| Udeshi et al. [35] | Cell line or tissue | High-pH reversed-phase | Tens of thousands | SILAC or label-free |
| Peng et al. [5] | His-tagged Ub yeast | LC/LC-MS/MS | 110 sites on 72 proteins | Label-free |
| Springer et al. [36] | 3 mg xenograft peptides | Immunoaffinity only | ~350 ubiquitylated peptides | iTRAQ |
Essential Research Reagent Solutions
Table 2: Key Reagents for K-ε-GG Enrichment Experiments
| Reagent/Category | Specific Examples | Function/Application | Protocol Considerations |
|---|---|---|---|
| Anti-K-ε-GG Antibody | Commercial monoclonal (Cell Signaling Technology, etc.) | Immunoaffinity enrichment of ubiquitinated peptides | Must be cross-linked to beads; recognizes NEDD8/ISG15 remnants |
| Enrichment Beads | Protein A agarose/sepharose | Antibody immobilization | Cross-link antibody to prevent leaching |
| Protease Inhibitors | PMSF, protease inhibitor cocktails | Prevent deubiquitination during lysis | Include DUB inhibitors in lysis buffer |
| Denaturing Agents | Urea (8 M) | Denature proteins and prevent non-specific interactions | Use fresh urea to prevent carbamylation |
| Stable Isotopes | SILAC amino acids ([13C6,15N4]Arg, [13C6,15N2]Lys) | Quantitative proteomics | Ensure complete incorporation (>97%) |
| Chromatography Resins | High-pH stable C18 material | Peptide fractionation | Concatenate fractions to reduce runs |
The refined protocols for anti-K-ε-GG antibody enrichment detailed in this technical guide address the most significant challenges in ubiquitination site mapping. Through antibody cross-linking, appropriate peptide input, advanced fractionation, and quantitative methodologies, researchers can achieve unprecedented depth and reliability in ubiquitinome analyses. These optimized approaches provide the technical foundation for exploring the complex roles of protein ubiquitination in cellular regulation and disease pathogenesis, supporting both basic research and drug discovery efforts.
Core Concept: What are Tagged Ubiquitin Systems?
Tagged ubiquitin systems involve the genetic engineering of ubiquitin to include an affinity tag, such as poly-Histidine (His) or Strep-tag, which allows for the purification of ubiquitinated proteins from complex cellular lysates. These systems are fundamental tools for mass spectrometry-based identification of ubiquitination sites.
How it works: A cell line or model organism is engineered to express tagged ubiquitin. After cellular stimulation, ubiquitinated proteins are purified under denaturing conditions using resins that bind the tag. Enriched proteins are digested with trypsin, and the resulting peptides are analyzed by mass spectrometry. Ubiquitination sites are identified by searching for the diagnostic diGly (K-ε-GG) remnant left on modified lysine residues after trypsin digestion [26] [37] [5].
Critical Troubleshooting FAQs
FAQ 1: Why is my ubiquitinated protein yield low despite high expression of tagged ubiquitin?
Low yield can be attributed to several factors in the purification process.
Potential Cause 1: Incomplete Denaturation.
Potential Cause 2: Inefficient Binding to Resin.
- Problem: His-tag binding to Ni-NTA resin is impaired by cellular chelators or imidazole.
- Solution: Include 20-25 mM imidazole in the lysis and wash buffers to reduce non-specific binding, but avoid concentrations that elute the tag. For Strep-tag systems, ensure buffers are free of biotin.
Potential Cause 3: Tag Inaccessibility.
- Problem: The affinity tag on ubiquitin may be sterically hindered in certain polyubiquitin chain architectures.
- Solution: Optimize washing stringency. Include a wash buffer at a lower pH (e.g., pH 6.3) while maintaining high urea concentration to remove non-specifically bound proteins without eluting your target [17].
FAQ 2: My negative control still shows many proteins. How do I distinguish true ubiquitinated substrates from background?
A high background is a common challenge. The key is to implement rigorous controls and post-enrichment validation.
Solution 1: Use a Tandem Tag.
- Protocol: Perform a two-step purification. For example, use a His-biotin tandem tagged ubiquitin. First, purify on a Ni-NTA column. Then, take the eluate and perform a second purification with Streptavidin beads [5]. This dramatically increases specificity.
Solution 2: Employ a Genetic Negative Control.
- Protocol: Process two cell populations in parallel: one expressing His-tagged ubiquitin and another expressing untagged wild-type ubiquitin. Purify both under identical denaturing conditions. After MS analysis, subtract proteins identified in the wild-type control from the His-tag sample [5]. This removes endogenous His-rich and other non-specifically binding proteins.
Solution 3: Validate by Site-Specific Evidence.
FAQ 3: How do I confirm that my tagged ubiquitin system functions like endogenous ubiquitin?
It is crucial to verify that the tag does not disrupt normal ubiquitin biology.
Control Experiment 1: Functional Complementation.
Control Experiment 2: Linkage Specificity Profiling.
- Protocol: Use linkage-specific antibodies (e.g., for K48 or K63 chains) or MS-based techniques to analyze the types of polyubiquitin chains formed in your system. Compare the chain linkage profile to that of cells with wild-type ubiquitin to ensure no major distortions have occurred [37].
Comparison of Tagged Systems and Key Reagents
The choice between His and Strep tags involves a trade-off between cost, purity, and ease of use. The following table summarizes the pros, cons, and key control experiments for each system.
Table 1: Comparison of Tagged Ubiquitin Systems for Mass Spectrometry
| Feature | His-Tag System | Strep-Tag System |
|---|---|---|
| Primary Use | High-yield enrichment of ubiquitinated conjugates [37] [5] | High-specificity purification with lower background [37] [39] |
| Key Advantage | Robust, inexpensive resin, works well under denaturing conditions [5] | Very high affinity and specificity, gentle elution with biotin [37] |
| Major Disadvantage | Co-purification of endogenous His-rich proteins, requires stringent negative controls [37] [5] | Higher cost of Strep-Tactin resin, potential for interference by endogenous biotinylation [37] |
| Critical Control Experiment | Parallel purification from cells expressing untagged ubiquitin to subtract background [5] | Similar to His-tag, use of a wild-type ubiquitin control cell line is essential [37] |
| Best Suited For | Large-scale preparative purifications where cost is a factor | Situations requiring high purity and minimal background, such as complex tissue samples [37] [10] |
Research Reagent Solutions Toolkit
Table 2: Essential Reagents for Tagged Ubiquitin Experiments
| Reagent / Tool | Function / Explanation | Example Use Case |
|---|---|---|
| Plasmid: Tagged Ubiquitin | Genetic template for expressing His- or Strep-tagged Ub in cells. | Stable or transient transfection of HEK293T or HeLa cells to create your model system [38] [37]. |
| Affinity Resin | Solid matrix for binding the tag. | Ni-NTA Agarose for His-tags; Strep-Tactin Sepharose for Strep-tags [26] [17] [39]. |
| DUB Inhibitors | Prevents loss of ubiquitin signal during lysis. | PR-619 or other broad-spectrum inhibitors added fresh to lysis buffer [26]. |
| Anti-K-ε-GG Antibody | Enriches for tryptic peptides with the diGly remnant for site identification. | Used after protein-level enrichment for highly specific ubiquitin site mapping by MS [26] [35] [10]. |
| Control Cell Line | Expresses untagged, wild-type ubiquitin. | Serves as the essential negative control to identify non-specifically bound proteins [5]. |
Advanced Strategy: Combining Protein and Peptide Enrichment
For the deepest coverage of the ubiquitinome, a sequential enrichment strategy is most powerful. This involves purifying ubiquitinated proteins using a tagged ubiquitin system, followed by digesting these proteins and performing a second enrichment at the peptide level using anti-K-ε-GG antibodies.
This combined approach leverages the broad capture of the tagged ubiquitin system to overcome the low stoichiometry of ubiquitinated proteins, and then uses the high specificity of the anti-K-ε-GG antibody to precisely pinpoint the modification sites, routinely enabling the identification of over 20,000 ubiquitination sites from a single sample [26] [10].
Ubiquitin-Binding Domain (UBD) and TUBE-Based Approaches
Protein ubiquitination is an essential post-translational modification regulating diverse cellular functions, including protein degradation, DNA repair, and signal transduction [8] [5]. The ubiquitin (Ub) system involves a cascade of E1 (activating), E2 (conjugating), and E3 (ligase) enzymes that covalently attach Ub to substrate proteins, while deubiquitinating enzymes (DUBs) remove Ub [8]. A significant analytical challenge arises from the complexity of Ub signals, which range from single Ub modifications to polymers (polyUb chains) with different linkage types and architectures [8] [40]. Ubiquitin-Binding Domains (UBDs) are protein modules that recognize and interact with ubiquitin moieties, while Tandem Ubiquitin-Binding Entities (TUBEs) are engineered tools containing multiple UBDs that exhibit significantly higher affinity for Ub chains compared to single UBDs [8] [41]. This technical resource focuses on troubleshooting the application of these tools for the enrichment and analysis of ubiquitinated proteins, particularly when coupled with mass spectrometry (MS).
Key Research Reagent Solutions
The following table outlines essential reagents used in UBD- and TUBE-based affinity enrichment protocols.
Table 1: Key Research Reagents for UBD and TUBE Experiments
| Reagent Type | Specific Examples | Primary Function in Experiment |
|---|---|---|
| Affinity Tags | His-tag, Strep-tag, HA-tag, FLAG-tag [8] [5] | Purification of ubiquitinated proteins when fused to ubiquitin; allows enrichment under denaturing conditions. |
| Ubiquitin Antibodies | P4D1, FK1/FK2 (pan-specific); K48-, K63-, K11-linkage specific [8] [10] [42] | Immunoaffinity enrichment of endogenous ubiquitinated proteins or specific Ub chain linkages from complex lysates. |
| Ubiquitin-Binding Domains (UBDs) | TUBEs (non-selective), NZF1 (K29-selective) [40] [41] | High-affinity enrichment of polyubiquitinated proteins from cell lysates; can be linkage-specific or general. |
| Mass Spec Standards | Ub-AQUA peptides (isotopically labeled) [42] | Absolute quantification of ubiquitination sites and Ub chain linkages in mass spectrometry. |
| Protease Inhibitors | Bortezomib (proteasome inhibitor) [10] | Stabilizes the cellular ubiquitinome by preventing degradation of ubiquitinated proteins, increasing yield. |
Technical FAQs and Troubleshooting Guides
Ubiquitinated Protein Enrichment
Q1: Why is my yield of ubiquitinated proteins low despite using TUBEs for enrichment?
Low yield can stem from several factors related to sample preparation and the affinity step itself.
- Cause: Ineffective Cell Lysis and Protein Extraction. Incomplete lysis leaves ubiquitinated proteins unrecovered. The use of non-denaturing lysis buffers fails to disrupt strong protein-protein interactions, hiding ubiquitinated proteins within complexes.
- Solution: Utilize denaturing lysis buffers containing agents like sodium deoxycholate (DOC) [10]. Boiling the lysate post-lysis (e.g., 95°C for 5 minutes) further denatures proteins and inactivates DUBs.
- Cause: Proteasomal Degradation During Preparation. The proteasome continuously degrades proteins marked with K48- and K11-linked Ub chains, reducing the pool you aim to study.
- Solution: Pre-treat cells with a proteasome inhibitor such as Bortezomib (e.g., 10 µM for 8 hours) prior to lysis [40] [10]. This stabilizes a large subset of the ubiquitinated proteome.
- Cause: Suboptimal TUBE-Binding Conditions. The binding of TUBEs to ubiquitinated proteins is influenced by buffer conditions, incubation time, and the ratio of TUBEs to lysate.
- Solution: Ensure binding is performed under native conditions in a compatible buffer (e.g., 50 mM Tris, 150 mM NaCl) with overnight incubation at 4°C on a rotating platform [40]. Increase the amount of TUBE resin if the lysate protein amount is high.
Q2: How can I confirm that my enrichment specifically pulled down ubiquitinated proteins and not non-specific binders?
Specificity is a common concern, particularly when working with complex cell lysates.
- Cause: Co-purification of Endogenous Proteins with Affinity Handles. For example, His-tag purifications can co-enrich endogenous histidine-rich proteins, while Strep-tag systems can bind endogenous biotinylated proteins [8].
- Solution: Always include a negative control from cells not expressing the tagged ubiquitin (or untransfected) processed in parallel [5]. Analyze your final eluate by western blot using an anti-ubiquitin antibody (e.g., P4D1) to confirm the presence of a characteristic ubiquitin smear [40].
- Cause: Non-specific Binding to the Affinity Resin.
- Solution: Incorporate stringent washes after the binding step. Wash the resin multiple times with your binding buffer, and consider adding a final wash with a low-salt or no-detergent buffer (e.g., 50 mM Tris, 150 mM NaCl, pH 7.5) to remove weakly associated proteins [40].
Linkage Specificity and Mass Spectrometry
Q3: My goal is to analyze K48- and K63-linked chains, but my data shows poor linkage specificity. What went wrong?
Achieving linkage specificity requires careful tool selection and experimental design.
- Cause: Using a Non-Selective Enrichment Tool. Standard TUBEs are designed to bind all ubiquitin chain linkages with high affinity and are not linkage-specific [8] [40].
- Solution: For linkage-specific analysis, you must use reagents engineered for specificity. These include:
- Cause: Cross-Reactivity of Linkage-Specific Reagents.
- Solution: Validate the linkage specificity of your reagent using well-characterized, homotypic Ub chains (available from specialty biotech companies) in a controlled pull-down experiment before applying it to complex samples.
Q4: Why are my ubiquitination site identifications by MS low, even after successful enrichment?
This issue typically originates at the sample preparation stage for MS.
- Cause: Inefficient Digestion and DiGly Peptide Generation. The signature of ubiquitination for MS is a diGly (K-ε-GG) remnant on lysine after trypsin digestion. Incomplete digestion or peptide loss leads to low identification rates.
- Solution: Optimize the tryptic digestion protocol. Use a combination of Lys-C and trypsin for more complete digestion [10]. Avoid using deubiquitinase inhibitors like N-ethylmaleimide (NEM) that can introduce unwanted protein modifications and complicate MS analysis [10].
- Cause: High Sample Complexity Without Further Fractionation. Even after enrichment, the peptide mixture is too complex, leading to signal suppression and under-sampling by the mass spectrometer.
- Solution: Incorporate an offline high-pH reverse-phase fractionation step prior to the final LC-MS/MS run. This spreads the peptide load over multiple MS injections, dramatically increasing the number of identifications [11] [10]. This step alone can enable the identification of over 23,000 diGly sites from a single sample [10].
- Cause: Inadequate MS Data Acquisition Settings.
- Solution: For diGly peptide analysis, use advanced fragmentation settings like Higher-Energy Collisional Dissociation (HCD) with the ion routing multipole optimized for the detection of low-mass fragments, which is crucial for recognizing the diGly signature [10].
Table 2: Comparison of Primary Enrichment Methods for Ubiquitinated Proteins
| Method | Principle | Advantages | Limitations | Best Suited For |
|---|---|---|---|---|
| TUBE-Based Enrichment [8] [41] | High-affinity binding of polyUb chains via tandem UBDs. | Protects Ub chains from DUBs; captures diverse linkage types; works under native conditions. | Not inherently linkage-specific; requires careful control for non-specific binding. | Global analysis of the ubiquitinome; studying unstable or low-abundance ubiquitination events. |
| Tagged Ubiquitin (e.g., His, Strep) [8] [5] | Affinity purification of ubiquitinated proteins via tag fused to Ub. | Effective under denaturing conditions; high purity; good for engineered cell systems. | Cannot be used on clinical/animal tissues; potential for artifacts from overexpression. | High-throughput screening in cell culture models; identification of novel substrates. |
| DiGly Antibody Enrichment (K-ε-GG) [11] [10] | Immunoaffinity purification of tryptic peptides containing the diGly remnant. | Identifies modification sites directly; works on any sample (including tissues); highly specific. | Requires large amounts of starting material; provides no native chain architecture info. | System-wide mapping of ubiquitination sites; quantitative comparisons between conditions (e.g., SILAC). |
| Linkage-Specific Antibody Enrichment [8] [42] | Immunoaffinity using antibodies specific to a Ub chain linkage. | High specificity for the linkage of interest; works on endogenous proteins. | Limited to the available antibody specificity; potential for cross-reactivity. | In-depth study of the biology of a specific Ub chain linkage (e.g., K48 in degradation). |
Experimental Workflow for TUBE-Based MS Analysis
The following diagram outlines a robust workflow for the enrichment and identification of ubiquitinated proteins using TUBEs, incorporating key troubleshooting steps.
Detailed Protocol Highlights
- Sample Preparation and Lysis: Grow cells in culture, optionally using SILAC media for quantitative experiments [10]. Treat cells with a proteasome inhibitor (e.g., 10 µM Bortezomib) for several hours to stabilize ubiquitinated proteins. Lyse cells using a denaturing buffer (e.g., 50 mM Tris-HCl with 0.5% sodium deoxycholate), followed by boiling at 95°C for 5 minutes to fully denature proteins and inactivate DUBs [10].
- TUBE Enrichment: Incubate the clarified cell lysate with TUBE-coupled resin overnight at 4°C with gentle rotation [40] [41].
- Washing and Elution: Pellet the resin and wash thoroughly with binding buffer followed by a final wash with a minimal buffer (e.g., 50 mM Tris, 150 mM NaCl, pH 7.5) to reduce non-specific binding [40]. Elute the bound ubiquitinated proteins using a low-pH buffer or SDS-PAGE loading buffer.
- Mass Spectrometry Sample Preparation: Digest the eluted proteins using a combination of Lys-C and trypsin [10]. Desalt the resulting peptides and subject them to offline high-pH reverse-phase fractionation to reduce sample complexity. This is a critical step for deep ubiquitinome coverage [11] [10].
- LC-MS/MS and Data Analysis: Analyze the fractions by LC-MS/MS on a high-resolution instrument (e.g., Orbitrap). Search the resulting spectra against a protein database using software that can detect the diagnostic 114.043 Da mass shift on lysine residues corresponding to the diGly remnant [8] [10].
UBD- and TUBE-based approaches provide powerful and versatile methods for overcoming the central challenges in ubiquitin research: low endogenous abundance, structural complexity, and DUB-mediated reversal. Successful implementation requires careful attention to experimental design, including the choice of enrichment tool based on the biological question, rigorous application of controls, and optimization of sample preparation for mass spectrometry. By addressing the common pitfalls outlined in this guide, researchers can reliably capture and characterize the ubiquitinome to uncover novel regulatory mechanisms in health and disease.
The Critical Role of Offline High-pH Fractionation for Depth
In mass spectrometry-based proteomics, the depth of analysis is often limited by the immense complexity of biological samples and the wide dynamic range of protein abundances. This is particularly true for the analysis of post-translational modifications like ubiquitination, where modified peptides are of low stoichiometry and can be masked by more abundant unmodified peptides. Offline high-pH reversed-phase fractionation serves as a powerful first-dimensional separation technique that significantly reduces sample complexity prior to LC-MS/MS analysis. By fractionating peptides based on their hydrophobicity at high pH, this method provides exceptional orthogonality to subsequent low-pH reversed-phase separations, enabling researchers to achieve dramatically improved coverage of ubiquitination sites and other low-abundance post-translational modifications.
Key Concepts: Understanding High-pH Fractionation
What is offline high-pH fractionation and how does it improve ubiquitination site mapping?
Offline high-pH reversed-phase fractionation is a separation technique that involves fractionating peptides using a reversed-phase column with a high-pH mobile phase (typically pH 10) prior to further analysis. This method significantly improves ubiquitination site mapping by reducing sample complexity and increasing analytical dynamic range. When combined with diGly peptide enrichment, high-pH fractionation enables the identification of over 23,000 ubiquitination sites from human cell lysates, a substantial improvement over non-fractionated approaches [29]. The power of this technique lies in its orthogonality to standard low-pH reversed-phase separations used in nanoLC-MS/MS, effectively expanding the separation space and allowing for more comprehensive analysis of modified peptides [43].
How does fraction concatenation enhance the effectiveness of high-pH fractionation?
Fraction concatenation significantly improves the effectiveness of high-pH fractionation by pooling non-adjacent fractions from the first dimension separation. This strategy compensates for imperfect orthogonality between the two separation dimensions and makes more efficient use of the second dimension separation window. Instead of combining adjacent fractions, concatenation involves pooling early, middle, and late eluting fractions from the high-pH separation into a single fraction for subsequent analysis. This approach has been shown to increase peptide identifications by 1.8-fold and protein identifications by 1.6-fold compared to traditional strong-cation exchange (SCX) chromatography [43]. The broader elution profile of concatenated fractions in the second dimension results in better utilization of the analytical separation power.
Table: Comparison of First-Dimension Separation Methods for 2D Proteomics
| Method | Orthogonality with Low-pH RPLC | Peptide Identifications | Protein Identifications | Sample Loss | Ease of Use |
|---|---|---|---|---|---|
| High-pH RPLC with Concatenation | Excellent | ~37,633 (from human cell digest) | ~4,363 (from human cell digest) | Low | High |
| Traditional SCX | Good | ~20,900 (from human cell digest) | ~2,727 (from human cell digest) | Moderate | Moderate |
| Low-pH RPLC | Poor | Limited | Limited | Low | High |
Troubleshooting Guide: Common Experimental Challenges
How can I address low ubiquitination site identification despite high protein input?
If you're obtaining low ubiquitination site identifications despite using sufficient protein input (≥1 mg), several factors should be investigated:
- Verify enrichment efficiency: Ensure proper antibody cross-linking to beads and optimize washing conditions to minimize non-specific binding. The efficiency of diGly peptide enrichment is crucial – without proper enrichment, only 100-150 low-abundance diGly peptides may be identified even from complex whole cell lysates [29].
- Check fractionation performance: Monitor the high-pH separation carefully. Using synthetic peptide standards to determine precise retention times of target peptides allows for more specific fraction collection, making analysis faster and easier [44] [45].
- Optimize proteasome inhibition: Treat cells with proteasome inhibitors like bortezomib prior to harvesting to stabilize ubiquitinated proteins and increase the abundance of diGly peptides for detection [29].
- Validate mass spectrometer calibration: Ensure instrument calibration using appropriate calibration solutions, and verify LC settings and gradient performance with peptide retention time calibration mixtures [46].
What steps can I take to minimize sample loss during fractionation?
Sample loss during fractionation is particularly problematic when working with limited clinical samples or biopsy material. These strategies can help minimize losses:
- Eliminate unnecessary desalting steps: High-pH RPLC has higher tolerance for samples containing salts or other reagents compared to SCX. Our results indicate that desalting is not necessary prior to high-pH RPLC fractionation, which reduces processing time and sample losses [43].
- Use C18 StageTips for microscale fractionation: For protein samples in the sub-microgram range, modified C18 StageTip methods provide efficient microscale fractionation with reduced sample loss compared to conventional approaches [47].
- Implement chemical cross-linking for antibodies: When enriching diGly peptides, chemically cross-link the anti-K-ε-GG antibody to beads rather than using non-covalent coupling to prevent antibody leaching and improve recovery [48].
- Include stable isotope-labeled standards: Use heavy stable-isotope-labeled standard (SIS) analogues as normalizers to account for losses during sample processing and analysis [44] [45].
Why is my quantitative reproducibility poor despite high identification rates?
Poor quantitative reproducibility despite high identification rates often stems from inconsistencies in fraction collection or enrichment efficiency:
- Standardize fraction collection windows: Use synthetic peptide standards to precisely determine retention times in the first-dimensional separation and consistently collect fractions of interest [44].
- Implement stable isotope labeling: Incorporate SILAC (Stable Isotope Labeling by Amino Acids in Cell Culture) labeling for reliable relative quantification across multiple samples [48].
- Normalize with heavy labeled standards: Include heavy stable-isotope-labeled peptide analogues in your workflow to account for variations in sample processing and analysis [44] [45].
- Create standard curves: Generate multi-point standard curves by serial dilution of validated unlabeled synthetic peptides at known concentrations to ensure quantitative accuracy [45].
Table: Quantitative Performance of High-pH Fractionation with Targeted MS
| Parameter | Without Fractionation | With High-pH Fractionation | Improvement Factor |
|---|---|---|---|
| Sensitivity for low-abundance plasma proteins | Baseline | Up to 50-fold improvement | 50x |
| Number of ubiquitination sites identifiable | Limited | >23,000 diGly peptides | Substantial |
| Protein sequence coverage | Limited | Comprehensive | 1.6-fold |
| Analytical dynamic range | Constrained | Expanded | Significant |
Experimental Protocols
Standard workflow for ubiquitination site mapping with offline high-pH fractionation
Detailed protocol: High-pH reversed-phase fractionation for ubiquitination site analysis
Step 1: Sample Preparation
- Grow cells in SILAC medium for quantitative experiments [48] [29]
- Treat cells with proteasome inhibitor (e.g., bortezomib, 10 μM for 4-6 hours) to stabilize ubiquitinated proteins [29]
- Lyse cells in urea-based lysis buffer (e.g., 8M urea, 100 mM Tris pH 8.0) supplemented with protease and deubiquitinase inhibitors
- Reduce proteins with 1-5 mM dithiothreitol (DTT) and alkylate with 10-15 mM iodoacetamide
- Digest proteins first with LysC (1:100 enzyme-to-protein ratio) for 2-3 hours, then with trypsin (1:50 ratio) overnight at 37°C [48]
Step 2: High-pH Fractionation
- Acidify peptide digest to pH ~2 with formic acid or TFA
- Desalt peptides using C18 solid-phase extraction if necessary (though high-pH RPLC has good salt tolerance) [43]
- Reconstitute peptides in high-pH mobile phase A (10 mM ammonium formate or ammonium bicarbonate, pH 10)
- Load onto reversed-phase column (C18 or similar) equilibrated in mobile phase A
- Elute with increasing gradient of mobile phase B (10 mM ammonium formate/bicarbonate in acetonitrile, pH 10) over 60-120 minutes
- Collect 60 fractions at equal time intervals throughout the gradient
Step 3: Fraction Concatenation
- Pool non-adjacent fractions using a concatenation scheme (e.g., combine fractions 1, 21, 41; fractions 2, 22, 42; etc.) [43]
- This strategy effectively compensates for imperfect orthogonality and makes better use of the second dimension separation
- Reduce to 10-15 concatenated fractions based on desired depth of analysis and instrument time available
- Dry concatenated fractions in a vacuum concentrator for subsequent diGly peptide enrichment
Step 4: diGly Peptide Enrichment
- Reconstitute each concatenated fraction in immunoaffinity purification (IAP) buffer
- Incubate with anti-K-ε-GG antibody cross-linked to protein A/G beads [48] [29]
- Wash beads extensively with IAP buffer followed by water to remove non-specifically bound peptides
- Elute diGly peptides with 0.1-0.5% TFA or formic acid
- Desalt eluted peptides using C18 StageTips or similar micro-scale purification [47]
Step 5: LC-MS/MS Analysis
- Analyze each fraction by nanoLC-MS/MS using a low-pH reversed-phase gradient
- For targeted approaches like Parallel Reaction Monitoring (PRM), use synthetic peptide standards to determine precise retention times [44]
- For discovery proteomics, use data-dependent acquisition with higher-energy collisional dissociation (HCD)
- Specifically include the diGly remnant (K-ε-GG) as a variable modification in database searches
Research Reagent Solutions
Table: Essential Reagents for Ubiquitination Site Mapping with High-pH Fractionation
| Reagent/Category | Specific Examples | Function & Importance |
|---|---|---|
| Ubiquitin Remnant Antibodies | PTMScan Ubiquitin Remnant Motif (K-ε-GG) Kit [29] | Immunoaffinity enrichment of diGly-containing peptides; critical for specificity |
| Fractionation Materials | C18 StageTips [47], Pierce High pH Reversed-Phase Peptide Fractionation Kit [46] | High-resolution separation of complex peptide mixtures; reduces sample complexity |
| Chromatography Standards | Pierce Peptide Retention Time Calibration Mixture [46] | LC system performance verification; retention time alignment |
| Mass Spec Calibrants | Pierce Calibration Solutions [46] | Instrument mass accuracy calibration; essential for reliable identifications |
| Protease Inhibitors | Bortezomib [29], Phenylmethylsulfonyl fluoride (PMSF) [48] | Stabilization of ubiquitinated proteins by preventing deubiquitination and degradation |
| Digestion Enzymes | Lysyl Endopeptidase (LysC), Trypsin (TPCK-treated) [29] | Specific protein digestion; generates consistent peptide patterns with C-terminal K/R |
| Stable Isotope Labels | SILAC Amino Acids (Lysine-8, Arginine-10) [48] [29] | Metabolic labeling for accurate quantification across multiple samples |
Advanced Applications and Future Perspectives
The integration of offline high-pH fractionation with targeted mass spectrometry methods like Parallel Reaction Monitoring (PRM) has enabled remarkable improvements in sensitivity for challenging applications. For example, this approach has demonstrated up to 50-fold improvement in sensitivity for quantitation of low-abundance plasma proteins compared to direct nanoLC-PRM analysis [44] [45]. This enhanced sensitivity is particularly valuable for clinical applications where biomarker candidates often exist at low concentrations in complex matrices.
Looking forward, the continued refinement of high-pH fractionation methodologies will focus on further minimizing sample requirements while maximizing proteomic depth. The development of more efficient microscale fractionation strategies is particularly important for applications with limited starting material, such as clinical biopsies or rare cell populations [47]. Additionally, the integration of high-pH fractionation with emerging techniques for analyzing ubiquitin chain architectures will provide more comprehensive insights into the complexity of ubiquitin signaling [49]. As mass spectrometry instrumentation continues to advance in sensitivity and speed, the strategic implementation of offline high-pH fractionation will remain essential for achieving the depth of analysis required to unravel the complexities of the ubiquitin code and its roles in health and disease.
Optimizing Trypsin Digestion and Preventing Artifacts
This technical support center provides targeted troubleshooting guides and FAQs for researchers identifying ubiquitination sites by mass spectrometry. The guidance is framed within the context of a broader thesis on troubleshooting this complex proteomic workflow.
Troubleshooting Guide: Common Trypsin Digestion Issues in Ubiquitin Proteomics
Low Digestion Efficiency & Poor Peptide Yield
- Problem: Incomplete protein digestion, leading to low yields of target peptides, particularly the K-ε-GG-containing peptides critical for ubiquitination analysis.
- Causes:
- Inefficient protein denaturation and solubilization.
- Suboptimal trypsin-to-protein ratio.
- Incorrect buffer conditions (pH, buffer species) for tryptic activity.
- Insufficient digestion time or temperature.
- Solutions:
- Ensure complete protein denaturation using 8 M urea [26] or 1% sodium deoxycholate (SDC) [50].
- Optimize the trypsin-to-protein ratio. A common starting point is 1:50 (w/w), but this may require adjustment [50].
- Evaluate different digestion buffers. Research shows that the optimal buffer can be specimen-dependent and significantly impact sensitivity [50].
- Consider using a trypsin/Lys-C protease mix, which has been shown to enhance proteolysis, increase peptide and protein identifications, and improve analytical reproducibility compared to trypsin alone [51].
Disulfide Bond Scrambling Artifacts
- Problem: Disulfide bond scrambling during sample preparation, leading to incorrect disulfide linkage assignment and complicating spectra analysis.
- Causes: Artifacts are often induced when basic pH and high temperatures are used during denaturation and digestion [52].
- Solutions:
- For non-reduced peptide mapping, add an oxidizing agent (e.g., cystamine) and a low concentration of iodoacetamide (IAA) to the basic pH buffer. This method has been demonstrated to significantly reduce disulfide scrambling artifacts with high reproducibility [52].
Incomplete Lysis and Ubiquitinated Protein Extraction
- Problem: Failure to effectively extract ubiquitinated proteins from cells or tissue, resulting in low signal for ubiquitination sites.
- Causes:
- Inefficient lysis buffer.
- Inadequate inhibition of deubiquitinases (DUBs), leading to the loss of the ubiquitin modification during sample preparation.
- Solutions:
- Use a freshly prepared urea lysis buffer (8 M urea, 50 mM Tris HCl pH 8.0, 150 mM NaCl) [26].
- Include a cocktail of protease and deubiquitinase inhibitors in the lysis buffer. Critical components include:
Low Enrichment Efficiency of K-ε-GG Peptides
- Problem: After digestion, the enrichment of peptides containing the ubiquitin remnant (K-ε-GG) is inefficient, leading to a poor number of identified ubiquitination sites.
- Causes:
- High sample complexity without prior fractionation.
- Non-specific binding to the solid support.
- Antibody leaching during the enrichment process.
- Solutions:
- Fractionate the peptide sample before K-ε-GG enrichment using basic pH reversed-phase (bRP) chromatography. This drastically increases the number of identifiable K-ε-GG sites [26].
- Chemically cross-link the anti-K-ε-GG antibody to the beads. This reduces contamination from antibody fragments and non-K-ε-GG peptides in the final sample [26].
Optimized Protocol for Ubiquitination Site Analysis
The following workflow incorporates best practices to minimize artifacts and maximize ubiquitination site identifications.
Workflow: Ubiquitination Site Identification
Step-by-Step Methodology
Cell/Tissue Lysis and Protein Extraction
- Lyse cells or tissue in a freshly prepared urea lysis buffer (8 M urea, 50 mM Tris HCl pH 8.0, 150 mM NaCl, 1 mM EDTA) supplemented with protease and DUB inhibitors (e.g., 50 µM PR-619, 1 mM PMSF, 1 mM chloroacetamide) [26].
- Critical Tip: Always prepare urea lysis buffer fresh to prevent protein carbamylation.
Protein Denaturation, Reduction, and Alkylation
Trypsin/Lys-C Digestion
- Digest using a trypsin/Lys-C mix (1:50 enzyme-to-protein ratio) in 50 mM ammonium bicarbonate or another optimized buffer (e.g., HEPES, Tris) at 37°C for 4-18 hours [50] [51].
- Accelerated Protocol: For some applications, digestion can be completed in as little as 20 minutes by optimizing buffer and trypsin combinations, even without denaturants or alkylation [50].
Peptide Clean-up and Fractionation
- Acidify the digest to pH < 2.5 with trifluoroacetic acid (TFA) to stop the reaction.
- Desalt peptides using C18 solid-phase extraction (SPE) cartridges [26].
- For deep ubiquitinome coverage: Fractionate the desalted peptides using basic pH Reversed-Phase (bRP) HPLC (e.g., using a 5 mM ammonium formate pH 10 buffer system) [26].
K-ε-GG Peptide Enrichment
- Immobilize the anti-K-ε-GG antibody to protein A beads using a chemical cross-linker like dimethyl pimelimidate (DMP) [26].
- Incubate the fractionated or unfractionated peptide samples with the cross-linked antibody beads.
- Wash the beads thoroughly to remove non-specifically bound peptides.
- Elute the enriched K-ε-GG peptides with a low-pH eluent [26].
LC-MS/MS Analysis
- Analyze the enriched peptides using a nano-flow LC system coupled to a high-resolution tandem mass spectrometer.
- Database Search: Search the resulting MS/MS spectra against a protein database, specifying the K-ε-GG modification (mass shift of +114.0429 Da on lysine) as a variable modification [17] [5] [26].
Frequently Asked Questions (FAQs)
Q1: What is the single most critical factor for successful large-scale ubiquitination site mapping?
The most critical factor is the specific enrichment of peptides modified by the K-ε-GG remnant using a high-quality antibody. This, combined with peptide-level fractionation (like bRP-LC) prior to enrichment, is the established method for routinely identifying tens of thousands of distinct endogenous ubiquitination sites from a single sample [26].
Q2: How can I prevent disulfide scrambling in my non-reduced peptide mapping workflow?
Instead of switching to an acidic pH (which compromises trypsin activity), maintain a basic pH and add an oxidizing agent (cystamine) along with a low concentration of alkylating agent (iodoacetamide). This creates a "redox buffer" system that minimizes disulfide scrambling artifacts during sample preparation without affecting tryptic enzyme activity [52].
Q3: My trypsin digestion seems inefficient for a complex protein mixture. What can I do?
First, systematically optimize your buffer and trypsin source, as the optimal combination is often specimen-dependent and can yield significant sensitivity gains [50]. Second, consider switching from trypsin alone to a trypsin/Lys-C protease mix. The Lys-C protease, which is active under the same conditions as trypsin, cleaves more efficiently at certain resistant sites, leading to an overall improvement in protein sequence coverage and quantification accuracy [51].
Q4: Why is it necessary to use DUB inhibitors in the lysis buffer?
Deubiquitinases (DUBs) are highly active enzymes that will rapidly remove ubiquitin from substrate proteins upon cell lysis. If not inhibited, this results in substantial loss of the ubiquitin signal you are trying to measure. Including a potent, broad-spectrum DUB inhibitor like PR-619 is essential to preserve the native ubiquitinome during sample processing [26].
Research Reagent Solutions
Table: Essential Reagents for Ubiquitination Site Mapping
| Reagent | Function / Rationale | Example |
|---|---|---|
| Anti-K-ε-GG Antibody | Immuno-enrichment of peptides with the ubiquitin remnant; essential for specificity and sensitivity [26]. | PTMScan Ubiquitin Remnant Motif Kit [26] |
| Trypsin/Lys-C Mix | Enhanced protease combination for more complete digestion, higher peptide yields, and improved reproducibility vs. trypsin alone [51]. | Promega Trypsin/Lys-C Mix [51] |
| DUB Inhibitors | Preserve ubiquitin modifications by inhibiting deubiquitinating enzymes during lysis and preparation [26]. | PR-619 [26] |
| Urea | Powerful chaotrope for effective protein denaturation and solubilization in lysis buffers [26]. | High-Purity Urea |
| Cross-linker | Immobilizes antibody to beads, preventing antibody leakage and contamination of the final sample [26]. | Dimethyl Pimelimidate (DMP) [26] |
The following table summarizes quantitative findings from a systematic evaluation of digestion conditions, which can serve as a starting point for your own optimization [50].
Table: Impact of Digestion Parameters on MS Signal Intensity and Reproducibility [50]
| Parameter | Condition A | Condition B | Key Finding / Advantage |
|---|---|---|---|
| Digestion Time | 18 hours (Overnight) | 20 minutes | A 20-min digest was sufficient for a 5-protein panel in plasma without denaturants, ideal for clinical applications [50]. |
| Denaturation/Alkylation | With DTT & IAA | Without DTT & IAA | Omitting these steps in a shortened protocol did not compromise results for the tested proteins, simplifying the workflow [50]. |
| Trypsin Grade | Sequencing Grade | Bovine Pancreatic | Optimal trypsin grade is buffer-dependent; specific combinations yield significant sensitivity gains [50]. |
| Digestion Buffer | 50 mM AMBIC | HEPES, Tris, AA, PBS | The optimal buffer is specimen-type dependent (e.g., plasma vs. serum). Kinetics experiments can identify the best buffer for your sample [50]. |
A Step-by-Step Troubleshooting Guide for Common Pitfalls
Low spectral counts present a significant bottleneck in mass spectrometry-based proteomics, particularly in the study of low-abundance post-translational modifications like ubiquitination. Spectral counting, which uses the number of identified MS/MS spectra as a quantitative measure of protein abundance, becomes statistically unreliable when proteins are identified by only a few spectra [53]. For ubiquitination site mapping, this challenge is compounded by the low stoichiometry of modification, suboptimal peptide sizes from digestion, and interference from highly abundant non-modified peptides [30] [8] [3]. This technical support article addresses these specific challenges through targeted troubleshooting guides and proven methodologies to enhance peptide recovery and enrichment efficiency, ultimately improving the depth and reliability of ubiquitinome analyses.
Troubleshooting FAQs: Addressing Common Experimental Obstacles
Q: My ubiquitination experiment yielded low spectral counts for my protein of interest. How can I determine if the protein was truly ubiquitinated but lost during processing, or if it was never ubiquitinated to begin with?
A: Systematically verify your experiment at each stage. First, confirm protein expression and ubiquitination in your input sample via Western blot using anti-ubiquitin antibodies [30] [8]. To check for losses during sample processing, take aliquots at each experimental step (e.g., after cell lysis, digestion, and enrichment) and analyze them by Western Blot or Coomassie staining [30]. If the signal diminishes at a specific step, you have identified the source of the problem. For ubiquitination specifically, use linkage-specific antibodies (e.g., for K48 or K63 chains) during Western blotting to gain additional insight into the chain architecture [8].
Q: I have confirmed ubiquitination via Western blot, but MS identification remains poor. My peptide coverage is low. What steps can I take?
A: Low peptide coverage often stems from unsuitable peptide sizes or inefficient digestion. Consider the following adjustments:
- Digestion Optimization: Vary the digestion time or try a different protease (e.g., Lys-C instead of, or in combination with, trypsin) to generate a different set of peptides that may be more amenable to MS detection [30].
- Fractionation: Implement high pH reversed-phase fractionation to reduce sample complexity prior to enrichment. This simple step can significantly increase the number of unique diGly peptides identified [54] [55].
- Enrichment Scale-Up: If working with low-abundant proteins, scale up the initial protein amount or use immunoprecipitation to pre-enrich your target protein before analyzing its ubiquitination state [30].
Q: A significant number of my MS/MS spectra are low-scoring. Should I discard this data?
A: Not necessarily. A validated strategy involves a two-step process: First, apply stringent filters to obtain a set of confidently identified peptides with a low false discovery rate (e.g., <1%). Then, recover all low-scoring spectra that match to these confidently identified peptides. This approach has been shown to increase the total number of identified spectra by more than 20% and significantly improves spectral counting statistics for low-abundance proteins without compromising identification confidence [53]. The validity of recovered spectra can be assessed by examining parent ion mass error and retention time distributions [53].
Q: What are the critical buffer and sample handling considerations to maximize recovery of ubiquitinated peptides?
A: Proper sample handling is paramount for preserving labile modifications:
- Protease Inhibition: Use EDTA-free protease inhibitor cocktails during cell lysis and protein extraction to prevent degradation of ubiquitinated proteins. PMSF is recommended [30].
- Temperature Control: Keep protein samples at 4°C during active work and store them at -20°C to -80°C [30].
- Contamination Prevention: Use filter tips and HPLC-grade water to avoid contamination from keratins and polymers, which can interfere with MS detection [30].
- Detergent Compatibility: Check that all buffer components (detergents, reducing agents, salt concentration) are compatible with downstream enrichment and MS analysis. Precipitate detergents like sodium deoxycholate after digestion but before enrichment [55].
Quantitative Data: Impact of Enrichment and Data Analysis Strategies
Table 1: Comparative Performance of Phosphopeptide Enrichment Methods (Data from [54])
| Enrichment Method | Binding Mechanism | Singly Phosphorylated Peptides | Multiply Phosphorylated Peptides | Total Identified Peptides |
|---|---|---|---|---|
| TiO2 | Metal oxide affinity to phosphate groups | 492 | 116 | 608 |
| Fe-NTA IMAC | Metal chelate affinity to phosphate groups | 234 | 254 | 488 |
| Overlap | - | 155 | 1 | 156 |
Note: While this data is for phosphopeptides, it illustrates a critical principle for enrichment of modified peptides: different enrichment methods can exhibit strong biases for specific types of modifications (e.g., single vs. multiple sites). Similar considerations apply when choosing anti-diGly antibodies or ubiquitin-binding domains for ubiquitin enrichment.
Table 2: Effect of Data Acquisition Strategies on diGly Peptide Identification (Data from [55])
| Data Acquisition Strategy | Relative Improvement in diGly Peptide IDs | Key Parameter Adjustments |
|---|---|---|
| Standard "Most Intense First" | Baseline | Standard DDA with 3-second cycle time |
| Combined "Most Intense" and "Least Intense First" | >4,000 additional unique diGly peptides | Two DDA runs: one targeting intense precursors, another targeting least intense precursors |
Experimental Protocols: Detailed Methodologies for Enhanced Recovery
This protocol uses immunoaffinity enrichment of peptides containing the diGly remnant left after tryptic digestion of ubiquitinated proteins.
Materials:
- Lysis Buffer: 50 mM Tris HCl, 0.5% sodium deoxycholate (for cells) or 100 mM Tris HCl, 12 mM sodium deoxycholate, 12 mM sodium N-lauroylsarcosinate (for tissues)
- Reduction/Alkylation: 5 mM DTT, 10 mM iodoacetamide
- Enzymes: Lys-C, trypsin
- Fractionation: High pH reverse phase C18 column
- Enrichment: Ubiquitin remnant motif (diGly) antibodies conjugated to protein A agarose beads
- LC-MS/MS: Sensitive mass spectrometer (e.g., Orbitrap) coupled to nanoflow LC system
Procedure:
- Lysis and Denaturation: Lyse cells or tissue in appropriate buffer. Boil the lysate at 95°C for 5 minutes, then sonicate at 4°C for 10 minutes.
- Protein Quantification: Determine total protein amount using a BCA assay. Several milligrams of starting material are recommended.
- Reduction and Alkylation: Reduce proteins with 5 mM DTT (30 min, 50°C), then alkylate with 10 mM iodoacetamide (15 min, in the dark).
- Digestion: Digest proteins first with Lys-C for 4 hours, then with trypsin overnight at 30°C.
- Detergent Removal: Add TFA to a final concentration of 0.5% to precipitate detergents. Centrifuge at 10,000 × g for 10 minutes and collect the supernatant.
- Peptide Fractionation: Fractionate peptides using high pH reverse-phase C18 chromatography into three fractions (elute with 7%, 13.5%, and 50% acetonitrile in 10 mM ammonium formate).
- Immunoaffinity Enrichment:
- Split the antibody-bead slurry into six equal fractions.
- Incubate the three peptide fractions with the first three bead fractions for 2 hours at 4°C on a rotator.
- Transfer the supernatants to the remaining three bead fractions and repeat the incubation.
- Wash beads extensively with ice-cold IAP buffer followed by ice-cold water.
- Elute peptides with 0.15% TFA.
- LC-MS/MS Analysis:
- Perform two rounds of Data Dependent Acquisition (DDA):
- First round: "Most intense first" mode
- Second round: "Least intense first" mode
- Use high resolution for MS1, and HCD fragmentation with collision energy of 30% for MS2.
- Perform two rounds of Data Dependent Acquisition (DDA):
This bioinformatic strategy improves quantitative statistics after data acquisition.
Procedure:
- Stringent Database Search: Process raw files with standard database search tools (e.g., MaxQuant, SEQUEST) using stringent filters to achieve a confident peptide identification set (e.g., <1% FDR at peptide level).
- Spectrum Recovery: Extract all low-scoring MS/MS spectra that match to the set of confidently identified peptide sequences.
- Validation: Assess the validity of recovered spectra by examining:
- Parent ion mass measurement error distribution (should match high-quality spectra)
- Retention time distribution (should be consistent with high-quality identifications)
- Spectral quality compared to high-score spectra for the same peptides
- Data Integration: Integrate the recovered spectra into your spectral count data for quantitative analysis.
Visualizing the Workflow: Enhanced diGly Peptide Enrichment Strategy
The following diagram illustrates the key steps in the enhanced protocol for deep ubiquitinome analysis, highlighting steps that directly address the challenge of low spectral counts.
The Scientist's Toolkit: Essential Research Reagent Solutions
Table 3: Key Reagents for Enhanced Ubiquitinated Peptide Recovery
| Reagent / Tool | Function / Principle | Application in Ubiquitination Site Mapping |
|---|---|---|
| diGly Motif Antibodies | Immunoaffinity enrichment of peptides with lysine residues modified by the diGly remnant from trypsinized ubiquitin. | Core enrichment step for isolating ubiquitinated peptides from complex digests. Enables site-specific identification [55]. |
| Linkage-Specific Ub Antibodies | Antibodies that recognize specific ubiquitin chain linkages (K48, K63, M1, etc.). | Used in Western blotting to confirm ubiquitination or in enrichment protocols to study chain architecture-specific biology [8]. |
| Ubiquitin-Binding Domains (TUBEs) | Tandem-repeated Ub-binding entities with high affinity (nanomolar) for ubiquitin chains. | Protect ubiquitinated proteins from deubiquitination and proteasomal degradation during extraction. Used to enrich ubiquitinated proteins prior to digestion [8]. |
| High pH Reverse-Phase Resin | Separates peptides by hydrophobicity under basic conditions. | Fractionates complex peptide mixtures prior to enrichment, reducing complexity and increasing identification depth of low-abundance modified peptides [54] [55]. |
| Stable Isotope Labeling (SILAC) | Incorporates heavy amino acids into proteins for accurate quantification. | Allows comparative quantification of ubiquitination dynamics across different experimental conditions (e.g., treated vs. untreated) [3] [55]. |
| Activity-Based Probes | Chemical probes that covalently bind active site residues of enzyme families like deubiquitinases. | Can be used to enrich and study DUB activity and specificity, providing complementary information to ubiquitination site mapping [3]. |
Why is high background contamination a critical problem in identifying ubiquitination sites by mass spectrometry?
High background contamination interferes with mass spectrometry (MS) analysis of ubiquitination sites through several key mechanisms, ultimately compromising data quality and reliability.
- Ion Suppression: Contaminants co-eluting with your target diGly-modified peptides can severely suppress their ionization. This effect can be so dramatic that it prevents the detection of ubiquitinated peptides altogether, as illustrated by an instance where a contaminated formic acid source completely eliminated the protein signal in an LC-MS analysis [56].
- MS2 Sequencing Time: Contaminant peptides consume a significant portion of the instrument's data acquisition capacity. Studies have shown that 30–50% of MS2 sequencing time can be wasted on contaminant peptides, thereby reducing the depth of analysis for your target ubiquitinome [57].
- Interference and Misidentification: Contaminants can produce ions with the same mass-to-charge ratio (m/z) as your target analytes. Even high-resolution mass spectrometers cannot distinguish between an interfering contaminant and a diGly peptide if they share the same elemental composition [56].
Contamination can enter your workflow at virtually any stage. Adopting a mindset that every step is a potential source is the first line of defense [56]. The table below categorizes common contamination sources in IP and sample preparation.
Table 1: Common Sources of Contamination in Sample Preparation for Ubiquitination Site Mapping
| Source Category | Specific Examples | Impact on MS Analysis |
|---|---|---|
| Human Handling | Keratins from skin, hair, and clothing; lipids and amino acids from bare hands [56] [57]. | Keratin is a frequently detected protein contaminant that consumes instrument sequencing time [57]. |
| Plastics & Labware | Plasticizers (e.g., phthalates) from tubes, pipette tips, and vial inserts; polymers from low-quality plastics [56] [57]. | Plasticizers and polymers like PEG produce characteristic ion series that can cause ion suppression [57] [58]. |
| Reagents & Solvents | Impurities in water, organic solvents (ACN, methanol), and mobile-phase additives (e.g., formic acid); microbial growth in aqueous buffers [56] [59] [60]. | Can cause severe ion suppression, high baseline noise, and introduce interfering ions (e.g., PEG from solvents) [56] [58]. |
| Sample Itself | High-abundance proteins (e.g., serum albumin, casein), carryover from previous samples, and reagents like trypsin used in digestion [57]. | Abundant proteins and trypsin autolysis peptides can overshadow lower-abundance diGly peptides. |
What are the best practices to prevent contamination for cleaner immunoprecipitations?
Implementing rigorous pre-emptive practices is the most effective strategy to minimize background contamination.
- Wear Nitrile Gloves: Always wear gloves when handling any instrument components, solvent bottles, and during sample preparation to prevent the transfer of keratins and other biomolecules from skin [56] [57].
- Use High-Purity, Dedicated Reagents: Purchase LC-MS grade solvents and additives. Use dedicated solvent bottles for LC-MS only and do not wash them with detergent, as residual detergent is a common and persistent contaminant [56] [59].
- Prevent Microbial Growth: Aqueous mobile phases should be freshly prepared each week. Adding a low percentage (e.g., 5-10%) of organic solvent to aqueous phases can inhibit bacterial and algal growth [59]. Never "top off" old mobile phase bottles; replace the entire contents [59].
- Employ Meticulous Sample Prep: Use low-bind plasticware to minimize adsorption and leaching. Perform sample preparation in a laminar flow hood or a clean, low-turbulence environment [57]. After digesting your IP sample, a centrifugation step at 21,000 x g for 15 minutes can pellet particulate matter before loading the supernatant into an LC vial [59].
- Utilize a Divert Valve: A divert valve installed between the LC and MS is "a must" for reducing contamination [61]. It allows you to direct effluent to waste during periods when your analytes are not eluting (e.g., during column equilibration and washing), preventing salts and neutral contaminants from entering the mass spectrometer [59] [61].
How can I troubleshoot persistent background contamination in my LC-MS/MS data?
If contamination persists despite preventive measures, a systematic troubleshooting workflow is required. The following diagram outlines a logical pathway to identify and address the source.
Diagram: A logical workflow for troubleshooting persistent background contamination in LC-MS/MS data, emphasizing pattern recognition in MS1 spectra.
Key Troubleshooting Tools and Techniques
- Analyze MS1 Spectra for Patterns: Manually inspect the full-scan (MS1) data for tell-tale signs of contamination. The repeated mass difference of 44.026 Da is a hallmark of polyethylene glycol (PEG). Similarly, broad chromatographic peaks often indicate surfactant contamination like Triton X-100 [58].
- Use Software Tools for Rapid Identification: The open-source software Skyline can be configured with a molecular library of common contaminants. This allows for the rapid extraction and assessment of contaminant signals from your raw data, saving valuable time in identifying the interference [58].
- Employ Exclusion Lists: For data-dependent acquisition (DDA), using an "exclusion list" of m/z values for known, persistent contaminants can prevent the mass spectrometer from wasting time fragmenting these ions. This increases the instrument's efficiency in sequencing true diGly peptides [57].
- Systematic Reagent Testing: If a specific contaminant peak is consistently observed, prepare fresh mobile phases and solvents from different sources or batches, one at a time, to isolate the source of the contamination [56] [60].
Can you provide a detailed protocol for the enrichment of diGly peptides to minimize contamination?
The following protocol is adapted from a state-of-the-art method for the enrichment and identification of ubiquitination sites, with an emphasis on steps critical for minimizing contamination [29].
Protocol: DiGly Peptide Enrichment for Ubiquitination Site Mapping
Principle: After tryptic digestion of ubiquitinated proteins, a diglycine (diGly) remnant (mass shift of 114.0429 Da) remains on the modified lysine. This motif is used to specifically enrich and identify the site of ubiquitination.
Materials & Reagents
Table 2: Research Reagent Solutions for DiGly Peptide Enrichment
| Reagent/Kit | Function in Protocol | Key Consideration |
|---|---|---|
| PTMScan Ubiquitin Remnant Motif (K-ε-GG) Kit (Cell Signaling Technology) | Contains the antibody beads specific for the diGly-lysine motif for immunopurification. | The core reagent for specific enrichment of target peptides [29]. |
| Lysyl Endopeptidase (LysC) & Trypsin | Proteases for sequential digestion of proteins into peptides. | Use MS-grade enzymes to avoid self-digestion contaminants [29] [57]. |
| Offline High-pH Reverse-Phase Fractionation | Separates peptides by charge to reduce complexity before diGly enrichment. | Improves depth of analysis by reducing dynamic range [29]. |
| Sep-Pak tC18 Cartridge or similar | For desalting and cleanup of peptide samples. | Use high-capacity cartridges to handle 1+ mg protein input [29]. |
| N-Lauroylsarcosine sodium salt | A detergent for efficient protein extraction and solubilization. | Must be thoroughly removed before digestion to avoid MS contamination [29]. |
Step-by-Step Workflow
Diagram: Core experimental workflow for the enrichment of diGly-modified peptides from complex protein lysates.
Sample Preparation (Input: ≥1 mg protein):
- Extract proteins from cultured cells or tissue in lysis buffer containing a detergent like N-Lauroylsarcosine for efficient solubilization.
- Reduce and Alkylate: Use 1,4-Dithioerythritol (DTE) or DTT for reduction, and iodoacetamide for alkylation.
- Sequential Digestion: First, digest with LysC. Then, dilute the detergent to a concentration that is compatible with trypsin, and perform a second digestion with trypsin. Using MS-grade enzymes reduces contaminant introduction [29].
Peptide Cleanup and Pre-Enrichment (Critical for Cleanliness):
- Desalt the resulting peptide mixture using a C18 solid-phase extraction cartridge (e.g., Sep-Pak).
- For deep ubiquitinome analysis, perform offline high-pH reverse-phase fractionation (e.g., into 8-10 fractions) to reduce sample complexity. This step occurs before the diGly enrichment [29].
diGly Peptide Immunoaffinity Enrichment:
- Resuspend the peptide fractions in immunoaffinity purification (IAP) buffer.
- Incubate with the anti-K-ε-GG antibody beads from the PTMScan kit. This is the key step for specific isolation of diGly peptides.
- Wash the beads extensively with IAP buffer and then with water to remove non-specifically bound peptides.
Final Cleanup and LC-MS/MS Analysis:
- Use a filter-based setup to elute the enriched diGly peptides from the antibody beads with 0.1-0.2% trifluoroacetic acid.
- The use of a filter plug (e.g., Whatman GF/C) ensures no beads are carried over into the final sample, which could clog the LC-MS system [29].
- Analyze the cleaned, enriched peptides by nanoflow LC-MS/MS on a high-resolution instrument.
Combating DUB Activity with Effective Lysis and Inhibitor Cocktails
Frequently Asked Questions (FAQs)
Q1: Why is it crucial to include DUB inhibitors in my lysis buffer when studying ubiquitination? Deubiquitinases (DUBs) are highly active enzymes that can rapidly remove ubiquitin from protein substrates upon cell lysis. This activity compromises the accuracy of your experiment by leading to the loss of ubiquitination signals before you can stabilize the proteome. Using effective DUB inhibitor cocktails is essential to "freeze" the native ubiquitination state of the cell at the moment of lysis, ensuring that the ubiquitination sites you later identify by mass spectrometry truly reflect the cellular state.
Q2: What is a recommended DUB inhibitor cocktail for general ubiquitination studies? A broad-spectrum DUB inhibitor cocktail is recommended to target multiple DUB classes. A common and effective formulation includes:
- 10-20 µM PR-619: A cell-permeable, broad-spectrum DUB inhibitor.
- 1-10 µM Bortezomib (or MG-132): A proteasome inhibitor that prevents the degradation of ubiquitinated proteins, thereby stabilizing them for analysis. Always prepare inhibitor stocks in DMSO and add them to your pre-chilled lysis buffer immediately before use.
Q3: My ubiquitination signal is still weak after using inhibitors. What could be wrong? Weak signals can stem from several issues. First, verify that your inhibitors are fresh and that the DMSO concentration in your final lysis buffer does not exceed 0.1-0.5%. Second, ensure that all steps from cell lysis to protein denaturation are performed on ice or at 4°C to slow enzymatic activity. Third, consider using a stronger denaturant like 2% SDS in your lysis buffer to instantly inactivate enzymes. Finally, confirm that you are using a sufficient amount of starting material (typically 1-10 mg of protein is recommended for ubiquitinome profiling) [29] [8].
Q4: Can I use a single specific DUB inhibitor instead of a cocktail? For targeted studies of a specific DUB, a selective inhibitor can be used. However, for global ubiquitinome profiling, a cocktail is strongly advised. The human genome encodes approximately 100 DUBs, which belong to different protease families. A broad-spectrum inhibitor is necessary to effectively block this diverse enzymatic activity and prevent the erasure of ubiquitin signatures from a wide range of substrates [8].
Troubleshooting Guide
The following table outlines common problems, their potential causes, and recommended solutions related to combating DUB activity.
Table 1: Troubleshooting DUB Inhibition and Lysis Issues
| Problem | Potential Cause | Recommended Solution |
|---|---|---|
| Low ubiquitination site identification | Ineffective or degraded DUB inhibitors | Aliquot inhibitors to avoid freeze-thaw cycles; add fresh inhibitors to lysis buffer for each experiment. |
| High background in MS analysis | Incomplete protein denaturation during lysis | Include 1-2% SDS or 2-4 M urea in the lysis buffer to ensure rapid and complete denaturation. |
| Inconsistent results between replicates | Variable lysis conditions or times | Standardize the lysis protocol: keep buffer ice-cold, use consistent vortexing/pipetting, and maintain uniform lysis duration. |
| Poor cell lysis efficiency | Mild lysis buffer composition | Use a combination of ionic (e.g., 150 mM NaCl) and non-ionic detergents; consider brief sonication on ice. |
| Loss of specific ubiquitin linkages | Incomplete DUB inhibition | Utilize a cocktail like PR-619 with a proteasome inhibitor (Bortezomib) to broadly block DUB and proteasomal activity [29]. |
Experimental Protocol: DUB-Inhibited Sample Preparation for Ubiquitinome Analysis
This protocol is designed for the preparation of cell culture samples to preserve ubiquitination states for subsequent diGly peptide enrichment and mass spectrometry analysis [11] [29].
Materials & Reagents
- Lysis Buffer (example): 50 mM Tris-HCl (pH 7.5), 150 mM NaCl, 1% SDS, 5 mM EDTA, 10 µM PR-619, 10 µM MG-132, 1x Protease Inhibitor Cocktail (without EDTA).
- Phosphate-Buffered Saline (PBS), ice-cold.
- BCA Protein Assay Kit.
Procedure
- Pre-chill Equipment: Ensure centrifuges, rotors, and microtubes are pre-cooled.
- Prepare Lysis Buffer: Add DUB and protease inhibitors to the lysis buffer immediately before use.
- Wash Cells: Aspirate culture media from cell pellets and wash cells twice with ice-cold PBS.
- Lyse Cells:
- Add an appropriate volume of lysis buffer to the cell pellet (e.g., 500 µL per 10 million cells).
- Vortex vigorously for 10-15 seconds to ensure complete homogenization.
- Incubate and Denature: Place the lysate on a rotator for 10 minutes at 4°C. For complete denaturation, you may heat the samples at 95°C for 5 minutes.
- Clarify Lysate: Centrifuge the lysate at 14,000-16,000 × g for 15 minutes at 4°C.
- Collect Supernatant: Transfer the clarified supernatant to a new, pre-chilled tube.
- Determine Protein Concentration: Quantify the protein concentration using a BCA assay. The resulting lysate is now ready for downstream processing, such as tryptic digestion and K-ɛ-GG peptide enrichment.
Research Reagent Solutions
The following table lists key reagents essential for successful experimentation in this field.
Table 2: Essential Reagents for Combating DUB Activity
| Reagent | Function in Experiment | Example Product/Catalog Number |
|---|---|---|
| Broad-spectrum DUB Inhibitor | Pan-DUB inhibition to preserve ubiquitin chains | PR-619 (e.g., Sigma-Aldrich, SML0430) |
| Proteasome Inhibitor | Stabilizes K48-linked polyubiquitinated proteins by blocking proteasomal degradation | Bortezomib (e.g., UBPbio, FJ-9000) [29] |
| K-ɛ-GG Motif Antibody | Immunoaffinity enrichment of ubiquitinated peptides for MS | PTMScan Ubiquitin Remnant Motif Kit (Cell Signaling Tech, 5562) [11] [29] |
| SDS (Sodium Dodecyl Sulfate) | Strong denaturant for instantaneous protein denaturation and enzyme inactivation during lysis | Sigma-Aldress (e.g., L-5125) [29] |
| Iodoacetamide | Alkylating agent for cysteine residues; prevents disulfide bond formation after reduction | Sigma-Aldrich (e.g., I6125) [29] |
Experimental Workflow for DUB-Inhibited Sample Prep
The diagram below illustrates the critical steps for preparing samples while minimizing DUB activity.
Sample Prep Workflow
Addressing Incomplete Digestion and Missed Cleavages
In mass spectrometry-based proteomics, the complete and reproducible digestion of proteins into peptides is a critical step for successful analysis. This is especially crucial when identifying post-translational modifications like ubiquitination, where the target peptides carry essential diagnostic information. Incomplete digestion and missed cleavages can severely compromise protein identification, quantification accuracy, and the reliable mapping of modification sites. This guide addresses the common challenges of incomplete proteolysis and provides targeted troubleshooting strategies to enhance the quality of your sample preparation, particularly within ubiquitination research.
Troubleshooting Guide: Common Digestion Problems & Solutions
Q1: What are the primary causes of incomplete digestion or high rates of missed cleavages, and how can I fix them?
Incomplete digestion manifests as a high percentage of peptides with missed cleavage sites, leading to reduced protein coverage, ambiguous identifications, and poor quantification. The underlying causes and their solutions are multi-faceted.
Inefficient Protease Activity:
- Cause: Using a protease with low purity or specificity, or one that is inhibited by common sample components (e.g., detergents, denaturants).
- Solution: Use high-purity, mass spectrometry-grade proteases. Consider alternative proteases or protease mixes. For example, supplementing trypsin with Lys-C can significantly reduce missed cleavages, particularly at lysine residues, and improve tolerance to common trypsin-inhibiting agents like guanidine hydrochloride [62]. A combination of Lys-C followed by trypsin digestion has been shown to achieve missed cleavage rates of less than 10%, even on high-resolution instruments [63].
Suboptimal Digestion Conditions:
- Cause: Incorrect pH, temperature, or digestion time can lead to poor protease performance and incomplete cleavage.
- Solution: Follow optimized, standardized protocols. For complex samples, a dual-protease approach (Lys-C/trypsin) is highly effective. Performing digestion at higher temperatures (e.g., 70°C) with thermostable protease formulations can enhance protein unfolding and increase enzymatic activity, enabling rapid digestion in as little as 30-60 minutes [62].
Incomplete Protein Denaturation, Reduction, and Alkylation:
- Cause: If proteins are not fully unfolded and disulfide bonds are not broken and permanently blocked, the protease cannot access all cleavage sites.
- Solution: Ensure robust denaturation using high-quality buffers and sonication. Verify that reduction (e.g., with DTT) and alkylation (e.g., with iodoacetamide) are complete. Monitoring these steps with an internal control protein, or "Digestion Indicator," can help compare efficiency across experiments [63].
Presence of Protease Inhibitors:
- Cause: Contamination from protease inhibitor cocktails used during cell lysis.
- Solution: Avoid introducing protease inhibitors prior to the digestion step, or ensure they are thoroughly removed or inactivated. The Trypsin/Lys-C mix demonstrates superior performance even in samples contaminated with protease inhibitors [62].
Q2: Why is my ubiquitination site coverage poor, even after enrichment?
While enrichment is crucial for detecting low-abundance ubiquitinated peptides, the quality of the underlying digest is equally important.
- Cause: The di-glycine (GG) remnant left on a modified lysine after tryptic digestion makes the site refractory to further trypsin cleavage [5] [17] [35]. This results in longer, more hydrophobic peptides with missed cleavages, which can ionize poorly and complicate MS/MS spectra. Furthermore, general incomplete digestion obscures the ubiquitination signal with a background of unmodified, partially digested peptides.
- Solution:
- Optimize Digestion for Ubiquitinomics: The standard trypsin-only digestion is often suboptimal. Adopting a Lys-C/trypsin sequential digest is highly recommended. Lys-C cleaves efficiently at lysine residues even under denaturing conditions and can help mitigate the issue of trypsin's inefficiency at ubiquitin-modified lysine clusters [62] [63].
- Use "Planned Digestion": For challenging targets, intentionally manipulating digestion conditions can be beneficial. Regulating trypsin incubation time to induce specific missed cleavages can generate peptides of optimal length and composition for more confident MS/MS identification [64]. This approach requires careful optimization and in-silico peptide analysis.
Experimental Protocols for Improved Digestion
Protocol: Sequential Lys-C/Trypsin Digestion for Ubiquitinome Analysis
This protocol is adapted from established methods for robust, reproducible protein digestion [63] [35].
Protein Extraction and Denaturation:
- Lyse cells or tissue in a suitable buffer (e.g., 8 M urea or a proprietary MS-compatible lysis buffer).
- Heat the lysate at 95°C for 5-10 minutes, followed by sonication to ensure complete protein extraction and denaturation.
- Centrifuge to remove insoluble debris.
Reduction and Alkylation:
- Add a reducing agent (e.g., DTT to 5-10 mM) and incubate at 37-60°C for 30-60 minutes.
- Alkylate with iodoacetamide (e.g., 15-20 mM) in the dark at room temperature for 30 minutes.
- Quality Control Tip: Confirm >99% alkylation efficiency by reviewing MS data for carbamidomethylation coverage [63].
Lys-C Digestion:
- Dilute the sample if necessary to reduce urea concentration.
- Add Lys-C protease at a recommended ratio (e.g., 1:100 w/w) and incubate at 25-37°C for 2-4 hours.
Trypsin Digestion:
- Further dilute the sample to a urea concentration compatible with trypsin (<2 M).
- Add trypsin at a recommended ratio (e.g., 1:50 w/w) and incubate at 37°C overnight or for 4-6 hours.
- Quality Control Tip: Acidify the sample to stop digestion and monitor missed cleavage rates, aiming for <10% [63].
Peptide Clean-up:
- Desalt peptides using C18 solid-phase extraction cartridges or StageTips before LC-MS/MS analysis [35].
Workflow: Optimizing Digestion for Ubiquitination Site Mapping
The following diagram visualizes the decision-making process for optimizing protein digestion to improve ubiquitination site identification.
Performance Comparison of Digestion Strategies
The table below summarizes quantitative data from comparative studies of different sample preparation methods, highlighting the impact on key performance metrics.
Table 1: Comparative Performance of Mass Spectrometry Sample Preparation Methods
| Method | Number of Proteins Identified | Number of Unique Peptides | Missed Cleavages (%) | Key Characteristics |
|---|---|---|---|---|
| Pierce Kit (Lys-C/Trypsin) [63] | 3,964 ± 22 | 19,902 ± 190 | 7.3 ± 0.1 | Optimized, standardized protocol; high reproducibility. |
| Filter-Assisted Sample Prep (FASP) [63] | 3,894 ± 13 | 18,738 ± 128 | 13.9 ± 1.2 | Many long centrifugation steps; may require detergent removal. |
| AmBic/SDS [63] | 3,716 ± 79 | 17,401 ± 587 | 17.5 ± 1.3 | May not be easily scalable; requires detergent removal. |
| Urea Extraction [63] | 3,756 ± 91 | 19,398 ± 689 | 9.8 ± 1.0 | Urea must be fresh to avoid protein carbamylation. |
| Trypsin Only (Yeast digest) [62] | Not Specified | Not Specified | 22.2 (18.6% at K) | High rate of missed cleavages, particularly at lysine residues. |
| Trypsin/Lys-C Mix (Yeast digest) [62] | Not Specified | Not Specified | ~4.0 | Dramatic reduction in missed cleavages. |
The Scientist's Toolkit: Key Research Reagents
Table 2: Essential Reagents for Optimizing Protein Digestion
| Reagent / Tool | Function | Application in Ubiquitination Studies |
|---|---|---|
| Trypsin, Mass Spec Grade | High-purity serine protease that cleaves C-terminal to arginine and lysine. | Standard workhorse for bottom-up proteomics; its inefficiency at modified lysines is a key challenge in ubiquitinomics [62]. |
| Lys-C Protease | Protease that cleaves specifically at the C-terminal of lysine residues. | Active under denaturing conditions (e.g., 8 M urea). Used alone or in a mix with trypsin to improve cleavage efficiency and reduce missed cleavages [62] [63]. |
| Trypsin/Lys-C Mix | A predefined mixture of both proteases. | Simplifies protocol while ensuring efficient cleavage at both arginine and lysine, significantly improving digestion completeness [62]. |
| Rapid Trypsin | A thermostable trypsin formulation. | Enables fast digestion (30-60 min) at elevated temperatures (70°C), enhancing protein unfolding and protease activity [62]. |
| PNGase F | Glycosidase that removes N-linked glycans. | Critical for analyzing glycoproteins; converts Asn to Asp at glycosylation sites, introducing a mass shift detectable by MS [62]. |
| IdeS/IdeZ Proteases | Immunoglobulin-degrading enzymes that cleave IgG at a specific site below the hinge. | Essential for the detailed analysis of therapeutic antibodies, generating defined fragments (F(ab')2 and Fc/2) for MS characterization [62]. |
| K-ε-GG Antibody | Antibody specifically recognizing the diglycine remnant on ubiquitinated lysines. | The core enrichment tool for ubiquitination site mapping by immunoaffinity purification of modified peptides [35]. |
| Digestion Indicator | A non-mammalian control protein spiked into samples. | Used to monitor and compare the efficiency and reproducibility of the sample preparation workflow across multiple experiments [63]. |
Antibody Cross-linking to Reduce Contaminating Antibody Fragments
In mass spectrometry-based ubiquitination research, the presence of contaminating antibody fragments in immunoprecipitation (IP) samples represents a critical analytical challenge. These fragments compete for ionization, suppress signals from low-abundance ubiquitinated peptides, and generate complex mass spectra that complicate data interpretation. When the primary research goal is the identification of ubiquitination sites rather than protein-protein interactions, stringent washes and extended incubation times are often employed to maximize target protein binding, which increases the risk of antibody leakage into the eluate. Covalent cross-linking of antibodies to the solid support matrix effectively eliminates this contamination source, preserving the analytical sensitivity needed to detect low-abundance ubiquitinated species.
Troubleshooting Guides
Common Problems and Solutions
Problem: High Background Contamination in MS Spectra After IP
- Potential Cause: Leaching of non-covalently bound antibodies from the IP matrix.
- Solution: Implement covalent cross-linking using BS³ or DMP. BS³ generally provides lower non-specific binding [65].
- Prevention: Always cross-link antibodies when subsequent mass spectrometry analysis is planned, especially for low-abundance targets.
Problem: Poor Recovery of Target Antigen After Cross-Linking
- Potential Cause: Over-cross-linking may block antigen-binding sites.
- Solution: Titrate cross-linker concentration. Studies show that reducing BS³ to half the manufacturer's recommended concentration can maintain excellent signal-to-noise ratio while conserving reagents [65].
- Alternative: Test different cross-linker chemistries; DMP may provide higher target yield in some cases [65].
Problem: Incomplete Elution of Target Protein Compromises Ubiquitination Site Mapping
- Potential Cause: Conventional glycine- or urea-based elution buffers are insufficient for complete protein recovery.
- Solution: Use 2% hot SDS for complete elution, then dilute to 0.2% final concentration in urea buffer containing 4% CHAPS for compatible 2D-PAGE separation [65].
- Verification: Compare elution efficiency by western blot before proceeding to mass spectrometry.
Cross-linker Selection Guide
Table 1: Comparison of Common Antibody Cross-linking Reagents
| Cross-linker | Chemistry | Key Advantages | Limitations | Optimal Use Cases |
|---|---|---|---|---|
| BS³ (Bis[sulfosuccinimidyl] suberate) | NHS-ester targets primary amines | • Minimal non-specific binding• Complete elimination of Ig leakage• Excellent for MS applications | • Higher cost• May reduce target yield in some cases• Reacts with serines, threonines, tyrosines | High-sensitivity ubiquitination studies where background contamination must be minimized |
| DMP (Dimethyl pimelimidate) | Diimido ester targets primary amines | • Higher overall target protein yield• Lower cost• Preference for ε-amines of lysines at pH 9-10 | • Higher non-specific protein binding• May not completely eliminate Ig leakage | When target protein abundance is very low and maximum recovery is essential |
Experimental Protocols
Standardized Protocol for Antibody Cross-linking to Magnetic Beads
Principle: Covalent immobilization of antibodies to Protein A/G magnetic beads prevents co-elution of antibody fragments during IP, thereby reducing MS background and improving ubiquitinated peptide detection.
Materials:
- Magnetic Protein A or G beads (e.g., Dynabeads)
- Purified antibody
- Cross-linker: BS³ or DMP
- PBS-T (PBS with 0.02% Tween-20)
- Quenching buffer (20-50 mM Tris-HCl, pH 7.5)
- Washing buffers
Procedure:
- Antibody Binding: Incubate antibody with magnetic beads in PBS for 30-60 minutes at room temperature with gentle rotation.
- Washing: Wash beads twice with PBS to remove unbound antibody.
- Cross-linking:
- Quenching: Add Tris-HCl quenching buffer (20-50 mM final concentration) and incubate for 15 minutes.
- Final Washes: Wash beads twice with PBS-T and once with desired IP buffer.
- Storage: Resuspend in storage buffer with preservative at 4°C.
Troubleshooting Notes:
- If antigen binding efficiency decreases after cross-linking, reduce cross-linking reaction time or concentration.
- Always include a non-cross-linked control when establishing the protocol.
- For BS³, cost-saving can be achieved by reducing concentration without significant performance loss [65].
Efficient Target Elution for Ubiquitination Site Mapping
Materials:
- Elution buffer 1: 2% SDS, 50 mM Tris-HCl (pH 7.5)
- Elution buffer 2: 8 M Urea, 4% CHAPS, 50 mM Tris-HCl (pH 8.0)
- Heating block (95°C)
Procedure:
- After final IP washes, resuspend beads in 2% SDS elution buffer.
- Heat at 95°C for 5-10 minutes with occasional vortexing.
- Separate supernatant (contains eluted protein) from beads using magnetic stand.
- Dilute eluate 10-fold with urea/CHAPS buffer (final SDS concentration 0.2%).
- Process for tryptic digestion and diGly peptide enrichment [29].
Validation: Compare elution efficiency with conventional low-pH glycine elution by western blot to verify improvement.
Workflow Integration for Ubiquitination Studies
The following diagram illustrates how antibody cross-linking integrates into the complete workflow for ubiquitination site identification, highlighting its critical role in reducing MS contamination:
Frequently Asked Questions
Q1: Why is antibody cross-linking particularly important for ubiquitination site mapping compared to other post-translational modification studies? A: Ubiquitinated peptides are typically low in abundance and exhibit poor ionization efficiency compared to unmodified peptides. Contaminating antibody fragments further suppress these already weak signals and complicate MS/MS spectra, making ubiquitination site identification particularly challenging. Cross-linking eliminates this major contamination source [65] [29].
Q2: Can I use the same cross-linking protocol for all antibody types? A: While the basic protocol works for most IgG antibodies, optimization may be needed for different species or antibody classes. Protein A has varying affinity for different IgG subclasses, which may affect cross-linking efficiency. Always verify cross-linking efficiency by testing for antibody leakage in the eluate via western blot.
Q3: How does cross-linking affect the reusability of IP beads for ubiquitination studies? A: Cross-linked beads can typically be reused 3-5 times without significant loss of activity. However, for ubiquitination studies where quantitative recovery is critical, it's recommended to use fresh beads for each experiment as the elution conditions (2% hot SDS) may gradually reduce binding capacity over time.
Q4: What is the impact of cross-linker choice on downstream diGly peptide enrichment? A: BS³ is generally preferred as it produces less non-specific binding, resulting in cleaner samples for diGly enrichment. The reduced background improves antibody efficiency during the diGly immunocapture step, potentially increasing ubiquitination site identifications [65] [29].
Q5: How can I verify that my cross-linking protocol has been successful? A: The most straightforward verification is analyzing the final eluate by SDS-PAGE with silver staining or western blot. Successful cross-linking should eliminate heavy and light antibody chain bands in the eluate while maintaining strong target protein signal.
Research Reagent Solutions
Table 2: Essential Materials for Antibody Cross-linking and Ubiquitination Studies
| Reagent/Category | Specific Examples | Function/Application | Considerations for Ubiquitination Studies |
|---|---|---|---|
| Cross-linking Reagents | BS³ (Bis[sulfosuccinimidyl] suberate), DMP (Dimethyl pimelimidate) | Covalent immobilization of antibodies to solid support | BS³ offers lower background; DMP may provide higher target yield |
| Solid Support Matrices | Magnetic Protein A/G beads (e.g., Dynabeads) | Platform for antibody immobilization and target capture | Magnetic beads facilitate stringent washing with minimal carry-over |
| Elution Buffers | 2% SDS, Glycine-HCl (pH 2.5-2.8), Urea-based buffers | Release of bound target protein from IP complex | Harsh SDS elution provides complete recovery for low-abundance targets |
| diGly Enrichment Materials | Anti-diGly antibodies (e.g., PTMScan Ubiquitin Remnant Motif Kit) | Immunoaffinity enrichment of ubiquitinated peptides | Critical for enhancing detection of low-stoichiometry ubiquitination sites |
| Mass Spec Standards | Heavy labeled lysine/arginine (SILAC), Ubiquitin affinity matrices | Quantification and quality control | Enable accurate quantification of ubiquitination dynamics |
Proper antibody cross-linking is not merely an optional refinement but an essential step in generating publication-quality data for ubiquitination site mapping. By eliminating antibody-derived contamination, researchers can significantly improve signal-to-noise ratios in mass spectrometry analyses, enabling detection of low-abundance ubiquitination events. The integration of robust cross-linking methods with efficient elution protocols and sensitive diGly enrichment creates an optimized workflow capable of uncovering the complex ubiquitination landscape that regulates critical cellular processes.
Optimizing LC-MS/MS Parameters for diGly Peptide Detection
FAQs on Troubleshooting diGly Peptide Analysis
What are the most critical MS parameters to optimize for improved diGly peptide sensitivity?
For optimal diGly peptide detection, focus on data-dependent acquisition (DDA) settings that match your chromatographic peak widths. Key parameters include dynamic exclusion duration, minimum MS signal threshold, and collision energy.
- Dynamic Exclusion: Set to 60 seconds for fast separations to prevent re-sampling of dominant peptides [66] [67].
- MS Signal Threshold: Adjust to ensure detection of lower-abundance diGly peptides, not just the most intense ions [66].
- Acquisition Cycle Time: Keep it short (e.g., 3 seconds) to generate sufficient data points across narrow chromatographic peaks [66].
- Collision Energy: Optimized energy of 30% has been successfully used for diGly peptide fragmentation [67].
My diGly peptide yields are low despite sufficient starting material. What sample preparation issues should I investigate?
Low yields often trace to sample preparation pitfalls. The table below outlines critical troubleshooting areas:
Table: Troubleshooting Low diGly Peptide Yields
| Problem Area | Specific Issue | Solution |
|---|---|---|
| Lysis & Denaturation | Use of PEG-based surfactants (Tween, Triton) [68] | Avoid surfactants; use 0.5% sodium deoxycholate with boiling [67]. |
| Digestion Efficiency | Suboptimal trypsin activity or autolysis [69] | Use recombinant trypsin; optimize buffer, time, and temperature [69]. |
| Peptide Loss | Adsorption to plastic/glass vials [68] | Use "high-recovery" vials; avoid complete drying of samples [68]. |
| Enrichment Specificity | Inefficient antibody binding or wash [70] | Cross-link antibodies to beads; perform multiple washes with IAP buffer [67]. |
Additionally, ensure you are using the correct ubiquitin remnant motif antibody to enrich for the tryptic diGly (K-ε-GG) remnant, and perform a crude pre-fractionation (e.g., into 3 fractions via high-pH reversed-phase chromatography) prior to immunoprecipitation to reduce sample complexity [70] [67].
I observe intense background and polymer contaminants in my spectra. How can I reduce this contamination?
Background contamination commonly arises from polymers and keratins.
- Polymers (PEGs, polysiloxanes): Sources include pipette tips, chemical wipes, and skin creams. Recognizable by regular peak spacing (44 Da for PEG, 77 Da for PS). Use mass spectrometry-grade water and solvents, and avoid all detergents and surfactants during sample prep [68].
- Keratins: Introduce from skin, hair, and dust. Over 25% of peptide content can be keratin-derived. Prevent by wearing gloves, using laminar flow hoods, and avoiding natural fiber clothing (e.g., wool) in the lab [68].
- Chemical Contaminants: Urea in buffers can decompose and cause carbamylation of peptide amines. Use high-purity reagents and consider alternative denaturants like guanidine HCl [68] [69].
What chromatographic conditions are optimal for separating diGly peptides?
Optimal LC separation maximizes peak capacity and minimizes peak width.
- Column Temperature: Maintain at a uniform, elevated temperature (e.g., 50°C) to improve chromatographic reproducibility and peak shape [67].
- Mobile Phase: Use formic acid instead of TFA for acidification, as TFA can significantly suppress peptide ionization [68].
- Gradient: Employ a shallow gradient to achieve sufficient separation of complex peptide mixtures. For fast gradients with high flow rates, ensure your DDA settings are adjusted to acquire enough MS/MS spectra across narrower peaks [66].
How can I validate that my detected signals are truly from diGly peptides and not interference?
- MRM Pairs: If using targeted MS, optimize at least two multiple reaction monitoring (MRM) transitions for each diGly peptide. Use one for quantification and a second for confirmation. The ratio between the two transitions should match that of the pure standard [71].
- Database Search Parameters: In your search engine (e.g., MaxQuant), specify diglycine (diGly) as a variable modification on lysine and allow for three missed cleavages. The software will then look for the specific 114.04293 Da mass shift on lysine [67] [72].
Optimized Experimental Protocols
Protocol 1: Sample Preparation for Large-Scale Ubiquitinome Analysis
This protocol is adapted for the detection of tens of thousands of ubiquitination sites from cell lines or tissue [70] [67].
- Cell Lysis: Lyse cell pellet in ice-cold lysis buffer (e.g., 50 mM Tris HCl, 0.5% sodium deoxycholate). Boil the lysate at 95°C for 5 minutes, then sonicate at 4°C for 10 minutes.
- Protein Quantification: Determine protein concentration using a colorimetric assay (e.g., BCA assay). Several milligrams of protein are typically required for successful diGly peptide immunoprecipitation.
- Reduction and Alkylation:
- Reduce with 5 mM DTT for 30 minutes at 50°C.
- Alkylate with 10 mM iodoacetamide for 15 minutes in the dark.
- Protein Digestion:
- Digest first with Lys-C for 4 hours.
- Follow with trypsin digestion overnight at 30°C.
- Peptide Pre-Fractionation:
- Acidify the digest to 0.5% TFA to precipitate detergents. Centrifuge and collect the supernatant.
- Fractionate peptides using high-pH reversed-phase chromatography (e.g., C18), eluting with step gradients of acetonitrile (e.g., 7%, 13.5%, 50%) in 10 mM ammonium formate [67].
- Immunoaffinity Enrichment (diGly IP):
- Incubate peptide fractions with anti-K-ε-GG antibody conjugated to beads for 2 hours at 4°C.
- Wash beads thoroughly with ice-cold IAP buffer, followed by ice-cold water.
- Elute peptides with 0.15% TFA.
- Desalting: Desalt the enriched peptides using C18 StageTips before LC-MS/MS analysis.
Protocol 2: LC-MS/MS Data Acquisition for diGly Peptides
This protocol is designed for sensitive detection of enriched diGly peptides [66] [67].
- Chromatography:
- Column: C18 reversed-phase nanoflow column, maintained at 50°C.
- Gradient: Use a linear gradient from 5% to 50% acetonitrile in 0.1% formic over 12.5-90 minutes, depending on desired separation depth.
- Mass Spectrometer Setup:
- Operate in data-dependent acquisition (DDA) mode.
- MS1: Collect high-resolution (e.g., 60,000-120,000) spectra with an AGC target of 3e6-4e5 and a maximum injection time of 50-100 ms.
- Data-Dependent MS2:
- To maximize identifications, perform two DDA runs on the same sample:
- Run 1 (Most Intense First): Fragment the most intense precursors first using a top-speed method with a 3-second cycle time.
- Run 2 (Least Intense First): Fragment the least intense precursors first to target low-abundance peptides [67].
- Isolation Window: 1.6 Th.
- Fragmentation: HCD with collision energy optimized at 30% [67].
- MS2 Resolution: Collect in the ion trap for speed (with AGC target 1e4) or in the Orbitrap for higher resolution and accuracy.
- Dynamic Exclusion: 60 seconds.
- To maximize identifications, perform two DDA runs on the same sample:
Data Presentation: Optimal Parameter Tables
Table 1: Optimized DDA Parameters for Fast LC-MS/MS of diGly Peptides
| Parameter | Sub-Optimal Setting | Optimized Setting | Impact of Optimization |
|---|---|---|---|
| Dynamic Exclusion | 30 sec or Off [66] | 60 sec [67] | Prevents re-sampling of abundant ions, increasing coverage [66]. |
| MS1 Resolution | 30,000 | 60,000 - 120,000 | Improved accuracy for precursor charge state and mass assignment. |
| MS1 AGC Target | 3e5 | 4e5 [67] | Better sensitivity for low-abundance precursors. |
| Cycle Time | > 3 sec | ≤ 3 sec [67] | Ensures sufficient MS/MS events across narrow chromatographic peaks [66]. |
| Collision Energy | Default (e.g., 28-32%) | 30% (HCD) [67] | Improved fragmentation efficiency for diGly-modified peptides. |
Table 2: Key Reagents and Materials for diGly Peptide Analysis
| Reagent / Material | Function / Role | Recommendation / Note |
|---|---|---|
| Anti-K-ε-GG Antibody | Immunoaffinity enrichment of diGly-modified peptides. | Cross-link to protein A agarose beads to reduce antibody leaching [70] [67]. |
| Sodium Deoxycholate | Lysis and denaturation of proteins. | Compatible with MS; precipitates in acid for easy removal [67]. |
| Recombinant Trypsin | Protein digestion. | Reduces autolysis peaks and improves digestion efficiency compared to porcine trypsin [69]. |
| C18 Stationary Phase | Peptide desalting and fractionation. | Used for both high-pH fractionation and StageTip desalting [67]. |
| IAP Buffer | Washing buffer for immuno-enrichment. | Removes non-specifically bound peptides during the bead wash steps [67]. |
Workflow and Pathway Visualizations
Validating Your Findings and Choosing Quantitative Approaches
Within the framework of a broader thesis on troubleshooting ubiquitination site identification by mass spectrometry, this guide addresses common experimental challenges. Orthogonal validation—the practice of verifying results using a method independent of the original technique—is paramount for ensuring the specificity of your antibodies and the accuracy of your findings in ubiquitination research. This technical support center provides targeted FAQs and troubleshooting guides to help researchers navigate the complexities of validating protein ubiquitination.
FAQs: Core Concepts and Troubleshooting
1. What is orthogonal validation and why is it critical in ubiquitination research?
Orthogonal validation is a strategy where data from an antibody-based experiment (e.g., western blot) is corroborated by a method that does not rely on antibodies [73] [74]. This is crucial because it helps identify artifacts specific to the antibody-based method, thereby controlling for bias and providing more conclusive evidence of target specificity [74]. In the context of ubiquitination, where stoichiometry is low and antibody cross-reactivity can be an issue, this practice is essential for verifying the identity of ubiquitinated substrates and the specificity of reagents.
2. My western blot for a ubiquitinated protein shows multiple bands. How can I determine which is the correct one?
Multiple bands can arise from non-specific antibody binding, protein degradation, or different ubiquitination states (mono vs. polyubiquitination). To troubleshoot, employ the following orthogonal strategies:
- Genetic Validation (siRNA Knockdown): Transfert cells with siRNA targeting your protein of interest. A specific antibody should show a corresponding decrease in signal intensity for the true target band. A successful knockdown is typically defined as at least 50% reduction in signal [75].
- Mutational Analysis: Mutate the putative ubiquitination lysine residue(s) to arginine. A true ubiquitination signal will diminish or show a characteristic band shift upon mutation [8] [76].
- Mass Spectrometry (MS): The most direct method. Excise the band of interest from the gel and subject it to LC-MS/MS analysis. This will confirm the protein's identity and can precisely map the ubiquitination site(s) via the detection of the diGly (K-ε-GG) remnant on modified lysines, which adds a 114.043 Da mass shift [5] [10] [17].
3. I am not identifying any ubiquitination sites via mass spectrometry. What are the potential causes?
The low stoichiometry of endogenous ubiquitination makes enrichment essential. The table below outlines common issues and solutions.
Table: Troubleshooting Ubiquitination Site Identification by Mass Spectrometry
| Problem Area | Potential Cause | Proposed Solution |
|---|---|---|
| Sample Preparation | Active deubiquitinases (DUBs) during lysis | Use more stringent lysis conditions (e.g., boiling in 1% SDS/Sodium Deoxycholate) and consider adding DUB inhibitors, though note some protocols advise against N-ethylmaleimide (NEM) as it may introduce unwanted modifications [10]. |
| Enrichment | Insufficient starting material | Use several milligrams of protein lysate as starting point for diGly peptide immunoprecipitation [10]. |
| Inefficient enrichment of ubiquitinated peptides | Use high-quality, validated antibodies against the K-ε-GG motif. Offline high-pH reverse-phase fractionation of peptides prior to diGly enrichment can significantly improve depth of analysis [10]. | |
| MS Sensitivity | High background of non-modified peptides | Use tandem affinity purification (e.g., His-biotin tag) to reduce contaminants [8] [5]. Ensure thorough cleanup of detergents post-digestion to prevent interference with LC-MS [10]. |
4. How can I validate a ubiquitin linkage-specific antibody?
Linkage-specific antibodies (e.g., for K48 or K63 chains) are powerful but require rigorous testing.
- Use Defined Ubiquitin Chains: Test the antibody against a panel of recombinant homotypic ubiquitin chains (K48, K63, K11, etc.) via western blot. A specific antibody should only recognize its intended linkage [8].
- Cell-Based Models: Utilize cell lines or conditions known to produce specific ubiquitin linkages. Correlate antibody signal with data from an orthogonal method, such as mass spectrometry-based linkage quantification [8] [1].
- Genetic Manipulation: Overexpress or knock down enzymes (E2/E3) known to generate a specific chain type and observe the corresponding change in antibody signal [8].
Experimental Protocols for Key Orthogonal Methods
Protocol 1: Orthogonal Validation of Western Blot Using Public Transcriptomic Data
This protocol uses publicly available RNA data to select cell lines for validating antibody specificity in western blot [73] [74].
- Consult RNA Database: Access a resource like the Human Protein Atlas or DepMap Portal to find RNA expression data (in nTPM - Transcripts Per Million) for your target protein across multiple cell lines.
- Select Binary Model: Choose at least two cell lines: one with high RNA expression and one with low/no RNA expression of the target gene. A five-fold or greater difference in expression is ideal [75].
- Perform Western Blot: Prepare protein lysates from the selected cell lines and perform western blot using the antibody under validation.
- Interpret Results: The antibody signal should correlate with the RNA expression data. Strong signal should be present in the high RNA-expressing cell line and minimal to no signal in the low-expressing line. This confirms the antibody is detecting the intended target.
Protocol 2: Identification of Ubiquitination Sites by DiGly Peptide Enrichment and Mass Spectrometry
This is a refined workflow for deep ubiquitinome analysis [10].
- Cell Culture and Lysis:
- Grow cells (e.g., HeLa), optionally treating with a proteasome inhibitor (e.g., 10 µM Bortezomib for 8h) to accumulate ubiquitinated proteins.
- Lyse cells in ice-cold 50 mM Tris-HCl (pH 8.2) with 0.5% Sodium Deoxycholate (DOC). Boil the lysate at 95°C for 5 minutes and sonicate.
- Protein Digestion:
- Quantify protein concentration. Reduce proteins with 5 mM DTT (50°C, 30 min) and alkylate with 10 mM Iodoacetamide (15 min in dark).
- Digest proteins first with Lys-C (1:200 enzyme-to-substrate, 4h) followed by trypsin (1:50, overnight at 30°C).
- Peptide Cleanup and Fractionation:
- Acidify the digest with 0.5% TFA to precipitate DOC. Centrifuge and collect the supernatant.
- For deep coverage, fractionate peptides using offline high-pH reverse-phase C18 chromatography. Elute into 3-5 fractions (e.g., with 7%, 13.5%, and 50% acetonitrile in 10 mM ammonium formate, pH 10) and lyophilize.
- DiGly Peptide Immunoprecipitation:
- Reconstitute lyophilized fractions in immunoaffinity purification (IAP) buffer.
- Incubate with anti-K-ε-GG antibody conjugated to protein A agarose beads for several hours at 4°C.
- Wash beads extensively with IAP buffer and then with water. Elute diGly peptides with 0.1-0.2% TFA.
- Mass Spectrometric Analysis:
- Analyze the enriched peptides on an Orbitrap mass spectrometer coupled to a nanoflow LC system.
- Use data-dependent acquisition methods with advanced fragmentation settings (e.g., HCD) for optimal peptide identification.
- Search the resulting MS/MS spectra against a protein database, specifying the diGly modification (K-ε-GG, +114.043 Da) as a variable modification.
The Scientist's Toolkit: Research Reagent Solutions
Table: Essential Reagents for Ubiquitination Research
| Reagent | Function in Ubiquitination Research | Key Considerations |
|---|---|---|
| K-ε-GG (diGly) Antibody | Immunoaffinity enrichment of ubiquitinated peptides from tryptic digests for mass spectrometry [10]. | Critical for sensitivity. Quality varies; choose a vendor with rigorous validation data. |
| Tagged-Ubiquitin Plasmids (e.g., His, HA, FLAG, Strep) | Overexpression of tagged ubiquitin in cells allows for affinity-based purification of ubiquitinated proteins under denaturing conditions [8] [5] [17]. | His-tags can co-purify endogenous His-rich proteins. Strep-tag offers an alternative. |
| Linkage-Specific Ubiquitin Antibodies (e.g., α-K48, α-K63) | Detect specific polyubiquitin chain topologies by western blot or immunofluorescence [8]. | Must be validated with defined ubiquitin chains to confirm linkage specificity and avoid cross-reactivity. |
| Tandem Ubiquitin-Binding Entities (TUBEs) | Recombinant proteins with high affinity for polyubiquitin chains. Used to protect ubiquitinated proteins from deubiquitinases and enrich them from lysates [8]. | Useful for native purifications and studying protein complexes. |
| Proteasome Inhibitors (e.g., Bortezomib, MG132) | Block degradation of polyubiquitinated proteins, leading to their accumulation and facilitating detection [10]. | Can induce cellular stress; optimize concentration and treatment time. |
Workflow Visualization
The following diagram illustrates a logical workflow for orthogonal validation in ubiquitination studies, integrating the methods discussed above.
Orthogonal Validation Pathways for Ubiquitination Studies
Implementing SILAC and TMT for Quantitative Ubiquitinome Profiling
Quantitative ubiquitinome profiling presents a significant technical challenge for researchers investigating the ubiquitin-proteasome system. The dynamic nature of protein ubiquitination, combined with low stoichiometry of modified species and the rapid deubiquitination by active deubiquitinases (DUBs), creates substantial bottlenecks in experimental workflows [17] [33]. This technical support center addresses these challenges through optimized protocols integrating Stable Isotope Labeling with Amino Acids in Cell Culture (SILAC) with Tandem Mass Tags (TMT) for highly multiplexed, temporally-resolved analysis. These methods enable simultaneous quantification of ubiquitination sites and protein abundance changes, allowing researchers to distinguish degradation from non-degradation ubiquitin signaling [22] [77]. The following sections provide detailed troubleshooting guides, frequently asked questions, and optimized protocols to overcome common obstacles in ubiquitination site identification and quantification.
Technical Foundations & Workflow Design
Core Principles of Integrated SILAC-TMT Methods
The combination of metabolic labeling (SILAC) with isobaric chemical tagging (TMT) creates a hyperplexing approach that enables precise measurement of proteome dynamics [78] [79]. This integrated methodology allows researchers to simultaneously track protein synthesis and degradation kinetics while quantifying ubiquitination changes at specific lysine residues. The SILAC component facilitates accurate quantification of protein turnover rates, while TMT tagging enables multiplexing of multiple time points or conditions in a single MS run, significantly reducing technical variation and instrument time [79]. This approach is particularly valuable for studying the dynamics of ubiquitin signaling, as it can dissect the scope of deubiquitinase action by simultaneously recording ubiquitination changes and consequent abundance changes of thousands of proteins at high temporal resolution [77].
Experimental Workflow Visualization
The following diagram illustrates the integrated SILAC-TMT workflow for quantitative ubiquitinome profiling:
Figure 1. Integrated experimental workflow for SILAC-TMT ubiquitinome profiling. Key steps include metabolic labeling with heavy amino acids, proteasome inhibition to stabilize ubiquitinated species, immunoaffinity enrichment of K-ε-GG remnant peptides, TMT labeling for multiplexing, and LC-MS/MS analysis.
Critical Reagent Solutions for Ubiquitinome Profiling
Table 1. Essential research reagents for SILAC-TMT ubiquitinome profiling
| Reagent | Function | Specification |
|---|---|---|
| Heavy amino acids ([13C6,15N4] Arg, [13C6,15N2] Lys) | Metabolic labeling for protein turnover quantification | Cambridge Isotope Laboratories [17] [22] |
| PTMScan Ubiquitin Remnant Motif (K-ε-GG) Antibody | Immunoaffinity enrichment of ubiquitinated peptides | Cell Signaling Technology [80] [22] |
| 16-plex TMTpro Reagents | Multiplexed quantification of up to 16 samples | Thermo Fisher Scientific [80] |
| SDC Lysis Buffer | Efficient protein extraction while preserving ubiquitination | 0.5% SDC, 50 mM HEPES, pH 8.5 [77] |
| Chloroacetamide (CAA) | Cysteine alkylation without lysine carbamidomethylation | 40 mM in lysis buffer [77] |
| Proteasome Inhibitor (MG-132) | Stabilization of degradation-targeted ubiquitinated proteins | 20 μM, 6-hour treatment [22] |
Troubleshooting Guides
Low Yield of Ubiquitinated Peptides
Problem: Researchers frequently obtain insufficient quantities of ubiquitinated peptides after immunoaffinity enrichment, resulting in poor coverage of the ubiquitinome.
Solutions:
- Optimize Lysis Conditions: Replace conventional urea buffer with sodium deoxycholate (SDC)-based lysis buffer supplemented with 40 mM chloroacetamide (CAA). This modification increases K-ε-GG peptide identification by 38% compared to urea buffer [77].
- Increase Protein Input: Use 2-4 mg of total protein lysate for ubiquitin remnant enrichment. Identification numbers drop below 20,000 K-ε-GG peptides for inputs of 500 μg or less [77].
- Implement Proteasome Inhibition: Treat cells with 20 μM MG-132 for 6 hours prior to lysis to prevent degradation of ubiquitinated proteins and enhance ubiquitin signal [22] [77].
- Optimize Enrichment Conditions: Divide samples into sub-fractions for parallel enrichment using 20 μL PTMScan antibody slurry per sub-fraction, incubating at 4°C for 2 hours with rotation [22].
Ratio Compression in TMT Quantification
Problem: Co-isolated interfering ions cause ratio compression in TMT measurements, underestimating true ubiquitination fold changes.
Solutions:
- Implement Synchronous Precursor Selection (SPS)-MS3: Utilize MS3-based quantification to virtually eliminate ratio compression effects [80] [78].
- Apply Advanced Data Processing: Use DIA-NN with specialized scoring modules for modified peptides, which improves quantitative accuracy for K-ε-GG peptides [77].
- Optimize Fractionation: Employ extensive basic pH reversed-phase liquid chromatography fractionation (24 fractions) prior to LC-MS/MS analysis to reduce sample complexity [80] [22].
- Narrow Isolation Windows: Use MS2 isolation windows of 1-2 Th to minimize co-isolation [80].
Poor SILAC Incorporation Efficiency
Problem: Incomplete metabolic labeling with heavy amino acids leads to inaccurate protein turnover measurements.
Solutions:
- Verify Amino Acid Auxotrophy: Use cells with deleted LYS2 and ARG4 genes to ensure complete dependence on supplied heavy amino acids [17].
- Confirm Labeling Efficiency: Allow incorporation of heavy arginine and lysine isotopes to exceed 98% as determined by LC-MS/MS analysis of trypsin-digested heavy cell lysate [22].
- Optimize Media Formulation: Use SILAC heavy media with equal molar concentration of heavy stable isotope-labeled L-arginine (12 mg/L) and L-lysine (18 mg/L) relative to light media [17].
- Validate with Control Experiments: Analyze labeling efficiency in pilot experiments before proceeding with full-scale ubiquitinome profiling.
Frequently Asked Questions
Method Selection & Design
Q: When should I choose SILAC-TMT hyperplexing over label-free methods for ubiquitinome profiling?
A: SILAC-TMT hyperplexing is particularly advantageous when studying proteome dynamics or requiring high temporal resolution. This method enables simultaneous measurement of protein synthesis and degradation rates while quantifying ubiquitination changes across multiple time points in a single MS run [78] [79]. For studies focusing specifically on ubiquitination stoichiometry without turnover measurements, label-free DIA methods may be more efficient and can identify over 70,000 ubiquitinated peptides in single MS runs [77].
Q: What are the key considerations for experimental design in SILAC-TMT ubiquitinome studies?
A: Critical considerations include: (1) Ensuring adequate biological replicates (minimum n=3); (2) Incorporating control channels for ratio normalization across TMT sets; (3) Including proteasome inhibition conditions to distinguish degradation-targeted ubiquitination; (4) Planning time courses that capture relevant biological processes (minutes to hours depending on system); (5) Allocating MS instrument time for extensive fractionation to achieve sufficient depth [80] [22] [77].
Data Acquisition & Analysis
Q: What mass spectrometry acquisition method provides the best depth and precision for ubiquitinome profiling?
A: Data-independent acquisition (DIA) coupled with neural network-based data processing (DIA-NN) significantly outperforms data-dependent acquisition (DDA) for ubiquitinomics. DIA more than triples identification numbers (68,429 vs. 21,434 K-ε-GG peptides) while improving quantitative precision (median CV of 10%) and reducing missing values [77]. The DIA-NN software includes specialized scoring modules optimized for K-ε-GG peptide identification and quantification.
Q: How can I distinguish degradation from non-degradation ubiquitin signaling in my data?
A: This requires integrated analysis of ubiquitination changes paired with protein abundance measurements. Degradation signaling shows increased ubiquitination coupled with decreased protein abundance, while non-degradative signaling shows ubiquitination changes without corresponding abundance changes [22] [77]. Computational approaches that measure relative ubiquitin occupancy at distinct modification sites in response to proteasome inhibition can systematically differentiate these functional categories [22].
Advanced Methodologies
Quantitative Data Analysis Framework
Table 2. Key parameters for quantitative analysis of ubiquitinome data
| Parameter | Typical Range | Impact on Data Quality |
|---|---|---|
| Protein Input | 2-4 mg | Higher input increases K-ε-GG identifications |
| TMT Labeling Efficiency | >98% | Critical for accurate quantification |
| SILAC Incorporation | >98% | Essential for turnover rate calculations |
| MS Injection Time | 100-150 min | Longer gradients improve identification |
| Fractionation | 24 fractions | Significantly reduces sample complexity |
| CV for K-ε-GG Peptides | <20% | Threshold for precise quantification |
Data Processing Workflow
The following diagram outlines the recommended data processing strategy for SILAC-TMT ubiquitinome data:
Figure 2. Data analysis workflow for SILAC-TMT ubiquitinome profiling. Critical steps include specialized DIA-NN processing for K-ε-GG peptides, rigorous quality filtering, and functional analysis to distinguish degradation from non-degradation ubiquitin signaling.
Implementing robust SILAC and TMT methods for quantitative ubiquitinome profiling requires careful attention to experimental design, sample preparation, and data analysis. The integrated troubleshooting guides and FAQs presented in this technical support center address the most common challenges researchers face when studying ubiquitination dynamics. By following the optimized protocols, utilizing recommended reagent solutions, and applying appropriate data processing strategies, researchers can achieve comprehensive quantification of ubiquitination events across multiple cellular conditions. The continued advancement of mass spectrometry technologies, particularly DIA-MS with neural network-based data processing, promises even deeper coverage and higher precision for future ubiquitinome studies, further enabling the dissection of complex ubiquitin signaling networks in health and disease.
Protein ubiquitination is a crucial post-translational modification that regulates diverse cellular functions, including proteasomal degradation, DNA repair, and signal transduction. The identification of specific ubiquitination sites has been revolutionized by mass spectrometry (MS)-based proteomics, yet researchers face a critical trade-off: achieving sufficient depth of coverage while maintaining high specificity. This technical support guide addresses the most common challenges in ubiquitination site identification, providing troubleshooting advice and comparative data on the most widely used enrichment methodologies. The choice of enrichment strategy—conducted at the protein or peptide level—directly impacts the number of sites identified, the specificity of the results, and the successful application in downstream quantitative experiments.
Methodologies at a Glance: A Comparative Table
The following table summarizes the core characteristics, advantages, and limitations of the primary methods used to enrich ubiquitinated material for MS analysis.
Table 1: Comparison of Ubiquitination Enrichment Methodologies
| Methodology | Principle | Typical Depth (# of Sites) | Key Advantages | Major Limitations |
|---|---|---|---|---|
| K-ε-GG Immunoaffinity Enrichment [10] [26] [35] | Antibody enrichment of tryptic peptides containing the diGly (K-ε-GG) remnant. | >10,000 - 23,000+ sites from cell lines [10] [35] | High specificity; enables site-specific identification; works with endogenous ubiquitin; compatible with SILAC/TMT quantification. | Cannot distinguish ubiquitination from NEDD8/ISG15; requires high-quality antibody; sample preparation is complex. |
| Tagged Ubiquitin (e.g., His, Strep) [17] [8] | Affinity-based purification of ubiquitinated proteins using epitope-tagged ubiquitin. | ~100 - 750 sites (e.g., 110 in yeast, 753 in U2OS/HEK293 [8]) | Accessible and cost-effective; good for initial discovery in cultured cells. | Potential artifacts from tag overexpression; co-purification of non-ubiquitinated proteins reduces specificity; not suitable for tissues. |
| TUBEs (Tandem Ubiquitin-Binding Entities) [8] [81] | Enrichment of polyubiquitinated proteins using high-affinity ubiquitin-binding domains. | Varies; often used for validation or linkage studies. | Protects ubiquitin chains from deubiquitinases (DUBs) and proteasomal degradation; can enrich for specific chain topologies. | Lower specificity compared to K-ε-GG; not site-specific; can be costly. |
| Linkage-Specific Antibodies [8] | Immuno-enrichment of proteins or peptides bearing a specific ubiquitin chain linkage (e.g., K48, K63). | Highly variable and linkage-dependent. | Provides direct information on chain topology; can be applied to tissue samples. | Very high cost; limited availability for all linkage types; not a global profiling tool. |
Experimental Protocols for Key Methods
Protocol: K-ε-GG Ubiquitin Remnant Enrichment
This protocol is the current gold standard for deep, site-specific ubiquitinome profiling [26] [35].
Sample Preparation and Lysis
- Cells/Tissue: Lyse cells or tissue in a freshly prepared, chilled urea-based lysis buffer (e.g., 8 M Urea, 50 mM Tris-HCl pH 8.0, 150 mM NaCl) supplemented with protease and deubiquitinase inhibitors (e.g., 50 µM PR-619, 1 mM PMSF) [26]. Boiling the lysate in 0.5% sodium deoxycholate (DOC) can also be effective [10].
- Quantification: Determine protein concentration using a BCA assay.
Protein Digestion
- Reduction and Alkylation: Reduce disulfide bonds with 5 mM DTT (30 min, 50°C) and alkylate with 10 mM iodoacetamide (15 min, in the dark) [10].
- Digestion: Digest proteins first with Lys-C (e.g., 1:200 w/w, 4 hours) followed by trypsin (e.g., 1:50 w/w, overnight) at 30°C [10] [26].
- Cleanup: Acidify the peptide digest with trifluoroacetic acid (TFA) to a final concentration of 0.5% to precipitate and remove detergents. Centrifuge and collect the supernatant [10].
Offline Peptide Fractionation (Critical for Depth)
- To achieve identifications in the tens of thousands, fractionate the peptide sample before immunoenrichment using high-pH reverse-phase chromatography [10] [26].
- Load the peptides onto a C18 column and elute stepwise or with a gradient using increasing concentrations of acetonitrile (e.g., 7%, 13.5%, 50%) in a 10 mM ammonium formate solution (pH 10) [10]. Pool or concatenate fractions as needed and lyophilize.
K-ε-GG Peptide Immunoaffinity Enrichment
- Antibody Bead Preparation: Wash the anti-K-ε-GG antibody-conjugated beads with PBS. For higher specificity, chemically cross-link the antibody to protein A agarose beads using dimethyl pimelimidate (DMP) to prevent antibody leaching [26].
- Enrichment: Resuspend the fractionated, dried peptide samples in immunoaffinity purification buffer. Incubate with the prepared antibody beads for several hours at 4°C.
- Wash and Elute: Wash the beads extensively with PBS or IAP buffer to remove non-specifically bound peptides. Elute the bound K-ε-GG peptides with a low-pH solution (e.g., 0.1-0.2% TFA).
Mass Spectrometric Analysis
Protocol: Substrate Identification using TR-TUBE
This method is particularly useful for stabilizing and identifying the substrates of a specific E3 ubiquitin ligase [81].
- TR-TUBE Expression: Express a trypsin-resistant TUBE (TR-TUBE) with an affinity tag (e.g., FLAG) in your cell system. This stabilizes endogenous polyubiquitinated proteins by protecting them from DUBs and the proteasome.
- E3 Ligase Overexpression: Co-express your E3 ligase of interest in the presence of TR-TUBE. The TR-TUBE allows accumulated ubiquitinated substrates to be maintained.
- Cell Lysis and Enrichment: Lyse cells and perform immunoprecipitation using an antibody against the TR-TUBE's tag (e.g., anti-FLAG) to pull down the stabilized ubiquitinated proteome.
- On-bead Digestion and MS Analysis: Digest the enriched proteins on-bead with trypsin. The TR-TUBE is resistant to trypsin, preventing the generation of interfering peptides.
- Data Analysis: Identify ubiquitinated peptides from the resulting mixture by LC-MS/MS. Compare to control samples to pinpoint substrates specific to your E3 ligase.
Troubleshooting FAQs
FAQ 1: We are getting a low yield of enriched K-ε-GG peptides and poor depth. What could be the issue?
- Solution: Ensure comprehensive offline fractionation prior to immunoenrichment. This dramatically reduces sample complexity and is essential for deep coverage [10] [26]. Check the efficiency of protein digestion and the activity of the antibody beads. Using cross-linked antibodies can also improve the signal-to-noise ratio by reducing contaminating antibody fragments [26].
FAQ 2: Our negative controls show high background. How can we improve specificity?
- Solution: Implement antibody cross-linking to prevent the co-elution of antibody fragments, which is a major source of background [26]. Increase the stringency of wash steps after the immunoaffinity enrichment. Ensure that your lysis and wash buffers are correctly formulated and that detergents are thoroughly precipitated and removed after digestion [10].
FAQ 3: How can we be sure our identified K-ε-GG sites are from ubiquitin and not NEDD8 or ISG15?
- Solution: This is a known limitation of the diGly remnant approach. However, in most non-stress conditions, >94% of K-ε-GG identifications are derived from ubiquitin [26] [82]. To confirm, you can knock down or inhibit specific ubiquitin-like pathways, or use linkage-specific antibodies or TUBEs for validation of key hits [8].
FAQ 4: We want to profile ubiquitination in patient tissue samples. Which method is most appropriate?
- Solution: The K-ε-GG immunoaffinity enrichment method is ideal as it does not require genetic manipulation and works with endogenous ubiquitin. It has been successfully applied to murine and human tissue samples [10] [8] [82]. Avoid tagged-ubiquitin methods, as they are infeasible in clinical tissue contexts.
FAQ 5: How can we quantitatively compare ubiquitination sites between two conditions?
- Solution: Integrate the K-ε-GG enrichment workflow with SILAC (Stable Isotope Labeling by Amino Acids in Cell Culture) or chemical tandem mass tags (TMT) [17] [26] [82]. For SILAC, grow cells in "light" or "heavy" media containing different isotope-labeled amino acids, mix the protein lysates in a 1:1 ratio, and then process the mixed sample through the entire workflow. This allows for precise relative quantification of ubiquitination site changes [10] [17].
Visualizing the Ubiquitination Site Identification Workflow
The following diagram illustrates the two primary strategies for enriching ubiquitinated material, highlighting the key steps that influence specificity and depth.
Diagram 1: Workflow comparison of protein-level versus peptide-level enrichment strategies. The K-ε-GG peptide-level path with fractionation enables greater depth and specificity.
The Scientist's Toolkit: Essential Reagents and Materials
Table 2: Key Research Reagent Solutions for Ubiquitin Enrichment
| Reagent / Kit | Function / Application | Key Considerations |
|---|---|---|
| Anti-K-ε-GG Antibody (e.g., PTMScan Kit) [26] [83] | Immunoaffinity enrichment of ubiquitin remnant peptides from trypsin-digested samples. | The core reagent for high-specificity, site-level profiling. Cross-linking to beads is recommended to reduce contamination. |
| TUBEs / TR-TUBEs [8] [81] | Tandem Ubiquitin-Binding Entities for enriching and stabilizing polyubiquitinated proteins. | Ideal for studying E3 ligase substrates and protecting labile ubiquitination from DUBs. TR-TUBE is trypsin-resistant for cleaner MS samples. |
| Linkage-Specific Ubiquitin Antibodies [8] | Enrich proteins or chains with specific ubiquitin linkages (e.g., K48, K63). | Essential for probing ubiquitin chain topology. Useful for validation but less so for global, unbiased profiling. |
| SILAC Kits [10] [17] [26] | Metabolic labeling for quantitative comparison of ubiquitination sites across cell states. | Enables precise relative quantification when combined with K-ε-GG enrichment. |
| Deubiquitinase (DUB) Inhibitors (e.g., PR-619, NEM) [26] | Preserve the endogenous ubiquitinome by inhibiting deubiquitinating enzymes during lysis. | Critical for maintaining the native ubiquitination state. Must be added fresh to lysis buffer. |
| Proteasome Inhibitors (e.g., Bortezomib, MG132) [10] [82] | Block degradation of ubiquitinated proteins, causing their accumulation. | Useful for enhancing signals, particularly for proteasomal targets. Can also reveal regulatory, non-degradative ubiquitination when analyzed carefully. |
In mass spectrometry-based proteomics, controlling the False Discovery Rate (FDR) is a critical but often challenging task. For researchers identifying ubiquitination sites, improper FDR control can lead to invalid scientific conclusions and hinder the comparison of analysis pipelines [84]. This guide addresses common pitfalls and provides troubleshooting advice to ensure the statistical validity of your findings.
FAQs and Troubleshooting Guides
Why might my tool report more identifications but still be problematic?
Your search tool might not be TDA-compliant. The Target-Decoy Approach (TDA) operates on a key assumption: the distribution of scores for incorrect peptide identifications should be the same for the target and decoy databases [85] [86]. If a tool's scoring method violates this, it can appear more powerful but actually report inflated false discoveries.
- Symptoms: An analysis tool consistently finds significantly more peptides or proteins than other tools at the same reported FDR. A known example is a two-pass search strategy, where filtering in the first stage increases the proportion of target sequences, causing the decoy counts in the second stage to underestimate the false discoveries [85] [86].
- Troubleshooting Steps:
- Investigate the Algorithm: Determine if the tool uses multi-stage searches or protein-level feedback to adjust peptide scores, as these can break TDA compliance [85] [86].
- Use Entrapment: Validate your tool's FDR control using an entrapment experiment (see protocol below) [84].
- Check for Updates: The tool may have a known history of non-compliance. For instance, Percolator was initially non-compliant but was later corrected [85].
How can I validate if my FDR estimates are accurate?
Using entrapment experiments is the standard method for independent validation [84]. This involves adding peptides from a species not present in your sample (e.g., S. cerevisiae in a human sample) to your database. Any reported entrapment peptide is a verifiable false discovery.
- Symptoms: Uncertainty about whether your tool's reported FDR (e.g., 1%) reflects the actual proportion of false discoveries in your results.
- Troubleshooting Steps:
- Design the Experiment: Expand your search database with entrapment sequences, hiding their origin from the analysis tool [84].
- Calculate the Correct Estimate: Use the validated "combined" method to estimate the False Discovery Proportion (FDP). A common mistake is using an invalid formula that gives a lower bound, making FDR control seem better than it is [84].
- Interpret the Results: Plot the entrapment-estimated FDP against the tool's reported FDR. If the upper bound of the estimate falls below the line y=x, it suggests the tool successfully controls the FDR [84].
My DIA tool performs poorly on single-cell data. Is this a known issue?
Yes. Recent entrapment studies have found that no popular Data-Independent Acquisition (DIA) tool consistently controls the FDR at the peptide level across all datasets, with performance worsening for single-cell data and at the protein level [84] [87].
- Symptoms: A DIA analysis tool (e.g., DIA-NN, Spectronaut, EncyclopeDIA) reports an acceptable FDR, but the list of discoveries contains an unexpectedly high number of false positives, especially in low-input experiments.
- Troubleshooting Steps:
- Acknowledge the Limitation: Be aware that this is a known field-wide challenge for DIA, unlike the better-controlled Data-Dependent Acquisition (DDA) [84].
- Apply Rigorous Validation: Use entrapment experiments to quantify the true FDP in your specific DIA workflow and dataset [84] [87].
- Stay Informed: This is an active area of research. New tools and methods, like Percolator-RESET, are being developed to provide more robust FDR control [88].
Key Experimental Protocols
Protocol 1: Conducting an Entrapment Experiment for FDR Validation
This protocol allows you to empirically test if your analysis pipeline controls the FDR as advertised [84].
- Database Expansion: Create a composite search database. The "original target" section should contain the expected proteome (e.g., human). The "entrapment" section should contain a proteome from a species not in your sample.
- Data Analysis: Run your mass spectrometry data and analysis tool against this composite database as you normally would.
- Result Classification: After analysis, separate the results into:
- ( N{\mathcal{T}} ): Count of discoveries from the "original target" database.
- ( N{\mathcal{E}} ): Count of discoveries from the "entrapment" database.
- FDP Calculation: Use the validated "combined" formula to calculate an upper-bound estimate of the FDP:
FDP_estimate = (N_E * (1 + 1/r)) / (N_T + N_E)whereris the effective size ratio of the entrapment database to the original target database [84]. - Interpretation: Compare this estimated FDP to the FDR reported by your tool. If the estimate is consistently higher, your tool is likely underestimating the true error rate.
Protocol 2: Checking for TDA Compliance
Use this logical check to assess if a tool's algorithm might be non-TDA compliant [85] [86].
- Identify Algorithmic Features: Determine if the tool uses any of these common features:
- A two-pass or multi-stage search.
- Protein-level inference or feedback to re-score peptide-spectrum matches (PSMs).
- Any learning or re-weighting based on the composition of the target database.
- Analyze Impact: For each feature, ask: "Could this cause a incorrect (bogus) peptide to receive a systematically higher score if it is in the target database compared to the decoy database?"
- Seek External Validation: If the answer to the above is "yes," the tool may not be TDA-compliant. Rely on entrapment experiments or validated compliant tools for that analysis step.
Data Presentation
Table 1: Common FDR Estimation Methods in Entrapment Experiments
| Method Name | Formula | Provides | Common Usage Pitfalls |
|---|---|---|---|
| Combined (Valid Upper Bound) [84] | (\displaystyle \widehat{\text{FDP}} = \frac{N{\mathcal{E}} (1 + 1/r)}{N{\mathcal{T}} + N_{\mathcal{E}}}) | Estimated upper bound for FDP | Not used as frequently as it should be. |
| Lower Bound (Invalid for Validation) [84] | (\displaystyle \widehat{\underline{\text{FDP}}} = \frac{N{\mathcal{E}}}{N{\mathcal{T}} + N_{\mathcal{E}}}) | A lower bound for the FDP | Often mistakenly used to validate FDR control, which is incorrect. This can only indicate a failure to control FDR. |
Table 2: TDA-Compliance Checklist for Common Scenarios
| Scenario | TDA-Compliant? | Reason |
|---|---|---|
| Single-pass database search | Likely Yes | The fundamental assumption of equal score distributions for false matches is typically maintained. |
| Two-pass search (e.g., X!Tandem) | No [85] [86] | The first-pass filter alters the database composition, breaking the equal chance assumption for the second pass. |
| Post-processors with protein-level feedback | No [85] | Using information from other identified peptides in a protein creates a bias between target and decoy databases. |
| Semi-supervised learning (e.g., Percolator) | Requires careful implementation [88] [85] | Early versions were non-compliant; later versions like Percolator-RESET were developed to ensure FDR control [88]. |
Visualizations
Diagram 1: FDR Control Validation Outcomes
Diagram 2: Pitfalls in Multi-Stage Search
The Scientist's Toolkit
Research Reagent Solutions
| Item | Function in Experiment |
|---|---|
| Decoy Database | A database of incorrect peptides (e.g., reversed or shuffled sequences) used to model the distribution of false matches and estimate the FDR via the Target-Decoy Approach (TDA) [85] [84]. |
| Entrapment Database | A database of peptides from an organism not present in the sample, used as a ground-truth negative control to independently validate the FDR estimates produced by an analysis pipeline [84]. |
| Percolator-RESET | A post-processing tool that uses a semi-supervised learning algorithm to improve discrimination between correct and incorrect peptide identifications while providing theoretically guaranteed FDR control [88]. |
Interpreting Ubiquitin Linkage Data from MS/MS Spectra
FAQs: Core Concepts and Common Challenges
1. What is the "di-glycine remnant" and why is it central to ubiquitin MS/MS data interpretation? When a ubiquitinated protein is digested with trypsin, a signature di-glycine (Gly-Gly) remnant from the C-terminus of ubiquitin remains attached via an isopeptide bond to the modified lysine residue on the substrate peptide. This modification adds a mass shift of 114.04292 Da to the lysine. Detection of this mass shift on a peptide fragment is the primary evidence for a ubiquitination event in bottom-up MS/MS experiments [89] [11] [7].
2. My data suggests a ubiquitination site, but how can I be sure it's not a false positive? A common source of false positives is the misidentification of di-carbamidomethylated lysine, which is isobaric to the di-glycine remnant (both C4H6N2O2, 114.04292 Da) [90]. To minimize this:
- Use Chloroacetamide (CAA) over Iodoacetamide (IAA) for alkylation: IAA can cause di-carbamidomethylation, which mimics the K-ɛ-GG signature, whereas CAA does not induce this artifact [91].
- Employ High-Resolution Mass Spectrometry: Modern Orbitrap or Q-TOF instruments can resolve near-isobaric modifications, increasing confidence in assignments [90].
- Manual Spectral Validation: Always manually inspect MS/MS spectra for the presence of characteristic fragment ions, as automated search algorithms can make erroneous assignments [92].
3. What are the key diagnostic ions for confirming a ubiquitinated peptide in an MS/MS spectrum? Ubiquitinated peptides generate unique fragmentation patterns. In addition to the standard b- and y-ions from the substrate peptide, look for a second series of b- and y-ions derived from the ubiquitin side-chain that remains attached to the modified lysine. These diagnostic ions, which include portions of the ubiquitin sequence, provide confirmatory evidence beyond the mass shift alone [93].
4. How can I distinguish between different polyubiquitin chain linkages using MS? Determining linkage topology is analytically challenging. Two primary MS approaches are used:
- Bottom-Up (After Digestion): Linkage information can be deduced by identifying the specific lysine residue (K6, K11, K27, K29, K33, K48, K63) within ubiquitin that is modified with the di-glycine remnant from the adjacent ubiquitin. This requires specialized enrichment and software analysis [89] [17].
- Top-Down (Intact Analysis): Techniques like 193-nm Ultraviolet Photodissociation (UVPD) can fragment intact polyubiquitin chains. This method generates a diagnostic pattern of N-terminal fragment ions from each ubiquitin monomer, allowing for direct assignment of chain length and linkage type without digestion [94].
Troubleshooting Guides
Issue 1: Low Coverage of Ubiquitinated Peptides
Problem: Inability to isolate and identify a sufficient number of ubiquitinated peptides from a complex sample due to their low stoichiometric abundance.
Solution: Optimize your enrichment strategy and sample preparation.
- Improved Lysis: Use a Sodium Deoxycholate (SDC)-based lysis buffer supplemented with Chloroacetamide (CAA). This method, when compared to traditional urea buffers, has been shown to increase K-GG peptide identifications by over 38% and improves reproducibility [91].
- Enhanced Enrichment: Utilize immunoaffinity purification with high-quality anti-K-ɛ-GG remnant antibodies. This is the most widely used method for large-scale ubiquitinome profiling, capable of enriching tens of thousands of distinct ubiquitination sites [11] [22].
- Increase Protein Input: For deep ubiquitinome profiling, use higher protein starting amounts (e.g., 2-4 mg). Identification numbers drop significantly for inputs of 500 µg or less [91].
Issue 2: Poor Quantitative Reproducibility in Ubiquitinome Profiling
Problem: High run-to-run variability and many missing values when quantifying ubiquitinated peptides across multiple samples.
Solution: Transition from Data-Dependent Acquisition (DDA) to Data-Independent Acquisition (DIA).
- Adopt DIA-MS: A DIA-MS workflow coupled with neural network-based processing (e.g., DIA-NN) has been demonstrated to more than triple the number of identified ubiquitinated peptides (over 68,000 in a single run) compared to DDA, while significantly improving quantitative precision and robustness [91].
- Use a Deep Spectral Library: For DIA analysis, generate a comprehensive, sample-specific spectral library via high-pH reversed-phase fractionation. This allows DIA-NN to achieve optimal depth and quantitative accuracy [91].
Issue 3: Differentiating Degradation vs. Non-Degradation Ubiquitin Signaling
Problem: Identifying a ubiquitination site is only the first step; determining its functional consequence is a major bottleneck.
Solution: Integrate quantitative proteomics with proteasome inhibition.
- SILAC-based Functional Profiling: As detailed in the workflow below, combine SILAC labeling with 26S proteasome inhibition (e.g., MG132). By simultaneously tracking changes in ubiquitin occupancy at specific sites and the total protein abundance, you can infer function. Increased ubiquitin occupancy without a change in protein abundance suggests a non-degradative role. In contrast, increased ubiquitin occupancy coupled with a failure to degrade the protein upon proteasome inhibition is consistent with a degradative signal [22].
Diagram: Experimental workflow for determining ubiquitin signaling function using quantitative proteomics.
Data Presentation: Quantitative MS Workflow Performance
The following table summarizes key metrics from recent advanced MS workflows for ubiquitinome analysis, highlighting the significant gains in depth and precision offered by modern DIA methods.
Table 1: Performance Comparison of Ubiquitinome Profiling MS Workflows
| Workflow / Method | Reported K-ɛ-GG Peptide Identifications (per run) | Key Advantages | Quantitative Precision (Median CV) |
|---|---|---|---|
| Data-Dependent Acquisition (DDA) [91] | ~21,434 | Established, widely available software | Lower; ~50% peptides without missing values |
| Data-Independent Acquisition (DIA) with DIA-NN [91] | ~68,429 | High depth, robustness, excellent precision | ~10%; >68,000 peptides quantified in 3/3 replicates |
| Ubiquitin Remnant Antibody (K-ɛ-GG) Enrichment [11] | 10,000s of sites in single experiments | Targets endogenous ubiquitination; applicable to tissues | Dependent on downstream LC-MS platform |
| Top-Down UVPD for Linkage [94] | (Not applicable for peptide count) | Directly characterizes intact chain length and linkage | N/A |
The Scientist's Toolkit: Essential Research Reagents
Table 2: Key Reagents for Ubiquitin Proteomics
| Research Reagent / Material | Function in Experiment |
|---|---|
| Anti-K-ɛ-GG Remnant Antibody [11] [22] | Immunoaffinity enrichment of ubiquitinated peptides from tryptic digests for MS analysis. |
| SILAC Media (Lys/Arg) [17] [22] | Enables metabolic labeling of cells for precise relative quantification of ubiquitination changes between conditions. |
| Proteasome Inhibitor (e.g., MG132) [91] [22] | Stabilizes the ubiquitinome by blocking degradation of ubiquitinated proteins, increasing signal for degradative targets. |
| Chloroacetamide (CAA) [91] | Alkylating agent used in lysis buffer to inhibit deubiquitinases (DUBs) and prevent artifact di-carbamidomethylation. |
| Sodium Deoxycholate (SDC) [91] | Detergent for efficient cell lysis and protein extraction, shown to improve ubiquitinated peptide recovery over urea. |
| Epitope-Tagged Ubiquitin (e.g., His, HA) [89] [92] [17] | Allows for purification of ubiquitinated conjugates under denaturing conditions via tag-specific affinity resins. |
Advanced Spectral Interpretation Workflow
The diagram below outlines a step-by-step decision process for analyzing and validating a potential ubiquitination event from an MS/MS spectrum, helping to prevent common pitfalls.
Diagram: Decision workflow for validating ubiquitination sites from MS/MS spectra.
Frequently Asked Questions (FAQs)
1. Why is my yield of diGly peptides low even after immunoprecipitation, and how can I improve it?
Low yield is often due to inefficient enrichment or sample loss during cleanup. To improve it:
- Pre-fractionate your peptides: Use offline high-pH reverse-phase fractionation before the immunoprecipitation step. This reduces sample complexity and improves antibody binding efficiency, leading to a much higher number of identifications [13] [10].
- Optimize sample cleanup: Employ a filter-plug format to retain antibody beads during washes. This method reduces non-specific binding and sample loss, increasing the specificity for diGly peptides [13] [10].
- Ensure proper lysis and digestion: Use a lysis buffer containing 0.5% sodium deoxycholate (DOC) and boil samples to efficiently denature proteins and inactivate deubiquitinases. A combination of Lys-C and trypsin digestion is recommended for complete digestion [10].
2. How can I distinguish genuine E3 ligase substrates from non-specifically ubiquitinated proteins?
A common challenge is that detected ubiquitination may occur independently of the E3 ligase of interest. To address this:
- Use TR-TUBEs: Expressing trypsin-resistant Tandem Ubiquitin Binding Entities (TR-TUBEs) in cells can stabilize the ubiquitination state of genuine substrates by protecting them from deubiquitinases and the proteasome. This allows for more specific detection of ubiquitination events dependent on your overexpressed E3 ligase [81].
- Combine enrichment strategies: Use TR-TUBE to enrich ubiquitinated proteins at the protein level, followed by tryptic digestion and anti-diGly antibody enrichment at the peptide level. This two-step process significantly increases the specificity for identifying direct substrates [81].
3. My mass spectrometry data shows inconsistent ubiquitination site identification. What steps can I take to improve reproducibility?
Inconsistencies can stem from sample preparation and data analysis.
- Standardize sample handling: Use deubiquitinase inhibitors like N-ethylmaleimide (NEM) in your lysis buffer to preserve ubiquitination states, unless specified otherwise by your protocol [81] [10].
- Implement quantitative methods: Utilize Stable Isotope Labeling by Amino acids in Cell Culture (SILAC) for accurate relative quantification between experimental conditions. This helps distinguish specific changes from background variability [11] [10].
- Control for proteasome activity: Treat cells with a proteasome inhibitor (e.g., 10 µM bortezomib for 8 hours) to prevent the degradation of ubiquitinated proteins, thereby increasing their abundance for detection [10].
Troubleshooting Guide: Ubiquitination Site Identification
The following table outlines common problems, their potential causes, and recommended solutions.
| Problem | Possible Cause | Recommended Solution |
|---|---|---|
| Low number of identified ubiquitination sites | Inefficient enrichment; high sample complexity | Pre-fractionate peptides using high-pH reverse-phase chromatography into 2-3 fractions before immunoaffinity purification [13] [10]. |
| Rapid deubiquitination or proteasomal degradation | Use proteasome inhibitors (e.g., Bortezomib) and DUB inhibitors (e.g., NEM) in lysis buffer [81] [10]. Express TR-TUBEs to stabilize polyubiquitinated proteins [81]. | |
| High background of non-diGly peptides | Non-specific binding during immunopurification | Use filter-based setups for cleaner wash steps. Optimize antibody-to-bead cross-linking and washing stringency [13]. |
| Inability to detect ubiquitination of a specific substrate | Low stoichiometry of modification; masked by abundant non-ubiquitinated protein | Combine protein-level enrichment (e.g., with TR-TUBEs or tagged ubiquitin) with peptide-level diGly enrichment for a multi-step purification [81] [95]. |
| Poor reproducibility between replicates | Inconsistent sample preparation or digestion | Adopt a standardized protocol with strict timing for digestion and enrichment. Use SILAC or other labeling techniques for internal standardization [11] [10]. |
Key Experimental Protocols
Protocol for Deep Ubiquitinome Analysis using Anti-diGly Antibody Enrichment
This optimized protocol allows for the identification of over 23,000 diGly peptides from a single sample of HeLa cells [13] [10].
Sample Preparation:
- Cell Lysis: Lyse cells in ice-cold 50 mM Tris-HCl (pH 8.2) with 0.5% Sodium Deoxycholate (DOC). Boil the lysate at 95°C for 5 minutes and sonicate.
- Protein Quantification: Determine protein concentration using a BCA assay.
- Reduction and Alkylation: Reduce proteins with 5 mM DTT (30 min, 50°C) and alkylate with 10 mM iodoacetamide (15 min, in the dark).
- Digestion: Digest proteins first with Lys-C (1:200 enzyme-to-substrate ratio, 4 hours) followed by trypsin (1:50 ratio, overnight at 30°C).
- Precipitation: Add TFA to 0.5% final concentration, centrifuge to precipitate and remove DOC, and collect the supernatant.
Offline Peptide Fractionation:
- Load the peptide digest onto a high-pH reverse-phase C18 column.
- Elute peptides into three distinct fractions using 10 mM ammonium formate (pH 10) with 7%, 13.5%, and 50% acetonitrile, respectively.
- Lyophilize the fractions completely.
Immunoaffinity Purification (IP) of diGly Peptides:
- Use anti-K-ε-GG antibody conjugated to protein A agarose beads.
- Perform the IP in a filter-plug format to minimize sample loss and non-specific binding.
- Wash beads thoroughly after IP.
Mass Spectrometry Analysis:
- Analyze enriched peptides by LC-MS/MS on an Orbitrap mass spectrometer.
- Use HCD (Higher-energy C-trap dissociation) for peptide fragmentation.
- Employ data analysis software (e.g., MaxQuant) configured to search for the diGly modification (lysine residue mass shift of +114.0429 Da) [11].
Protocol for Substrate Identification using TR-TUBE
This method is useful for detecting E3 ligase activity and identifying its endogenous substrates [81].
TR-TUBE Expression:
- Transfect cells with a plasmid encoding a FLAG-tagged, trypsin-resistant TUBE (TR-TUBE).
E3 Ligase Overexpression:
- Co-transfect with a plasmid for your E3 ligase of interest.
Cell Lysis and Protein Enrichment:
- Lyse cells in a buffer containing 1 mM N-ethylmaleimide (NEM) to inhibit DUBs.
- Immunoprecipitate ubiquitinated proteins and the TR-TUBE using anti-FLAG M2 affinity gel.
Ubiquitination Site Mapping:
- Elute the bound proteins and digest them with trypsin.
- Subject the resulting peptides to a second enrichment step using anti-diGly antibody to isolate ubiquitinated peptides.
- Identify the ubiquitination sites by LC-MS/MS analysis.
Research Reagent Solutions
The following table lists key reagents and their functions for ubiquitination site identification experiments.
| Reagent / Tool | Function in Experiment |
|---|---|
| Anti-K-ε-GG (diGly) Antibody | Immunoaffinity enrichment of ubiquitinated peptides from trypsin-digested samples [11] [13] [95]. |
| Tandem Ubiquitin Binding Entities (TUBEs/TR-TUBEs) | Protein-level enrichment of polyubiquitinated proteins; protects ubiquitin chains from DUBs and stabilizes ubiquitination in cells [81] [8]. |
| Tagged Ubiquitin (e.g., His, Strep, HA) | Affinity purification of ubiquitinated proteins from cell lysates under denaturing conditions [95] [8]. |
| Proteasome Inhibitors (e.g., Bortezomib, MG132) | Blocks degradation of ubiquitinated proteins, leading to their accumulation and improved detection [10]. |
| Deubiquitinase (DUB) Inhibitors (e.g., N-Ethylmaleimide (NEM)) | Prevents the removal of ubiquitin chains during sample preparation, preserving the native ubiquitination state [81] [10]. |
| SILAC (Stable Isotope Labeling by Amino acids in Cell Culture) | Enables accurate relative quantification of ubiquitination changes between different experimental conditions [11] [10] [95]. |
Workflow and Pathway Visualizations
Standard diGly Peptide Enrichment Workflow
TR-TUBE Mechanism for Substrate Stabilization
Conclusion
Successful ubiquitination site identification by mass spectrometry hinges on a holistic strategy that integrates a deep understanding of ubiquitin biology, careful selection and optimization of enrichment methodologies, proactive troubleshooting of technical hurdles, and rigorous validation of results. By systematically addressing challenges such as low stoichiometry, DUB activity, and enrichment specificity, researchers can achieve unprecedented depth and reliability in their ubiquitinome analyses. The future of the field lies in the continued refinement of linkage-specific tools, the integration of multi-omics approaches to understand ubiquitin cross-talk with other PTMs, and the application of these robust methodologies to unravel the role of ubiquitination in disease mechanisms, thereby accelerating the development of targeted therapeutics.
References
- 1. Weighing in on Ubiquitin: The Expanding Role of Mass Spectrometry-based Proteomics - PMC [https://www.ncbi.nlm.nih.gov/pmc/articles/PMC1224607/]
- 2. Ubiquitin - Wikipedia [https://en.wikipedia.org/wiki/Ubiquitin]
- 3. Protein Ubiquitination : Assays, Sites ... - Creative Proteomics [https://www.creative-proteomics.com/resource/protein-ubiquitination-detection-assays-site-identification-proteomics.htm]
- 4. proteomics as an approach to identify and quantify... Ubiquitin diGLY [https://pmc.ncbi.nlm.nih.gov/articles/PMC6791129/]
- 5. Dissecting the ubiquitin pathway by mass spectrometry - PMC [https://pmc.ncbi.nlm.nih.gov/articles/PMC1828906/]
- 6. Data-independent acquisition method for... | Nature Communications [https://www.nature.com/articles/s41467-020-20509-1?error=cookies_not_supported&code=59745945-750a-4761-86ee-a711920c295e]
- 7. MS-based Approaches for Ubiquitin Characterization [https://www.labx.com/resources/ms-based-approaches-for-ubiquitin-characterization/124]
- 8. Current methodologies in protein ubiquitination characterization: from ubiquitinated protein to ubiquitin chain architecture | Cell & Bioscience | Full Text [https://cellandbioscience.biomedcentral.com/articles/10.1186/s13578-022-00870-y]
- 9. Machine learning-based approaches for ubiquitination prediction... site [https://bmcbioinformatics.biomedcentral.com/articles/10.1186/s12859-023-05581-w]
- 10. Detection of Protein Ubiquitination by Peptide Enrichment and... Sites [https://www.jove.com/t/59079/detection-protein-ubiquitination-sites-peptide-enrichment-mass]
- 11. Large-scale identification of ubiquitination by sites ... mass [https://experiments.springernature.com/articles/10.1038/nprot.2013.120?error=cookies_not_supported&code=4d6f15bf-8726-49f0-a8e0-d866504b7a39]
- 12. Global analysis of lysine ubiquitination by ubiquitin remnant immunoaffinity profiling - PMC [https://pmc.ncbi.nlm.nih.gov/articles/PMC2946519/]
- 13. Improvement of ubiquitylation site detection by Orbitrap mass ... [https://pubmed.ncbi.nlm.nih.gov/29122726/]
- 14. Molecular Mechanisms of DUBs Regulation in Signaling and Disease... [https://pmc.ncbi.nlm.nih.gov/articles/PMC7863924/]
- 15. - Wikipedia Deubiquitinating enzyme [https://en.wikipedia.org/wiki/Deubiquitinating_enzyme]
- 16. The emerging role of deubiquitinating in genomic integrity... enzymes [https://cellandbioscience.biomedcentral.com/articles/10.1186/s13578-016-0127-1]
- 17. Analysis of Ubiquitinated Proteome by Quantitative Mass Spectrometry - PMC [https://pmc.ncbi.nlm.nih.gov/articles/PMC3467951/]
- 18. Deciphering Tissue-specific Ubiquitination by Mass Spectrometry - PMC [https://www.ncbi.nlm.nih.gov/pmc/articles/PMC3475722/]
- 19. Identification and validation of Selective Deubiquitinase Inhibitors - PMC [https://pmc.ncbi.nlm.nih.gov/articles/PMC9473745/]
- 20. Simultaneous inhibition of deubiquitinating ( enzymes ) and... DUBs [https://www.oncotarget.com/article/2904/text/]
- 21. Insights into ubiquitin chain architecture using Ub-clipping | Nature [https://www.nature.com/articles/s41586-019-1482-y?error=cookies_not_supported]
- 22. Proteomic analysis of degradation ubiquitin signaling by ubiquitin occupancy changes responding to 26S proteasome inhibition | Clinical Proteomics | Full Text [https://clinicalproteomicsjournal.biomedcentral.com/articles/10.1186/s12014-020-9265-x]
- 23. insights into a tandem ubiquitin-binding domain... Mass spectrometry [https://pubmed.ncbi.nlm.nih.gov/27037516/]
- 24. Editorial: Ubiquitin and ubiquitin -like modifications in viral infection... [https://pmc.ncbi.nlm.nih.gov/articles/PMC9932964/]
- 25. Frontiers | Hybrid Chains: A Collaboration of Ubiquitin and... [https://www.frontiersin.org/journals/chemistry/articles/10.3389/fchem.2019.00931/full]
- 26. Large-Scale Identification of Ubiquitination Sites by Mass Spectrometry - PMC [https://pmc.ncbi.nlm.nih.gov/articles/PMC4725055/]
- 27. Identification and characterization of a novel ISG - 15 mixed... ubiquitin [https://www.nature.com/articles/srep12704?error=cookies_not_supported&code=eaf8bfbb-fa81-4697-8dd5-f93ac1c23721]
- 28. Troubleshooting Mass Spectrometry - A Guide - GenTech Scientific [https://gentechscientific.com/a-guide-to-troubleshooting-mass-spectrometry/]
- 29. Detection of Protein Ubiquitination by Peptide Enrichment and... Sites [https://app.jove.com/t/59079/detection-protein-ubiquitination-sites-peptide-enrichment-mass]
- 30. Tips and tricks for successful Mass spec experiments | Proteintech... [https://www.ptglab.com/news/blog/tips-and-tricks-for-successful-mass-spec-experiments/]
- 31. Large-scale identification of ubiquitination by sites ... mass [https://www.broadinstitute.org/publications/broad5272]
- 32. for phosphopeptide Techniques prior to analysis by enrichment ... mass [https://pubmed.ncbi.nlm.nih.gov/19263479/]
- 33. Proteomic Identification of Protein Ubiquitination Events - PMC [https://www.ncbi.nlm.nih.gov/pmc/articles/PMC3937853/]
- 34. Refined preparation and use of anti -diglycine remnant ( K - ε - GG )... [https://pubmed.ncbi.nlm.nih.gov/23266961/]
- 35. Large-scale identification of ubiquitination sites by mass spectrometry | Nature Protocols [https://www.nature.com/articles/nprot.2013.120]
- 36. Application of quantitative proteomics to the integrated analysis of the... [https://link.springer.com/article/10.1186/s12014-015-9086-5]
- 37. Current methodologies in protein ubiquitination characterization: from... [https://pmc.ncbi.nlm.nih.gov/articles/PMC9373315/]
- 38. Internally tagged : a tool to identify linear... | Nature Methods ubiquitin [https://www.nature.com/articles/nmeth.4228?error=cookies_not_supported&code=8235ffd9-a713-4248-b6e3-b9685ab805ff]
- 39. A novel Ecotin- Ubiquitin - Tag (ECUT) for efficient, soluble peptide... [https://microbialcellfactories.biomedcentral.com/articles/10.1186/1475-2859-8-7]
- 40. Ubiquitin Chain Enrichment Middle-Down Mass Spectrometry Enables Characterization of Branched Ubiquitin Chains in Cellulo - PMC [https://www.ncbi.nlm.nih.gov/pmc/articles/PMC5541364/]
- 41. - TUBEs for Mass and... | SpringerLink Spectrometry Identification [https://link.springer.com/protocol/10.1007/978-1-4939-3756-1_9]
- 42. Improved Quantitative Mass Spectrometry Methods for Characterizing Complex Ubiquitin Signals - PMC [https://pmc.ncbi.nlm.nih.gov/articles/PMC3098583/]
- 43. High pH reversed-phase chromatography with fraction concatenation as an alternative to strong-cation exchange chromatography for two-dimensional proteomic analysis - PMC [https://pmc.ncbi.nlm.nih.gov/articles/PMC3337716/]
- 44. Peptide Offline and Parallel Reaction Monitoring MS for... Fractionation [https://pubmed.ncbi.nlm.nih.gov/36781797/]
- 45. Peptide Offline and Parallel Reaction... | SpringerLink Fractionation [https://link.springer.com/protocol/10.1007/978-1-0716-2978-9_23]
- 46. Standards and... | Thermo Fisher Scientific - CN Mass Spectrometry [https://www.thermofisher.cn/cn/en/home/technical-resources/technical-reference-library/mass-spectrometry-support-center/mass-spectrometry-reagents-support/ms-standards-calibrants-support/ms-standards-calibrants-support-troubleshooting.html]
- 47. An efficient method for high-pH peptide fractionation based on C18 StageTips for in-depth proteome profiling - Analytical Methods (RSC Publishing) [https://pubs.rsc.org/en/content/articlelanding/2019/ay/c9ay01269a]
- 48. Large-scale identification of ubiquitination by sites ... mass [https://www.nature.com/articles/nprot.2013.120?error=cookies_not_supported&code=d4e91ab1-4b58-46a9-b52a-5e5fd1eb1fbc]
- 49. of Identification and determination of... ubiquitination sites [https://pubmed.ncbi.nlm.nih.gov/16338362/]
- 50. Manipulating trypsin conditions to accelerate proteolysis... digestion [https://pmc.ncbi.nlm.nih.gov/articles/PMC11322774/]
- 51. /Lys-C protease mix for enhanced protein Trypsin ... mass spectrometry [https://www.nature.com/articles/nmeth.f.371?error=cookies_not_supported&code=b115ac37-5dd6-4d16-b3e0-e53d92ecd7cd]
- 52. Development of a simple non-reduced peptide mapping method that... [https://colab.ws/articles/10.1016%2Fj.jpba.2021.114541]
- 53. Improved LC-MS/MS spectral statistics by counting ... recovering [https://pubmed.ncbi.nlm.nih.gov/20812748/]
- 54. Peptide Enrichment and Fractionation for Mass Spectrometry | Thermo Fisher Scientific - US [https://www.thermofisher.com/us/en/home/life-science/protein-biology/protein-mass-spectrometry-analysis/sample-prep-mass-spectrometry/peptide-enrichment-fractionation-mass-spectrometry.html]
- 55. Video: Detection of Protein Ubiquitination Sites by Peptide ... [https://www.jove.com/v/59079/detection-protein-ubiquitination-sites-peptide-enrichment-mass]
- 56. Everywhere! Tips and Tricks for Reducing Contaminants ... Background [https://www.chromatographyonline.com/view/contaminants-everywhere-tips-and-tricks-reducing-background-signals-when-using-lc-ms]
- 57. Cleaning up the masses: Exclusion lists to reduce contamination with HPLC-MS/MS - PMC [https://pmc.ncbi.nlm.nih.gov/articles/PMC3714598/]
- 58. Rapid Assessment of Contaminants and Interferences in Mass Spectrometry Data Using Skyline | Journal of The American Society for Mass Spectrometry [https://link.springer.com/article/10.1007/s13361-018-1940-z]
- 59. Top 10 Things Users Can Do to Minimize Contamination of LC/MS Systems [https://sciex.com/support/knowledge-base-articles/the-top-10-things-users-can-do-to-minimize-contamination_en_us]
- 60. of the determination of bisphenol A at ultra-trace... Troubleshooting [https://pubmed.ncbi.nlm.nih.gov/26635019/]
- 61. How to Avoid Problems in LC–MS | LCGC International [https://www.chromatographyonline.com/view/how-avoid-problems-lc-ms-0]
- 62. Overcoming Key Challenges of Protein Mass Sample... Spectrometry [https://www.slideshare.net/slideshow/overcoming-key-challenges-of-protein-mass-spectrometry-sample-preparation/77478772]
- 63. Sample... | Thermo Fisher Scientific - RU Mass Spectrometry [https://www.thermofisher.com/ru/ru/home/life-science/protein-biology/protein-biology-learning-center/protein-biology-resource-library/protein-biology-application-notes/mass-spectrometry-sample-preparation-procedure-protein-samples.html]
- 64. Characterization of disulfide bonds by planned digestion and tandem... [https://pmc.ncbi.nlm.nih.gov/articles/PMC4410109/]
- 65. - Antibody and target elution protocols used for... cross linking [https://pmc.ncbi.nlm.nih.gov/articles/PMC3162493/]
- 66. Optimization of Data-Dependent Acquisition Parameters for Coupling High-Speed Separations with LC-MS/MS for Protein Identifications - PMC [https://pmc.ncbi.nlm.nih.gov/articles/PMC3605922/]
- 67. Video: Detection of Protein Ubiquitination Sites by Peptide Enrichment... [https://app.jove.com/v/59079/detection-protein-ubiquitination-sites-peptide-enrichment-mass]
- 68. Pitfalls in Proteomics: Avoiding Problems That Can Occur Before Data... [https://www.chromatographyonline.com/view/pitfalls-in-proteomics-avoiding-problems-that-can-occur-before-data-acquisition-begins]
- 69. Development of an LC - MS / MS mapping protocol for the... peptide [https://pmc.ncbi.nlm.nih.gov/articles/PMC5830484/]
- 70. Large-scale identification of ubiquitination sites by mass spectrometry | Springer Nature Experiments [https://experiments.springernature.com/articles/10.1038/nprot.2013.120?error=cookies_not_supported&code=b5ca209c-76a9-439f-b738-205c156fb4c1]
- 71. 4 Steps to Successful Compound Optimization on LC-MS/MS | Technology Networks [https://www.technologynetworks.com/analysis/how-to-guides/4-steps-to-successful-compound-optimization-on-lc-msms-311382]
- 72. Proteomic Identification of Protein Ubiquitination Events - PMC [https://pmc.ncbi.nlm.nih.gov/articles/PMC3937853/]
- 73. Hallmarks of Antibody Validation: Orthogonal Strategy | Cell Signaling Technology [https://www.cellsignal.com/about-us/approach-validation-principles/orthogonal-data]
- 74. Orthogonal Antibody Validation | Antibody Essentials [https://blog.cellsignal.com/hallmarks-of-validation-orthogonal-strategy]
- 75. - Atlas Antibodies Western Blot [https://www.atlasantibodies.com/antibody-applications/western-blot/]
- 76. Point mutation in the human dystrophin gene: identification through western blot analysis - PubMed [https://pubmed.ncbi.nlm.nih.gov/2071150/]
- 77. Time-resolved in vivo ubiquitinome by DIA-MS reveals... profiling [https://www.nature.com/articles/s41467-021-25454-1?error=cookies_not_supported&code=636437d9-8baa-4ed3-a190-62aa3bba229c]
- 78. Journal Club: Time-Resolved Analysis... | Thermo Fisher Scientific - US [https://www.thermofisher.com/us/en/home/references/newsletters-and-journals/bioprobes-journal-of-cell-biology-applications/bioprobes-76/bioprobes-76-journal-club-time-resolved-proteome-analysis-tmt-silac-hyperplexing.html]
- 79. Time-resolved Analysis of Proteome Dynamics by Tandem Mass Tags... [https://pubmed.ncbi.nlm.nih.gov/27765818/]
- 80. High Throughput Profiling of Proteome and Posttranslational... [https://pmc.ncbi.nlm.nih.gov/articles/PMC8458009/]
- 81. Detection of ubiquitination activity and identification of ubiquitinated substrates using TR-TUBE - ScienceDirect [https://www.sciencedirect.com/science/article/abs/pii/S0076687918305287]
- 82. Frontiers | Mass -Based Proteomics for Investigating... Spectrometry [https://www.frontiersin.org/journals/genetics/articles/10.3389/fgene.2016.00109/full]
- 83. Global Mass Spectrometry-Based Analysis of Protein Ubiquitination Using K-ε-GG Remnant Antibody Enrichment - PubMed [https://pubmed.ncbi.nlm.nih.gov/34432246/]
- 84. Assessment of false discovery rate control in tandem mass spectrometry analysis using entrapment | Nature Methods [https://www.nature.com/articles/s41592-025-02719-x]
- 85. Target-Decoy Approach and false : When Things May... Discovery Rate [https://pmc.ncbi.nlm.nih.gov/articles/PMC3220955/]
- 86. Target-Decoy Approach and false : When Things May... Discovery Rate [https://link.springer.com/article/10.1007/s13361-011-0139-3]
- 87. Assessment of false discovery rate control in tandem mass spectrometry analysis using entrapment - PMC [https://pmc.ncbi.nlm.nih.gov/articles/PMC11185562/]
- 88. How to train a postprocessor for tandem mass ... spectrometry [https://researchers.mq.edu.au/en/publications/how-to-train-a-postprocessor-for-tandem-mass-spectrometry-proteom]
- 89. Dissecting the ubiquitin pathway by mass spectrometry - PMC [https://www.ncbi.nlm.nih.gov/pmc/articles/PMC1828906/]
- 90. Common errors in mass spectrometry-based analysis of post-translational modifications - PMC [https://pmc.ncbi.nlm.nih.gov/articles/PMC5548100/]
- 91. Time-resolved in vivo ubiquitinome profiling by DIA- MS reveals... [https://www.nature.com/articles/s41467-021-25454-1?error=cookies_not_supported&code=8ae09e40-9247-4aee-9a83-6afd1b0d7471]
- 92. Ubiquitinated Proteome: Ready for Global? - PMC [https://pmc.ncbi.nlm.nih.gov/articles/PMC3098603/]
- 93. Mass Spectrometric Determination of Protein Ubiquitination | Springer Nature Experiments [https://experiments.springernature.com/articles/10.1007/978-1-60327-084-7_8?error=cookies_not_supported&code=f0f74354-8ede-45ea-b66d-2bb0d74e0f96]
- 94. Top-Down 193-nm Ultraviolet Photodissociation Mass Spectrometry for... [https://pmc.ncbi.nlm.nih.gov/articles/PMC4318624/]
- 95. Proteomic approaches for the profiling of ubiquitylation events and their applications in drug discovery - ScienceDirect [https://www.sciencedirect.com/science/article/abs/pii/S187439192030364X]