Ubiquitinomics vs Proteomics: The Next Frontier in Cancer Biomarker Discovery
This article provides a comprehensive comparison between ubiquitinomics and proteomics for researchers and drug development professionals engaged in cancer biomarker discovery.
Ubiquitinomics vs Proteomics: The Next Frontier in Cancer Biomarker Discovery
Abstract
This article provides a comprehensive comparison between ubiquitinomics and proteomics for researchers and drug development professionals engaged in cancer biomarker discovery. We explore the foundational principles of both fields, detailing how traditional proteomics delivers a broad snapshot of protein expression while ubiquitinomics specifically deciphers the dynamic ubiquitin code—a key regulator of protein stability and function implicated in tumorigenesis. The content examines current methodological approaches, from mass spectrometry and antibody-based techniques to innovative aptamer technologies, addressing critical challenges like tumor heterogeneity and analytical sensitivity. Through comparative analysis and validation frameworks, we demonstrate how integrating these complementary disciplines enables the identification of clinically actionable biomarkers for early detection, patient stratification, and personalized cancer therapeutics.
From Static Proteomes to Dynamic Modifications: Understanding Cancer's Molecular Landscape
In the pursuit of personalized cancer medicine, the large-scale study of cellular proteins, or proteomics, provides a comprehensive portrait of the molecular drivers of disease [1] [2]. It aims to characterize the entire complement of proteins, or proteome, which is dynamic and varies from cell to cell, reflecting the real-time functional state of a biological system [2]. By contrast, ubiquitinomics is a specialized sub-discipline that focuses specifically on the ubiquitin-modified subset of the proteome, known as the ubiquitinome [3] [4]. Ubiquitination is a post-translational modification (PTM) where a small protein, ubiquitin, is covalently attached to lysine residues on substrate proteins, fundamentally altering their fate [3]. This modification is a dynamic process, orchestrated by E1 (activating), E2 (conjugating), and E3 (ligase) enzymes, and reversed by deubiquitinases (DUBs) [3]. While proteomics offers a global view, ubiquitinomics delivers a focused investigation into a key regulatory mechanism that controls protein stability, localization, and activity, offering a unique lens through which to view cancer pathophysiology [5] [4].
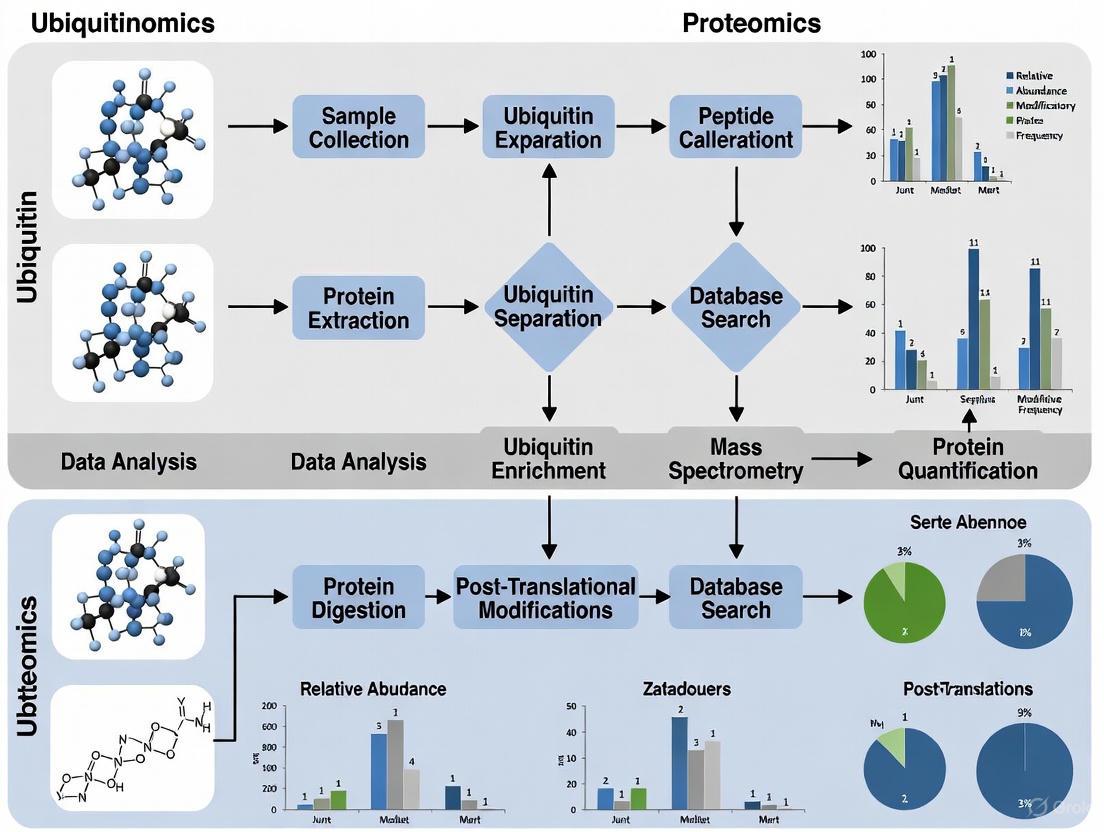
The following diagram illustrates the core focus and relationship between these two fields.
Figure 1: The Scope of Proteomics and Ubiquitinomics. Proteomics studies the entire proteome, while ubiquitinomics focuses on the ubiquitinome, a specific, modified subset of proteins.
Core Principles and Analytical Techniques
The Broad View of Proteomics
The fundamental goal of proteomics is the large-scale identification and quantification of proteins expressed by a genome [2]. This field acknowledges that the proteome is far more complex than the genome due to factors like alternative splicing, a vast dynamic range of protein abundances, and extensive post-translational modifications [2]. Proteomic technologies have been driven largely by advances in mass spectrometry (MS) [2]. Two primary strategies are employed:
- Gel-based proteomics: This mature approach involves separating complex protein mixtures using high-resolution two-dimensional gel electrophoresis (2DE), followed by excising protein spots of interest for identification by MS [2].
- Gel-free proteomics: This strategy often involves digesting proteins into peptides, which are then separated by liquid chromatography (LC) and directly analyzed by tandem mass spectrometry (LC-MS/MS) [1]. Methods like iTRAQ (Isobaric Tags for Relative and Absolute Quantitation) use isotopic tags to enable multiplexed quantification of proteins across different samples [6].
The Focused Lens of Ubiquitinomics
Ubiquitinomics is defined by its precise focus on mapping and quantifying ubiquitination events. The complexity of ubiquitin signaling is immense, as proteins can be modified by a single ubiquitin (monoubiquitination), multiple single ubiquitins (multiubiquitination), or chains of ubiquitin (polyubiquitination) linked through any of its seven lysine residues (K6, K11, K27, K29, K33, K48, K63), each potentially conferring a distinct functional consequence [3]. The primary challenge is the low stoichiometry of this modification; for any given protein, only a small fraction may be ubiquitinated at any time [3] [4].
To overcome this, enrichment strategies are critical prior to MS analysis. The most common method leverages the fact that trypsin digestion of ubiquitinated proteins leaves a characteristic di-glycine (Gly-Gly) remnant on the modified lysine. Antibodies specific for this K-ε-GG motif are used to immuno-enrich ubiquitinated peptides from complex digests, dramatically improving the detection of these low-abundance species [3] [4]. Quantitative techniques like SILAC (Stable Isotope Labeling with Amino acids in Cell culture) are then applied to compare ubiquitination sites across different conditions, such as before and after proteasome inhibition, to infer function [4].
Table 1: Core Conceptual and Methodological Comparison
| Feature | Proteomics | Ubiquitinomics |
|---|---|---|
| Analytical Focus | The entire proteome (all proteins) [2] | The ubiquitinome (ubiquitin-modified proteins) [3] [4] |
| Primary Objective | Protein identification, expression profiling, and quantification [2] | Mapping ubiquitination sites, identifying substrates, and characterizing chain topology [3] |
| Key Complexity | Vast dynamic range of protein concentrations; multiple PTMs [2] | Tremendous diversity of ubiquitin modifications (mono/poly, chain linkages) [3] |
| Core Enrichment Strategy | Pre-fractionation by 2DE or LC [2] | Immunoaffinity enrichment of K-ε-GG remnant peptides [3] [4] |
| Common Quantification Methods | iTRAQ, label-free spectral counting [6] [7] | SILAC, label-free based on enrichment [4] |
Application in Cancer Biomarker Discovery: A Comparative Outlook
Both fields hold immense promise for uncovering novel cancer biomarkers, but they illuminate different aspects of tumor biology.
Proteomics excels at discovering protein expression signatures associated with cancer. For instance, in gastric cancer, iTRAQ-based proteomic analysis of saliva revealed S100A8, S100A9, CST4, and CST5 as potential non-invasive biomarkers for detection [6]. Similarly, profiling tumor tissue-derived proteomes can identify panels of proteins, such as Vimentin (VIM) and Glial Fibrillary Acidic Protein (GFAP), with differential abundance across colon, kidney, liver, and brain cancers, useful for multi-class cancer distinction [7]. The strength of proteomics lies in its unbiased nature, capable of revealing unanticipated biology and providing a snapshot of the functional state of a tumor [8].
Ubiquitinomics, by contrast, investigates the dysregulation of protein stability and signaling in cancer. The Ubiquitin-Proteasome System (UPS) is critically involved in the pathogenesis of Non-Small Cell Lung Cancer (NSCLC), where ubiquitination regulates the stability of key oncoproteins and tumor suppressors like EGFR, p53, and PD-L1 [5]. For example, the deubiquitinating enzyme USP21 stabilizes the oncoprotein AURKA by removing its ubiquitin mark, thereby promoting laryngeal cancer progression [9]. Biomarkers derived from ubiquitinomics are not just about protein abundance but about the post-translational status of critical regulatory nodes. A transcriptomics-based study in Laryngeal Squamous Cell Carcinoma (LSCC) identified a panel of four ubiquitination-related biomarkers (WDR54, KAT2B, NBEAL2, LNX1), providing insights into molecular mechanisms and potential diagnostic utility [9].
Table 2: Comparative Analysis in Cancer Biomarker Discovery
| Aspect | Proteomics | Ubiquitinomics |
|---|---|---|
| Biomarker Type | Protein abundance signatures and proteoforms [8] [6] | Ubiquitination status of specific substrate proteins [5] [9] |
| Biological Insight | Functional state and phenotypic output of the cell/tumor [2] | Dysregulation of specific signaling pathways and protein turnover [3] [5] |
| Sample Types | Tissue, plasma, saliva, other biofluids [8] [6] | Primarily tissue, but applicable to biofluids with enrichment |
| Therapeutic Link | Identifies over/under-expressed proteins for targeting [1] | Directly identifies druggable E3 ligases and DUBs (e.g., PROTACs) [5] |
| Example Biomarkers | S100A8, S100A9 in gastric cancer saliva [6] | Ubiquitination-related WDR54, KAT2B in LSCC [9] |
Experimental Protocols in Practice
A Typical Proteomics Workflow for Biomarker Discovery (Saliva)
A standard protocol for biomarker discovery using iTRAQ and PRM in saliva involves [6]:
- Sample Collection & Preparation: Collect unstimulated saliva and centrifuge to remove cells and debris. Store the supernatant at -80°C.
- Protein Digestion and Labeling: Reduce, alkylate, and digest proteins with trypsin. Label the resulting peptides from different sample groups (e.g., cancer vs. control) with different iTRAQ tags.
- LC-MS/MS Analysis: Pool the labeled peptides and separate them using liquid chromatography. Analyze the eluting peptides with a tandem mass spectrometer (MS/MS) to acquire both identification and quantitative data.
- Data Analysis & Validation: Identify proteins and calculate differential expression based on iTRAQ reporter ions. Select candidate biomarkers and validate them in a separate cohort of samples using a targeted MS method like Parallel Reaction Monitoring (PRM) for high-confidence quantification.
The overall workflow from sample to discovery and validation is summarized below.
Figure 2: Proteomics Biomarker Workflow. Key steps from sample preparation to biomarker validation.
A Ubiquitinomics Workflow for Functional Signaling Analysis
A detailed protocol for analyzing ubiquitin signaling, particularly in response to proteasome inhibition, includes [4]:
- SILAC Labeling and Treatment: Culture two populations of cells in "light" (normal) and "heavy" (isotope-labeled) media. Treat the light cells with a proteasome inhibitor (e.g., MG132) and the heavy cells with a vehicle control (DMSO).
- Cell Lysis and Mixing: Lyse both cell populations and mix the light and heavy lysates in a 1:1 protein ratio.
- Trypsin Digestion and Enrichment: Digest the combined protein sample with trypsin. Use anti-K-ε-GG antibody beads to specifically enrich for ubiquitinated peptides from the complex peptide mixture.
- LC-MS/MS Analysis and Data Interpretation: Fractionate the enriched peptides and analyze by LC-MS/MS. The MS data will identify the ubiquitination site and the SILAC ratio will indicate changes in ubiquitin occupancy at that site. An increase in the light/heavy ratio (MG132/DMSO) suggests the site is involved in degradation signaling, as its occupancy increases when the proteasome is blocked.
This functional ubiquitinomics workflow is illustrated as follows.
Figure 3: Functional Ubiquitinomics Workflow. Quantitative workflow using SILAC and enrichment to study ubiquitin signaling.
The Scientist's Toolkit: Essential Research Reagents
Successful proteomics and ubiquitinomics studies rely on a suite of specialized reagents and platforms.
Table 3: Key Research Reagents and Solutions
| Reagent / Platform | Function | Field of Use |
|---|---|---|
| iTRAQ / TMT Tags | Isobaric chemical tags for multiplexed relative and absolute quantification of peptides in MS-based experiments. [6] | Proteomics |
| Anti-K-ε-GG Antibody | Monoclonal antibody for immunoaffinity enrichment of ubiquitinated peptides from tryptic digests. [3] [4] | Ubiquitinomics |
| SILAC Media | Cell culture media containing stable isotope-labeled essential amino acids (e.g., 13C6-Lysine) for metabolic labeling and quantitative MS. [4] | Proteomics / Ubiquitinomics |
| Proteasome Inhibitors (e.g., MG132, Bortezomib) | Small molecules that block the 26S proteasome, used to perturb the ubiquitin-proteasome system and stabilize ubiquitinated proteins. [5] [4] | Ubiquitinomics |
| Proteograph / Nanoparticle Platforms | Proprietary engineered nanoparticles to overcome the dynamic range problem in plasma proteomics by deeply profiling biofluits. [8] | Proteomics |
| High-Resolution Mass Spectrometer (e.g., Orbitrap Astral) | Advanced MS instrumentation providing the high speed, sensitivity, and resolution needed for large-scale protein and PTM identification. [8] | Proteomics / Ubiquitinomics |
Proteomics and ubiquitinomics are not competing but complementary forces in the battle against cancer. Proteomics provides the essential, wide-angle battlefield assessment, mapping the entire protein landscape to identify altered territories in disease. Ubiquitinomics, in contrast, offers a high-power lens on the precise molecular machinery controlling the fate of key proteins. The future of biomarker discovery lies in the integration of these approaches, layering global protein expression data with deep knowledge of ubiquitin-regulated pathways. This synergy, especially when combined with other omics data and powered by AI, will accelerate the development of robust diagnostic panels and reveal novel, druggable targets within the ubiquitin-proteasome system, such as PROTACs, ultimately paving the way for more effective precision oncology therapies [8] [5].
The ubiquitin-proteasome system (UPS) represents a master regulatory network that governs oncogenesis through precise control of protein stability and function. This review examines how dysregulation of ubiquitination and proteasomal degradation drives cancer pathogenesis, exploring the comparative utility of ubiquitinomics and proteomics for biomarker discovery. We synthesize evidence from multiple malignancies—including breast, prostate, colorectal, and lung cancers—to illustrate UPS alterations across cancer types. The analysis incorporates quantitative ubiquitinome profiles, experimental methodologies for UPS interrogation, and emerging therapeutic strategies that target this sophisticated regulatory system. By integrating large-scale ubiquitinomic datasets with functional proteomics, this work establishes a framework for understanding UPS-mediated oncogenic pathways and identifies promising directions for diagnostic and therapeutic development.
The ubiquitin-proteasome system constitutes the primary pathway for controlled intracellular protein degradation in eukaryotic cells, regulating approximately 80-90% of cellular proteins [10]. This sophisticated system operates through a sequential enzymatic cascade: ubiquitin-activating enzymes (E1) initiate the process, ubiquitin-conjugating enzymes (E2) intermediate the transfer, and ubiquitin ligases (E3) provide substrate specificity, ultimately tagging target proteins with ubiquitin chains for recognition and degradation by the 26S proteasome [11]. The specificity of this system is remarkable, with humans encoding only two E1 enzymes, approximately 35 E2 enzymes, and over 600 E3 ligases that confer precise substrate recognition [10].
Figure 1: The Ubiquitin-Proteasome Protein Degradation Pathway
In cancer biology, the UPS functions as a critical master regulator of oncogenic pathways through its governance of key proteins involved in cell cycle progression, apoptosis, DNA repair, and signal transduction [12] [10]. Malignant transformation frequently co-opts UPS components to stabilize oncoproteins, eliminate tumor suppressors, and activate proliferative signaling pathways. The clinical relevance of targeting this system was established with the FDA approval of proteasome inhibitors for multiple myeloma, validating the UPS as a legitimate therapeutic target in oncology [11].
Ubiquitinomics vs. Proteomics: Comparative Approaches for Biomarker Discovery
The emergence of ubiquitinomics—the large-scale study of ubiquitin-modified proteins—represents a technological advancement that complements traditional proteomics in cancer research. While conventional proteomics quantifies protein abundance, ubiquitinomics specifically maps ubiquitination sites and measures ubiquitin occupancy, providing deeper functional insights into protein regulation.
Table 1: Comparison of Proteomic and Ubiquitinomic Approaches in Cancer Research
| Parameter | Proteomics | Ubiquitinomics |
|---|---|---|
| Primary Focus | Protein identification and quantification | Mapping ubiquitination sites and ubiquitin occupancy |
| Key Metrics | Protein abundance, expression changes | Ubiquitin stoichiometry, site-specific occupancy changes |
| Technical Methods | LC-MS/MS, SILAC, label-free quantification | Ubiquitin remnant motif enrichment (K-ε-GG), SILAC with proteasome inhibition |
| Biological Insights | Protein expression patterns, pathway activation | Protein degradation signaling, regulatory mechanisms |
| Cancer Applications | Biomarker identification, molecular subtyping | Therapeutic target discovery, resistance mechanism elucidation |
| Sample Throughput | High (global profiling) | Moderate (requires enrichment) |
| Data Output | 4,000-6,000 proteins (typical study) | 1,500-2,500 ubiquitination sites (typical study) |
The integration of these complementary approaches generates a more comprehensive understanding of cancer pathophysiology. For instance, proteomic analyses of colorectal cancer tissues have identified approximately 4,712 quantifiable proteins, while parallel ubiquitinomic examinations characterized 1,690 quantifiable ubiquitination sites across 870 proteins [13]. This integrated profiling revealed that highly ubiquitinated proteins (containing ≥10 modification sites) are particularly enriched in biological processes including G-protein coupling, antigen presentation, and metabolic regulation.
Table 2: Experimentally Identified Ubiquitination Sites Across Cancers
| Cancer Type | Total Ubiquitination Sites Identified | Key Regulated Biological Processes | Reference |
|---|---|---|---|
| Colorectal Cancer | 1,690 sites across 870 proteins | Metabolic regulation, immune function, telomere maintenance | [13] |
| Prostate Cancer | 248 UPS-related genes with differential expression | Cell cycle progression, TNF response, immune signaling | [14] |
| Ovarian Cancer | Multiple novel HER2 ubiquitination sites | Receptor tyrosine kinase signaling, degradation vs. non-degradation signaling | [4] |
| Breast Cancer | Over-expression of 5 proteasome subunits | Protein degradation, stress response, growth regulation | [15] |
Experimental Methodologies: Deciphering the Ubiquitin Code
Ubiquitin Remnant Motif Enrichment and Proteomic Analysis
The foundational methodology for ubiquitinome mapping relies on the specific enrichment of ubiquitin-modified peptides following tryptic digestion. This approach capitalizes on the characteristic diglycine (K-ε-GG) "remnant" that remains attached to modified lysine residues after trypsinization. The standard workflow encompasses:
- Cell Culture and Proteasome Inhibition: SKOV3 ovarian cancer cells cultured in heavy SILAC media are treated with 20μM MG132 proteasome inhibitor for 6 hours to accumulate ubiquitinated substrates [4].
- Protein Extraction and Digestion: Cells are lysed in 8M urea buffer, reduced with TCEP, alkylated with iodoacetamide, and digested with trypsin overnight at 25°C using a 1:50 enzyme-to-substrate ratio [4] [13].
- Ubiquitinated Peptide Enrichment: Digested peptides are subjected to immunoaffinity purification using PTMScan Ubiquitin Remnant Motif Kit, which specifically recognizes the K-ε-GG motif [4].
- Liquid Chromatography-Mass Spectrometry: Enriched peptides are separated using nanoflow liquid chromatography with a 60-minute acetonitrile gradient (6-80% mobile phase B) and analyzed by tandem mass spectrometry with parallel accumulation-serial fragmentation (PASEF) detection [13].
- Data Processing and Stoichiometry Calculation: MS data are processed using MaxQuant against the UniProt human database, with ubiquitin occupancy calculated by comparing heavy and light peptide ratios [4].
Figure 2: Experimental Workflow for Ubiquitinomics Profiling
The Scientist's Toolkit: Essential Research Reagents
Table 3: Key Research Reagent Solutions for Ubiquitin-Proteasome Studies
| Reagent/Category | Specific Examples | Function/Application |
|---|---|---|
| Proteasome Inhibitors | MG132, Bortezomib, Carfilzomib | Block degradation of ubiquitinated proteins, enable accumulation for analysis |
| Ubiquitin Enrichment Kits | PTMScan Ubiquitin Remnant Motif Kit | Immunoaffinity purification of K-ε-GG modified peptides |
| Mass Spectrometry Labels | SILAC (13C6-15N4-L-Arg, 13C6-L-Lys) | Metabolic labeling for quantitative proteomics |
| Deubiquitinase Inhibitors | PR-619, VLX1570 | Inhibit DUB activity to preserve ubiquitin chains |
| E3 Ligase Modulators | Molecular glues (Lenalidomide), PROTACs | Targeted protein degradation for functional studies |
| Antibodies for Validation | Anti-ubiquitin, anti-K-ε-GG | Western blot, immunohistochemistry validation |
UPS Dysregulation Across Cancer Types: Ubiquitinome Profiles
Breast Cancer: Proteasomal Overactivation
Comprehensive analyses of breast cancer tissues reveal significant overexpression of multiple UPS components compared to adjacent normal tissue. RFDD-PCR and proteomic methodologies identified 3- to 32-fold increases in proteasomal activity and specific subunits, including:
- PSMB5, PSMD1, PSMD2, PSMD8, PSMD11: Proteasome subunits showing >3-fold overexpression [15]
- USP9X, USP9Y, USP10, USP25: Ubiquitin-specific peptidases with significant overexpression [15]
- UBE3A: Ubiquitin protein ligase demonstrating marked overexpression, validated by immunohistochemistry [15]
This enhanced proteasomal capacity enables breast cancer cells to rapidly degrade tumor suppressors and cell cycle regulators, facilitating uncontrolled proliferation and therapeutic resistance.
Prostate Cancer: Stage-Specific Ubiquitination Signatures
Ubiquitin-proteasome pathway-linked gene signatures provide prognostic indicators in prostate cancer, with distinct expression patterns across disease stages:
Early-Stage (pT3a/Gleason 3+4) Alterations:
- Upregulated: IKBKB (1.34-fold), UBQLN3 (6.0-fold), BRCA1 (1.24-fold) [14]
- Downregulated: TMUB2 (0.87-fold), UBE2S (0.68-fold) [14]
- Pathway Enrichment: Cellular response to tumor necrosis factor (GO:0071356) [14]
Advanced-Stage (pT3b/Gleason 4+3) Alterations:
- Upregulated: CDC20 (4.43-5.02-fold), UHRF1 (3.21-4.04-fold), UBE2C, UBE3C [14]
- Downregulated: HERPUD1 (0.52-0.56-fold) [14]
Metastatic-Stage (pT4/Gleason ≥8) Alterations:
A LASSO-Cox prognostic model identified six genes (LNX1, PSMD2, SUMO4, UBE2C, UBR5, UHRF1) with significant predictive value for biochemical recurrence-free survival [14].
Colorectal Cancer: Survival-Associated Ubiquitination Events
Ubiquitinomic profiling of colorectal cancer tissues identified 1,172 proteins with upregulated ubiquitination and 1,700 with downregulated ubiquitination compared to normal adjacent tissues [13]. Key findings include:
- Highly Ubiquitinated Proteins: PRKDC (49 ubiquitination sites), PARP14, SLC12A2, and SPG10 demonstrated exceptionally high ubiquitination site numbers (≥10 sites) [13]
- Motif Analysis: Five distinct ubiquitin recognition motifs were identified, suggesting specific E3 ligase preferences [13]
- Survival Correlation: Increased ubiquitination of FOCAD at Lys583 and Lys587 was potentially associated with patient survival outcomes [13]
Non-Small Cell Lung Cancer (NSCLC): Ubiquitination in Therapeutic Resistance
The UPS plays a significant role in NSCLC pathogenesis and resistance to targeted therapies:
- EGFR Regulation: WDR4-Cul4 complex inhibits PTPN23-mediated EGFR degradation, while USP22 stabilizes EGFR [5]
- KRAS Pathway: USP5 stabilizes Beclin1 to promote p53 degradation, while OTUD7B modulates mTORC2 complexes [5]
- Immune Checkpoints: Multiple USP family members (USP7, USP8, USP22) precisely regulate PD-L1 stability, influencing immune evasion [5]
Therapeutic Targeting of the UPS: From Inhibition to Targeted Degradation
Established Modalities: Proteasome Inhibitors
The clinical success of proteasome inhibitors in multiple myeloma validates the UPS as a therapeutic target. These inhibitors include:
- Bortezomib: First-in-class proteasome inhibitor targeting the chymotrypsin-like activity of the 20S proteasome [12] [10]
- Carfilzomib: Second-generation epoxyketone inhibitor with irreversible binding characteristics [11]
- Ixazomib: Oral proteasome inhibitor with improved convenience [11]
Despite their efficacy in hematological malignancies, proteasome inhibitors have demonstrated limited clinical utility in solid tumors, prompting development of more targeted approaches [12].
Emerging Strategies: Targeted Protein Degradation
PROTACs (Proteolysis-Targeting Chimeras): Heterobifunctional molecules that recruit E3 ligases to target specific proteins for degradation. These consist of:
Molecular Glue Degraders: Small molecules that induce neomorphic interactions between E3 ligases and target proteins, exemplified by:
- Immunomodulatory imide drugs (IMiDs): Thalidomide, lenalidomide, pomalidomide that recruit CRL4CRBN to degrade transcription factors IKZF1/IKZF3 [16]
- Novel CRBN recruiters: Phenyl glutarimide-based degraders targeting neosubstrates including KDM4B, G3BP2, and VCL [16]
High-throughput proteomic screening of CRBN ligands has identified degraders with exquisite selectivity for previously uncharacterized neosubstrates, substantially expanding the druggable proteome [16].
Combinatorial Approaches: UPS Inhibition with Epigenetic Modulators
Preclinical evidence supports combination therapies targeting both UPS and epigenetic pathways:
- HDAC inhibitors + Proteasome inhibitors: Enhanced apoptosis in solid cancer models [12]
- DNMT inhibitors + UPS targeting: Synergistic effects in hematological malignancies [12]
- Dual-pathway targeting: Potential for reduced adverse effects compared to standard chemotherapeutics [12]
The ubiquitin-proteasome system unquestionably functions as a master regulator of cancer pathways, governing protein stability, function, and abundance across virtually all oncogenic processes. The integration of ubiquitinomics with traditional proteomics provides unprecedented insights into the regulatory mechanisms driving cancer pathogenesis, offering:
- Novel Biomarkers: Site-specific ubiquitination signatures with prognostic and predictive value
- Therapeutic Targets: Identification of dysregulated E3 ligases and DUBs for targeted intervention
- Resistance Insights: Elucidation of post-translational mechanisms underlying treatment failure
- Combinatorial Strategies: Rational design of synergistic treatment approaches
As ubiquitinomic technologies continue to advance—with improved enrichment strategies, quantitative accuracy, and computational analysis—their integration with functional proteomics will undoubtedly yield transformative insights into cancer biology and therapeutic development. The ongoing refinement of UPS-targeting agents, particularly molecular glues and PROTACs, promises to expand the druggable proteome and overcome limitations of conventional therapeutics. Through continued mapping of the cancer ubiquitinome and its functional integration with proteomic signatures, we move closer to realizing the promise of precision oncology for diverse cancer types.
The pursuit of cancer biomarkers has evolved from a singular focus on expression levels to a more nuanced understanding of protein function. While traditional proteomics provides a quantitative map of the proteome, it often overlooks functional alterations that drive tumorigenesis. Ubiquitinomics, a specialized branch of proteomics that characterizes protein ubiquitination, addresses this gap by capturing crucial functional information about protein regulation, stability, and activity. This guide objectively compares the capabilities of ubiquitinomics and conventional proteomics in biomarker discovery, demonstrating through experimental data how analyzing protein function provides deeper biological insights and more clinically relevant discoveries than expression analysis alone.
In classical proteomics, the primary objective has been to identify and quantify protein expression changes between normal and diseased states. However, cancer biology is driven not merely by which proteins are present, but by how they function. Protein function encompasses catalytic activity, protein-protein interactions, localization, and post-translational modifications (PTMs) that collectively determine biological outcomes. The limitation of mere expression analysis becomes particularly evident when considering that proteins with unchanged abundance may undergo functional alterations through mutations or PTMs that fundamentally change their activity [17].
Ubiquitinomics represents a functional proteomics approach that systematically studies the ubiquitin code—a complex post-translational modification system that regulates protein degradation, signaling, and localization. Unlike conventional proteomics that answers "how much" of a protein exists, ubiquitinomics addresses "what happens to" proteins in the cancer environment, providing critical insights into the functional rewiring of cellular pathways in tumorigenesis [18].
Comparative Analysis: Ubiquitinomics vs. Conventional Proteomics
Table 1: Technical and Analytical Comparison between Proteomics and Ubiquitinomics
| Parameter | Conventional Proteomics | Ubiquitinomics |
|---|---|---|
| Primary Focus | Protein identification and quantification | Ubiquitin-modified protein analysis |
| Information Gained | Expression levels, abundance changes | Protein stability, degradation signals, functional regulation |
| Key Methodology | LC-MS/MS with label-free or isobaric tagging (TMT, iTRAQ) | Ubiquitin enrichment (antibodies, UBD domains) + LC-MS/MS |
| Sample Complexity | Total proteome | Ubiquitin-modified subproteome |
| Data Interpretation | Differential expression analysis | Ubiquitination site mapping, pathway activity inference |
| Functional Insight | Indirect | Direct assessment of regulatory mechanisms |
| Biomarker Potential | Expression-based biomarkers | Function-based biomarkers reflecting pathway activity |
Table 2: Capability Assessment for Cancer Biomarker Discovery
| Capability | Conventional Proteomics | Ubiquitinomics |
|---|---|---|
| Detection of Dysregulated Pathways | Moderate | High |
| Identification of Drug Targets | Limited to abundance changes | High (identifies stabilized/degraded targets) |
| Prognostic Value | Moderate (based on expression) | High (reflects functional state) |
| Therapeutic Monitoring | Expression changes | Direct degradation monitoring |
| Technical Complexity | Moderate | High (requires specialized enrichment) |
| Functional Context | Low | High |
Experimental Evidence: Functional Analysis Reveals What Expression Cannot
Case Study: Mutation Impacts on Protein vs. mRNA Expression
A comprehensive analysis of mutation impacts across six cancer types revealed striking disparities between mRNA and protein expression, highlighting the necessity of functional protein-level analysis [19].
Experimental Protocol:
- Sample Cohort: 953 cancer cases across breast cancer (BRCA), colorectal cancer (CRC), clear cell renal cell carcinoma (CCRCC), lung adenocarcinoma (LUAD), ovarian cancer (OV), and uterine corpus endometrial carcinoma (UCEC)
- Multi-Omic Profiling: Paired DNA sequencing, RNA sequencing, and global proteomic profiling via mass spectrometry
- Statistical Analysis:
- Multiple regression adjusted for age, gender, ethnicity, and batch effects
- Identification of somatic expression quantitative trait loci (seQTLs) and somatic protein QTLs (spQTLs)
- False discovery rate (FDR) control at < 0.05
- Validation: Cross-referencing with massively parallel assays of variant effects (MAVE) for TP53 mutations
Key Findings:
- Only 47.2% of somatic mutations affecting mRNA expression (seQTLs) showed concordant effects on protein expression
- Truncating mutations in genes like NF1 and ARID1A in UCEC showed disproportionate impact on protein abundance not explained by transcriptomics
- TP53 missense mutations in multiple cancer types significantly increased protein expression without corresponding mRNA changes
- Protein-specific QTLs (spsQTLs) identified mutations affecting protein stability, degradation, or translation efficiency
Case Study: Proteotranscriptomic Integration in Breast Cancer
An integrated proteotranscriptomic analysis of breast cancer demonstrated that increased protein-mRNA concordance itself associates with aggressive disease and poor survival outcomes [20].
Experimental Protocol:
- Sample Preparation: 65 breast tumors and 53 adjacent non-cancerous tissues
- Protein Extraction: Tissue pulverization under liquid nitrogen, protein digestion with trypsin
- LC-MS Analysis: Untargeted approach with 17 fractions per sample, analyzed via LTQ FT MS
- Data Processing:
- SEQUEST HT algorithm against UniProt Homo sapiens database
- Protein-level FDR cutoff of 5%
- DESeq2 for differential expression analysis
- rlog normalization for protein-mRNA correlation assessment
Key Findings:
- Proteome analysis revealed activation of infection-related pathways in basal-like tumors not detected by transcriptomics
- Global increase in protein-mRNA concordance associated with aggressive subtypes (basal-like/triple-negative)
- Highly correlated protein-gene pairs enriched in protein processing and metabolic pathways
- Increased protein-mRNA concordance predicted decreased patient survival
Experimental Workflows and Signaling Pathways
Ubiquitinomics Workflow for Functional Assessment
Functional Impact of Mutations on Protein Regulation
The Scientist's Toolkit: Essential Research Reagents and Materials
Table 3: Key Research Reagents for Ubiquitinomics and Proteomics Studies
| Reagent/Material | Function | Application Examples |
|---|---|---|
| Trypsin (Protease) | Protein digestion into peptides for MS analysis | Standard sample preparation in both proteomics and ubiquitinomics [20] [18] |
| TMT (Tandem Mass Tag) Labels | Multiplexed isobaric labeling for quantitative comparison | Comparing protein expression across multiple samples simultaneously [18] |
| Anti-Ubiquitin Antibodies | Immunoaffinity enrichment of ubiquitinated peptides | Isolation of ubiquitinated proteins prior to LC-MS/MS analysis |
| Ubiquitin-Binding Domains (UBDs) | Alternative enrichment method for ubiquitinated proteins | Selective capture of specific ubiquitin chain types |
| LC-MS/MS Systems | High-resolution separation and detection of peptides | Core analytical platform for both proteomics and ubiquitinomics [19] [20] |
| Protein Extraction Buffers | Cell lysis and protein solubilization | Initial sample preparation with protease and deubiquitinase inhibitors |
| Database Search Algorithms | Peptide identification from mass spectra | SEQUEST, MaxQuant for identifying proteins and ubiquitination sites [20] |
The evidence compellingly demonstrates that protein function provides more clinically relevant information than expression levels alone in cancer research. Ubiquitinomics enables researchers to move beyond static protein inventories to dynamic assessments of protein regulation, stability, and activity that more accurately reflect the functional state of tumors. While conventional proteomics remains valuable for initial discovery phases, the integration of ubiquitinomics and other functional proteomics approaches provides a more comprehensive understanding of tumor biology that can accelerate biomarker development and therapeutic discovery. The future of cancer proteomics lies in combining quantitative and functional analyses to create multidimensional maps of tumor proteomes that reflect both abundance and activity states.
Protein ubiquitination, a fundamental post-translational modification, has emerged as a central regulator of oncogenesis and tumor suppression. This reversible process involves the covalent attachment of ubiquitin molecules to target proteins, subsequently determining their stability, localization, and function [21]. The ubiquitin-proteasome system (UPS) represents a sophisticated regulatory network that extends far beyond protein degradation, encompassing critical roles in signal transduction, DNA damage response, and cell cycle progression [21]. When dysregulated, ubiquitination pathways contribute significantly to the acquisition of canonical cancer hallmarks, including sustained proliferation, evasion of growth suppressors, and resistance to cell death [22].
The emerging field of ubiquitinomics—the comprehensive study of ubiquitinated proteins and their modifications—provides unique insights into cancer mechanisms that often remain invisible to conventional proteomics. While traditional proteomics quantifies protein abundance, ubiquitinomics reveals the dynamic post-translational landscape that regulates protein activity, localization, and turnover within cancer cells [23]. This distinction is particularly relevant for biomarker discovery, as ubiquitination changes often precede and trigger alterations in protein abundance, offering potentially earlier detection windows and more mechanistically informative biomarkers for cancer diagnosis and therapeutic development [23] [7].
Ubiquitination Mechanisms and Regulatory Networks
The Ubiquitination Machinery
The ubiquitination cascade involves a sequential enzymatic process mediated by three key enzyme classes:
- E1 ubiquitin-activating enzymes: Initiate ubiquitination by activating ubiquitin in an ATP-dependent manner
- E2 ubiquitin-conjugating enzymes: Receive and transfer activated ubiquitin
- E3 ubiquitin ligases: Confer substrate specificity by recognizing target proteins and facilitating ubiquitin transfer [21] [24]
E3 ubiquitin ligases represent the most diverse and specialized component of this system, with approximately 600 members in humans that determine substrate recognition and biological specificity [24]. The complexity of ubiquitin signaling is further enhanced by the ability of ubiquitin itself to form polymer chains through different lysine residues (e.g., K48, K63), with K48-linked chains typically targeting substrates for proteasomal degradation and K63-linked chains often regulating signal transduction and DNA repair [25].
Visualization of Ubiquitination Networks
Table 1: Key Experimental Methods for Studying Ubiquitination in Cancer
| Method | Application | Key Insights | References |
|---|---|---|---|
| Ubiquitination-Induced Fluorescence Complementation (UiFC) | Visualizing K48 ubiquitination dynamics in live cells | Revealed rapid accumulation of K48 ubiquitin at nascent presynaptic terminals; applicable to studying protein clustering in cancer | [25] |
| Anti-K-ε-GG antibody enrichment + LC-MS/MS | System-wide identification of ubiquitination sites | Identified 400 differentially ubiquitinated proteins with 654 sites in lung squamous cell carcinoma | [23] |
| Immunohistochemistry + Tissue microarrays | Validation of ubiquitination biomarkers in clinical specimens | Confirmed increased vimentin and MRP1 in LSCC tissues correlated with decreased patient survival | [23] [7] |
| Network analysis of E3-substrate relationships | Mapping ubiquitination regulatory networks | Constructed comprehensive maps of 41,392 ubiquitination sites from 12,786 proteins; revealed novel E3-substrate relationships | [24] |
Figure 1: Ubiquitination Cascade and Functional Outcomes. The enzymatic cascade of E1-E2-E3 enzymes mediates ubiquitin transfer to substrate proteins. Different polyubiquitin chain linkages determine functional fates, primarily proteasomal degradation (K48-linked) or signaling activation (K63-linked).
Ubiquitination in Cancer Hallmarks: Degradation Networks
Regulation of Tumor Suppressors by Ubiquitin-Mediated Degradation
The ubiquitin-proteasome system exerts precise control over key tumor suppressor proteins, with their aberrant degradation representing a common oncogenic mechanism across cancer types:
p53 Ubiquitination by MDM2 The p53 tumor suppressor serves as a paradigm for ubiquitin-mediated regulation in cancer. Under normal conditions, the E3 ligase MDM2 maintains p53 at low levels by facilitating its polyubiquitination and subsequent proteasomal degradation [21]. This regulatory loop ensures that p53 activity is appropriately constrained in healthy cells. However, in many cancers, MDM2 gene amplification or overexpression leads to hyperactivation of this degradation pathway, resulting in excessive p53 destruction even in the presence of DNA damage [21]. This mechanism allows cancer cells to bypass critical cell cycle checkpoints and apoptosis, contributing significantly to uncontrolled proliferation and genomic instability. The clinical relevance of this pathway is underscored by the development of therapeutic strategies aimed at disrupting MDM2-p53 interactions to reactivate p53 function in tumors [21].
Additional Tumor Suppressor Networks Beyond p53, numerous other tumor suppressors fall under ubiquitin-mediated control:
- RB (Retinoblastoma protein): Regulates G1 to S phase transition and is inactivated in many cancers through phosphorylation-induced ubiquitination and degradation [21]
- APC (Adenomatous polyposis coli): Frequently inactivated in colon cancer through mutations that disrupt its ubiquitin-mediated degradation function [21]
- PTEN: A critical tumor suppressor whose ubiquitination and degradation are linked to prostate cancer and glioblastoma development [21]
Oncoprotein Stabilization Through Dysregulated Ubiquitination
Equally important in cancer pathogenesis is the stabilization of oncoproteins resulting from disrupted ubiquitination:
c-Myc Stabilization The c-Myc transcription factor, a potent driver of cell proliferation, is normally maintained at appropriate levels through ubiquitin-mediated degradation orchestrated by E3 ligases such as FBW7 [21]. In cancer, mutations in FBW7 or deregulation of other ubiquitin ligases lead to c-Myc stabilization and overexpression, driving unchecked cell growth and survival in various leukemias, lymphomas, and solid tumors [21].
Ras Signaling Pathway The Ras family of small GTPases, including frequently mutated KRas, is regulated by ubiquitination through E3 ligases such as Cbl, which promotes Ras ubiquitination and degradation [21]. In cancer, mutations that disrupt these regulatory mechanisms lead to constitutive Ras signaling activation, fostering tumor growth, metastasis, and therapeutic resistance [21].
Table 2: Key Ubiquitination Regulatory Nodes in Cancer Hallmarks
| Target Protein | Role in Cancer | Regulating E3 Ligase | Effect of Dysregulation | Cancer Associations |
|---|---|---|---|---|
| p53 | Tumor suppressor | MDM2 | Excessive degradation enables uncontrolled proliferation | Breast, lung, colorectal cancers |
| c-Myc | Oncoprotein | FBW7 | Stabilization drives proliferation | Leukemias, lymphomas, solid tumors |
| Ras | Oncoprotein | Cbl | Stabilization promotes signaling | Pancreatic, colorectal, lung cancers |
| p27 | CDK inhibitor | SKP2 | Degradation allows cell cycle progression | Prostate, gastric cancers |
| Vimentin | Metastasis marker | TRIM2 (predicted) | Decreased ubiquitination increases stability | Lung squamous cell carcinoma |
Ubiquitination in Cancer Hallmarks: Signaling Networks
Cell Cycle Regulation Through Ubiquitination
Ubiquitination serves as a critical timer for cell cycle progression, controlling the stability of cyclins, cyclin-dependent kinases (CDKs), and their inhibitors:
Cyclin Degradation Cyclins activate CDKs to drive cell cycle progression, with their periodic degradation essential for phase transitions. For example, cyclin E degradation by the APC/C E3 ligase complex prevents premature S-phase entry [21]. In cancers, dysregulation of this ubiquitin-mediated degradation results in cyclin overexpression or stabilization, driving continuous cell cycle progression independent of proper signals [21]. Overactivation of cyclins D and E is commonly observed in breast, lung, and colorectal cancers.
CDK Inhibitor Regulation CDK inhibitors including p21 and p27 normally function as cell cycle brakes by inhibiting CDK activity. Ubiquitination mediated by SCF complexes targets these inhibitors for degradation, allowing cell cycle progression [21]. In cancer, overactive ubiquitination leads to excessive degradation of CDK inhibitors, removing critical restraints on cell division [21].
DNA Damage Response and Ubiquitination
The DNA damage response (DDR) relies heavily on ubiquitin signaling to determine cell fate decisions between repair and apoptosis:
BRCA1 Regulation The BRCA1 tumor suppressor, crucial for DNA repair, is regulated by ubiquitination. Mutations affecting its ubiquitination pathway impair DNA repair function, increasing susceptibility to breast and ovarian cancers [21].
p53 in DNA Damage Ubiquitination of p53 following DNA damage helps dictate whether cells undergo repair or apoptosis, highlighting the intersection between ubiquitination, tumor suppressor regulation, and genome integrity maintenance [21].
Figure 2: Ubiquitination-Mediated Regulation of Cancer Hallmarks. The ubiquitin-proteasome system contributes to multiple cancer hallmarks through distinct mechanistic pathways involving both degradation and non-degradative signaling functions.
Ubiquitinomics Versus Proteomics in Cancer Biomarker Discovery
Methodological Comparison
The distinction between ubiquitinomics and conventional proteomics approaches has significant implications for cancer biomarker discovery:
Ubiquitinomics Workflow Ubiquitinomics specifically targets the ubiquitinated portion of the proteome using anti-K-ε-GG antibodies to enrich ubiquitinated peptides prior to LC-MS/MS analysis [23]. This approach allows identification and quantification of ubiquitination sites, providing direct insight into post-translational regulatory events rather than simply measuring protein abundance [23]. For example, in lung squamous cell carcinoma (LSCC), this method identified 400 differentially ubiquitinated proteins with 654 ubiquitination sites, revealing metabolic reprogramming and altered cell adhesion networks that might remain undetected by standard proteomics [23].
Traditional Proteomics Approach Conventional proteomics analyzes total protein content using techniques such as liquid chromatography-mass spectrometry (LC-MS) and protein microarrays to identify differential protein expression across biological states [1]. While valuable for cataloging protein abundance changes, this approach may miss critical regulatory events occurring at the post-translational level.
Table 3: Comparison of Ubiquitinomics and Proteomics Approaches in Cancer Research
| Parameter | Ubiquitinomics | Traditional Proteomics |
|---|---|---|
| Analytical Focus | Ubiquitination sites and modifications | Protein identification and abundance |
| Key Enrichment Step | Anti-K-ε-GG antibody enrichment | Various fractionation methods (e.g., SDS-PAGE) |
| Biological Insight | Regulatory mechanisms, protein turnover | Protein expression changes |
| Cancer Biomarker Potential | Functional regulation, early detection | Abundance alterations, classification |
| Technical Challenge | Low-abundance modification detection | Dynamic range limitations |
| Representative Findings | Decreased vimentin ubiquitination in LSCC [23] | Differential protein panels for multiclass cancer [7] |
Clinical Applications and Biomarker Potential
Ubiquitination-related proteins show significant promise as cancer biomarkers for diagnosis, prognosis, and therapeutic monitoring:
E3 Ligases as Biomarkers
- MDM2: Overexpression associated with poor prognosis in breast, lung, and colorectal cancers [21]
- SKP2: High expression linked to increased invasiveness and poor prognosis in prostate and gastric cancers [21]
Deubiquitinases (DUBs) as Biomarkers
- USP7: Overexpression implicated in progression of various cancers through stabilization of both MDM2 and p53 [21]
- USP9X: Associated with chemotherapy resistance through stabilization of anti-apoptotic protein MCL-1 [21]
Ubiquitination Substrates as Biomarkers
- p53 ubiquitination status: Correlates with cancer invasiveness and treatment response [21]
- Vimentin ubiquitination: Decreased ubiquitination associated with increased protein stability in LSCC [23]
The clinical relevance of ubiquitination biomarkers is further supported by integrative multi-omics analyses. For example, combining ubiquitinomics data with transcriptomics from TCGA database revealed that highly expressed VIM and IGF1R mRNAs correlated with poorer prognosis in LSCC, while highly expressed ABCC1 mRNA associated with better prognosis [23].
The Scientist's Toolkit: Research Reagent Solutions
Table 4: Essential Research Reagents for Ubiquitination Studies
| Reagent/Category | Function/Application | Examples/Specifics | Research Context |
|---|---|---|---|
| Anti-K-ε-GG Antibodies | Enrichment of ubiquitinated peptides for MS | Commercial monoclonal antibodies | Ubiquitinomics profiling [23] |
| UiFC Plasmids | Visualizing K48 ubiquitination in live cells | pcDNA3-UiFC-C and pcDNA3-UiFC-N | Live-cell ubiquitination dynamics [25] |
| E3 Ligase Libraries | Screening for substrate recognition | Collections of 494+ non-redundant E3s | Ubiquitination network mapping [24] |
| Proteasome Inhibitors | Block degradation to study ubiquitination | Bortezomib, carfilzomib | Substrate identification [21] [23] |
| Ubiquitin Binding Domains | Detection and purification of ubiquitinated proteins | UIM, UBA, BUZ domains | Affinity capture for MS analysis [21] |
| Activity-Based Probes | Profiling deubiquitinating enzyme activities | Ubiquitin-based chemical probes | DUB inhibitor development [21] |
Experimental Protocols for Key Ubiquitination Studies
Ubiquitinomics Profiling from Tissue Samples
The following protocol has been successfully applied to identify differentially ubiquitinated proteins in lung squamous cell carcinoma:
Tissue Processing and Protein Extraction
- Mix tissue samples (150mg per patient, typically 5 patients per group) to create pooled samples
- Homogenize in urea lysis buffer (7M urea, 2M thiourea, 100mM DTT, 1mM PMSF)
- Sonicate (80W, 10s pulses with 15s intervals, 10 cycles)
- Centrifuge at 15,000×g for 20 minutes at 4°C
- Collect supernatant and quantify protein using Bradford method [23]
Trypsin Digestion and Peptide Preparation
- Reduce samples with DTT (10mM final, 37°C for 1.5 hours)
- Alkylate with iodoacetamide (50mM final, room temperature for 30 minutes in darkness)
- Digest with trypsin (1:50 trypsin:protein ratio) at 37°C for 15-18 hours
- Acidify with trifluoroacetic acid (0.1% final, pH ≤3)
- Desalt using C18 cartridges [23]
Ubiquitinated Peptide Enrichment and LC-MS/MS Analysis
- Enrich ubiquitinated peptides using anti-K-ε-GG antibody-based capture
- Perform liquid chromatography using C18 columns (75μm, 12cm)
- Elute with linear gradient from H2O/CH3CN (95:5) to H2O/CH3CN (70:30) over 70 minutes
- Analyze using LTQ FT MS with full MS scan (400-1600 m/z) followed by data-dependent MS/MS of five most intense ions [23]
Data Analysis
- Search data against Swiss-Prot database using SEQUEST algorithm
- Apply PeptideProphet scoring (threshold ≥0.7) for identification confidence
- Identify differentially ubiquitinated proteins using spectral counting or label-free quantification [23]
Ubiquitination-Induced Fluorescence Complementation (UiFC)
The UiFC method enables visualization of K48-linked ubiquitination dynamics in live cells:
Principle UiFC utilizes split Venus fluorescent protein fragments fused to ubiquitin-interacting motifs that specifically recognize K48-linked ubiquitin chains. When in proximity due to binding to the same ubiquitin chain, the fragments reconstitute a functional fluorescent protein, producing a detectable signal [25].
Neuronal Culture and Transfection
- Prepare primary hippocampal neurons from E17 rat embryos
- Maintain in neurobasal medium with B27 supplement
- Transfect at days in vitro (DIV) 7/8 using appropriate transfection reagents
- Employ plasmids: pcDNA3-UiFC-C (UiFC-C) and pcDNA3-UiFC-N (UiFC-N) [25]
Imaging and Analysis
- Image live cells using standard fluorescence microscopy
- Quantify UiFC signal accumulation at regions of interest
- Perform colocalization analysis with organelle or protein markers
- For presynaptic formation studies, utilize microfluidic devices to isolate axons [25]
Validation
- Verify specificity using K48-specific ubiquitin antibodies
- Confirm dependency on E1-mediated ubiquitination using E1 inhibitors [25]
Therapeutic Implications and Future Perspectives
The central role of ubiquitination in cancer pathogenesis has motivated developing therapeutic strategies targeting this system:
Targeting Ubiquitination Enzymes
E3 Ligase Inhibitors Several E3 ligases represent promising drug targets due to their substrate specificity and frequent dysregulation in cancer. MDM2 inhibitors aim to reactivate p53 by disrupting MDM2-p53 interactions, with multiple candidates in clinical development [21]. Similarly, inhibitors targeting other cancer-relevant E3 ligases such as SCF complexes are under investigation [21].
DUB Inhibitors Deubiquitinating enzymes that stabilize oncoproteins represent another therapeutic avenue. USP7 and USP9X inhibitors could potentially counteract their oncogenic effects by promoting degradation of stabilized oncoproteins like MCL-1 [21].
Proteasome Inhibitors and Beyond
Proteasome inhibitors including bortezomib and carfilzomib have established clinical efficacy in hematological malignancies by inducing proteotoxic stress in cancer cells [21] [23]. Next-generation approaches include:
Molecular Glues These small molecules induce proximity between E3 ubiquitin ligases and target proteins, enabling degradation of previously "undruggable" targets [26]. This approach is experiencing rapid growth in preclinical research and early clinical development [26].
Radiopharmaceuticals Combining ubiquitination-targeting vectors with radioactive isotopes represents an emerging strategy for precise cancer therapy. Candidates such as FPI-2265 (in phase 2/3 trials for prostate cancer) and Radio-DARPins (entering clinical trials in 2025) leverage specific targeting for localized radiation delivery [26].
The expanding toolkit for modulating ubiquitination pathways, combined with increasingly sophisticated ubiquitinomics approaches for patient stratification and treatment monitoring, promises to advance personalized cancer therapy based on the ubiquitination signatures of individual tumors.
The discovery and clinical implementation of robust cancer biomarkers represent a critical pathway for advancing precision oncology. Biomarkers, defined as measurable indicators of biological processes or pathogenic responses, are indispensable for early cancer detection, accurate prognosis, and predicting treatment responses [27] [28]. Despite tremendous technological advancements and the discovery of thousands of candidate biomarkers, a striking discrepancy exists between research output and clinical adoption, with an estimated success rate of only 0.1% for biomarker translation into routine clinical practice [27] [29]. This translation gap represents a significant clinical imperative that must be addressed to fulfill the promise of personalized cancer medicine.
The challenges in biomarker translation are multifaceted, stemming from issues in study design, analytical validation, clinical utility assessment, and regulatory hurdles [27] [29]. This review examines the biomarker translation pipeline through the comparative lens of proteomics—the large-scale study of proteins and their functions—and the more specialized field of ubiquitinomics, which focuses on the system-wide analysis of protein ubiquitination. By comparing these complementary approaches, we aim to provide researchers with a strategic framework for navigating the complex journey from biomarker discovery to clinical application.
The Biomarker Development Pipeline: From Discovery to Clinical Implementation
Phases of Biomarker Development
The path from initial discovery to clinically implemented biomarkers follows a structured pipeline with distinct phases [29]:
- Preclinical Exploratory Phase: Identification of promising leads through unbiased or targeted discovery approaches
- Clinical Assay Development and Validation: Establishment of robust, clinically applicable assays
- Retrospective Longitudinal Studies: Assessment of biomarker performance using archived specimens
- Prospective Screening Studies: Evaluation in intended-use population with predefined endpoints
- Cancer Control Phase: Implementation in clinical practice and assessment of impact on population health
This phased approach ensures rigorous evaluation at each step, yet many biomarkers fail to progress beyond the early stages due to issues with analytical validity, clinical utility, or practical implementation [27] [29]. The use of "samples of convenience" collected without specific biomarker intentions, inadequate statistical power, and poorly defined clinical endpoints contribute significantly to this attrition rate [27].
Analytical and Clinical Considerations
For successful translation, biomarkers must demonstrate both analytical and clinical validity [29]. Analytical validity refers to the assay's accuracy, precision, sensitivity, and specificity in measuring the biomarker, while clinical validity establishes that the biomarker reliably predicts the clinical phenotype of interest [30] [29]. Key statistical metrics for evaluating biomarker performance include sensitivity, specificity, positive and negative predictive values, and receiver operating characteristic (ROC) curves with area under the curve (AUC) analysis [30].
Table 1: Key Performance Metrics for Biomarker Evaluation
| Metric | Definition | Clinical Significance |
|---|---|---|
| Sensitivity | Proportion of true positives correctly identified | Ability to detect disease when present |
| Specificity | Proportion of true negatives correctly identified | Ability to correctly exclude disease |
| Positive Predictive Value | Proportion of test positives with the disease | Probability of disease given positive test |
| Negative Predictive Value | Proportion of test negatives without the disease | Probability of no disease given negative test |
| ROC-AUC | Overall discrimination ability | Diagnostic accuracy across all thresholds |
The intended use of a biomarker must be defined early in development, as this determines the required evidence and regulatory pathway [30]. Biomarkers can serve as diagnostic tools for detecting cancer, prognostic indicators of disease course, or predictive markers of treatment response [27] [28] [31].
Proteomics in Cancer Biomarker Discovery
Technological Platforms and Workflows
Proteomics has emerged as a powerful tool for cancer biomarker discovery, providing direct insight into the functional molecules that drive oncogenic processes [1] [18]. Mass spectrometry (MS)-based technologies form the cornerstone of modern proteomics, enabling large-scale protein identification and quantification [18]. The general workflow involves protein extraction from clinical samples (tissues, blood, or other biofluids), protease digestion (typically with trypsin), peptide fractionation to reduce complexity, and liquid chromatography-mass spectrometry (LC-MS/MS) analysis [7] [18].
Two primary quantitative approaches dominate the field: label-based methods using isobaric tags (TMT, iTRAQ) or stable isotope labeling (SILAC), and label-free techniques based on spectral counting or signal intensity [18]. Label-based approaches offer higher accuracy but increased cost and complexity, while label-free methods provide greater scalability for large sample cohorts [18].
Figure 1: Proteomics Workflow for Biomarker Discovery
Applications in Cancer Research
Proteomics has been successfully applied across multiple cancer types to identify biomarkers for early detection, classification, and therapeutic monitoring. In gastrointestinal cancers, proteomic analysis of conditioned media from primary tumor tissues identified 12 differentially expressed proteins—including vimentin (VIM), pyruvate kinase M2 (PKM2), and various keratins—that could distinguish between colon, kidney, liver, and brain tumors [7]. Similarly, in hepatocellular carcinoma (HCC), isobaric labeling TMT proteomics revealed that phosphorylation of ALDOA promotes glycolysis and proliferation in CTNNB1-mutated HCC cells [18].
The strength of proteomics lies in its ability to provide direct measurement of functional effector molecules, capturing post-translational modifications, protein-protein interactions, and pathway activities that cannot be deduced from genomic or transcriptomic analyses alone [1] [18]. This provides a more comprehensive view of the oncogenic processes driving tumor progression.
Ubiquitinomics: A Specialized Frontier in Cancer Proteomics
The Ubiquitin-Proteasome System in Cancer
Ubiquitinomics represents a specialized subset of proteomics focused on system-wide analysis of protein ubiquitination, a crucial post-translational modification that regulates protein degradation, signaling, and localization [18]. The ubiquitin-proteasome system (UPS) plays a fundamental role in controlling cellular processes frequently dysregulated in cancer, including cell cycle progression, apoptosis, and DNA repair [18]. As such, comprehensive profiling of ubiquitin signatures offers unique opportunities for biomarker discovery and therapeutic targeting.
Ubiquitination involves the covalent attachment of ubiquitin molecules to target proteins, forming complex chains that determine the protein's fate. The specificity of ubiquitination is controlled by E3 ubiquitin ligases, while deubiquitinating enzymes (DUBs) remove ubiquitin modifications, creating a dynamic regulatory system [18]. Cancer cells often exploit this system to destabilize tumor suppressors or stabilize oncoproteins, making ubiquitinomics particularly relevant for understanding cancer mechanisms.
Methodological Approaches in Ubiquitinomics
Ubiquitinomics employs specialized enrichment strategies to isolate and identify ubiquitinated peptides from complex protein mixtures. The most common approach utilizes antibodies specific for di-glycine remnants left on tryptic peptides after ubiquitination, followed by LC-MS/MS analysis [18]. Advanced methods have also been developed to distinguish between different ubiquitin chain linkages, which can have distinct functional consequences for the modified proteins.
Figure 2: Ubiquitinomics Workflow for Biomarker Discovery
Quantitative ubiquitinomics can reveal dynamic changes in the ubiquitin landscape in response to therapeutic interventions or during disease progression. For example, profiling ubiquitination changes in response to proteasome inhibitors has identified novel regulators of therapy resistance in multiple cancer types [18]. These approaches provide unique insights into protein turnover dynamics and regulatory mechanisms that are invisible to conventional proteomic methods.
Comparative Analysis: Ubiquitinomics vs. Proteomics for Biomarker Translation
Technical and Analytical Considerations
The translation potential of biomarkers discovered through proteomic versus ubiquitinomic approaches differs significantly in terms of technical requirements, clinical applicability, and validation strategies. The table below provides a direct comparison of these complementary approaches:
Table 2: Comparative Analysis of Proteomics vs. Ubiquitinomics for Biomarker Development
| Parameter | Proteomics | Ubiquitinomics |
|---|---|---|
| Analytical Focus | Protein expression, abundance, and modifications | Specific ubiquitination events and patterns |
| Biological Insight | Steady-state protein levels | Protein turnover, degradation dynamics, signaling regulation |
| Technical Complexity | Moderate to high | High (requires specialized enrichment) |
| Clinical Applicability | Broad (diagnosis, prognosis, monitoring) | Targeted (therapy response, resistance mechanisms) |
| Assay Translation | Established pathways (ELISA, immunoassays) | Emerging technologies, primarily MS-based |
| Regulatory Precedence | Multiple FDA-approved protein biomarkers | Limited clinical implementation to date |
| Strength | Comprehensive molecular profiling | Functional insight into regulatory mechanisms |
| Sample Requirements | Standard collection protocols | Critical preservation of modification states |
Clinical Translation Potential
Proteomics offers a broader pathway for clinical translation, with established technologies like immunoassays (ELISA, IHC) that can be readily implemented in clinical laboratories [29]. Several protein biomarkers have successfully navigated the FDA approval process, including the OVA1 test for ovarian cancer, which measures five protein biomarkers in blood [32]. The transition from discovery platforms (e.g., mass spectrometry) to clinical assays often requires method adaptation, as demonstrated by OVA1, which was initially developed on SELDI technology but ultimately implemented using immunoassays to achieve required precision levels [29].
In contrast, ubiquitinomics faces greater translational challenges due to the technical complexity of preserving and measuring ubiquitination states in clinical specimens. The dynamic nature of ubiquitin modifications and the need for specialized analytical platforms currently limit their implementation in routine clinical practice. However, ubiquitinomics provides unparalleled insight into drug mechanism of action and resistance pathways, making it particularly valuable for pharmacodynamic biomarker development and therapy personalization [18].
The Scientist's Toolkit: Essential Research Reagents and Platforms
Successful biomarker translation requires careful selection of research reagents and platforms that ensure analytical rigor and reproducibility. The following table outlines essential tools for proteomics and ubiquitinomics research:
Table 3: Research Reagent Solutions for Biomarker Discovery
| Reagent/Platform | Function | Application Notes |
|---|---|---|
| Mass Spectrometers (LTQ FTMS, Q-Exactive) | Protein/peptide identification and quantification | High-resolution instruments essential for complex samples [7] |
| Chromatography Systems (nanoLC, HPLC) | Peptide separation prior to MS analysis | Critical for reducing sample complexity [7] [18] |
| Trypsin | Proteolytic digestion of proteins | Standard enzyme for bottom-up proteomics [7] [18] |
| Isobaric Tags (TMT, iTRAQ) | Multiplexed quantitative proteomics | Enable simultaneous analysis of multiple samples [18] |
| Anti-diGly Antibodies | Enrichment of ubiquitinated peptides | Essential for ubiquitinomics studies [18] |
| Protein Arrays | High-throughput protein profiling | Useful for validation studies [31] |
| Database Search Tools (SEQUEST, MaxQuant) | Protein identification from MS data | Require curated databases for accurate identification [7] |
| Statistical Analysis Packages | Biomarker candidate selection | Must control for multiple comparisons [30] |
Experimental Protocols for Biomarker Discovery and Validation
Tissue-Derived Proteome Profiling Protocol
The following protocol, adapted from cancer biomarker studies [7], outlines the standard workflow for tissue-based biomarker discovery:
Sample Collection and Preparation:
- Obtain tissue specimens with appropriate ethical approval and histological confirmation
- Rinse tissue pieces with PBS and place in defined medium (DMEM/F12 with growth factor cocktail) overnight at 4°C
- Centrifuge at 2,000 rpm for 10 minutes and desalt conditioned media using PD-10 columns
Protein Extraction and Digestion:
- Solubilize protein pellets in 7M urea, 2M thiourea, and 25mM ammonium bicarbonate
- Desalt using spin columns and quantify protein concentration with BCA assay
- Reduce with 5mM DTT at 50°C for 30 minutes, then alkylate with 15mM iodoacetamide
- Digest with trypsin (1:50 ratio) at 37°C overnight
LC-MS/MS Analysis:
- Load trypsin-digested samples onto C18 analytical columns (75μm, 12cm)
- Elute peptides using linear gradient from 5% to 30% acetonitrile over 70 minutes
- Acquire full MS scan (400-1600 m/z) followed by data-dependent MS/MS of the five most intense ions
Data Processing and Biomarker Identification:
- Search MS/MS data against Swiss-Prot database using SEQUEST algorithm
- Apply PeptideProphet filter (score ≥0.7) for confident identifications
- Perform quantitative analysis using spectral counting or label-free quantification
Biomarker Validation Protocol
Transitioning from discovery to validation requires orthogonal methods to confirm biomarker candidates [29]:
Analytical Validation:
- Assess precision (within-run, between-run), trueness, limit of detection, and linearity
- Evaluate analyte stability under storage conditions and freeze-thaw cycles
- Determine reference intervals in relevant populations
Clinical Validation:
- Perform retrospective analysis using predefined endpoints in independent sample sets
- Assess diagnostic sensitivity and specificity using ROC curve analysis
- For predictive biomarkers, test treatment-biomarker interaction in randomized trial data [30]
Assay Implementation:
- Transition from discovery platform (MS) to clinical applicable format (immunoassay)
- Establish quality control procedures and reference materials
- Document analytical performance following regulatory guidelines (FDA, CLIA) [29]
The translation gap in cancer biomarkers represents both a challenge and opportunity for the oncology research community. Addressing this gap requires a multifaceted strategy that incorporates rigorous study design, robust analytical validation, and clear clinical utility from the earliest stages of biomarker development [27] [29]. While proteomics offers a broader path to clinical implementation with established translation pathways, ubiquitinomics provides unique functional insights into cancer mechanisms, particularly for understanding drug responses and resistance.
Future progress will likely depend on integrated multi-omics approaches that combine proteomics, ubiquitinomics, genomics, and metabolomics to create comprehensive molecular portraits of cancer biology [31] [32]. The emergence of artificial intelligence and machine learning tools for analyzing complex biomarker data offers promising avenues for identifying subtle patterns with clinical significance [32]. Furthermore, the development of novel technologies such as liquid biopsies for circulating tumor DNA and proteins, nanotechnology-based detection platforms, and high-throughput multiplexed assays will expand the possibilities for non-invasive cancer detection and monitoring [32].
By understanding the relative strengths and translational considerations of proteomics versus ubiquitinomics, researchers can make strategic decisions in biomarker development, ultimately accelerating the delivery of clinically impactful tools that improve cancer diagnosis, treatment selection, and patient outcomes. The clinical imperative is clear: only through deliberate, collaborative, and rigorous approaches to biomarker validation will we successfully bridge the translation gap and realize the full potential of precision oncology.
Advanced Technological Platforms: Mapping the Cancer Ubiquitinome and Proteome
In the pursuit of cancer biomarkers, proteomics has become an indispensable tool for characterizing protein expression, post-translational modifications (PTMs), and signaling pathway alterations in tumor biology. Mass spectrometry (MS)-based workflows now enable deep, quantitative profiling of complex proteomes from clinical specimens. Within this landscape, Data-Independent Acquisition (DIA), Tandem Mass Tag (TMT), and Isobaric Tags for Relative and Absolute Quantitation (iTRAQ) have emerged as three principal methodologies for global proteomic analysis [33] [34]. The selection of an appropriate workflow profoundly influences the depth of proteome coverage, quantitative accuracy, and practical feasibility of large-scale studies, particularly in the context of ubiquitinomics for biomarker discovery [35]. Ubiquitination, a critical PTM, regulates diverse cellular processes including protein degradation, and its dysregulation is extensively associated with carcinogenesis [35] [34]. This guide provides an objective comparison of DIA, TMT, and iTRAQ workflows, framing their performance within the specific challenges of cancer proteomics and ubiquitinomics.
TMT (Tandem Mass Tag) and iTRAQ (Isobaric Tags for Relative and Absolute Quantitation)
TMT and iTRAQ are isobaric chemical labeling techniques that enable multiplexed relative quantification of proteins across multiple samples [36].
- Principle of Operation: Peptides from different samples are labeled with amine-reactive tags that have identical total mass (isobaric). The tags consist of a mass reporter group, a balance group, and a reactive group that covalently binds to peptide N-termini and lysine side chains [36]. Labeled peptides are pooled and analyzed simultaneously by LC-MS/MS. In MS2 spectra, fragmentation of the tags generates low-mass reporter ions whose intensities provide relative quantification of the peptide across samples [33] [36].
- Key Characteristics: TMT is available in 6-plex, 10-plex, and 16-plex configurations, while iTRAQ typically offers 4-plex or 8-plex kits [33] [36]. This multiplexing capacity allows direct comparison of multiple samples in a single MS run, reducing instrument time and technical variation [37].
DIA (Data-Independent Acquisition)
DIA is a label-free acquisition technique that provides comprehensive, reproducible profiling of complex proteomes [33] [38].
- Principle of Operation: Instead of selectively isolating top-intensity precursors as in traditional Data-Dependent Acquisition (DDA), DIA cycles through sequential, wide isolation windows (e.g., 25 m/z) covering a broad mass range (400-1200 m/z). All peptides within each window are fragmented simultaneously, producing highly complex MS2 spectra containing fragments from all co-eluting peptides [33] [38]. Peptide identification and quantification rely on extracting fragment ion chromatograms using project-specific spectral libraries [38].
- Key Characteristics: As a label-free method, DIA does not require chemical tagging, simplifying sample preparation and eliminating labeling efficiency concerns. Its sequential isolation of all ions ensures consistent data acquisition across samples, minimizing missing values [33].
The diagram below illustrates the core operational principles and workflow differences between these techniques.
Performance Comparison in Proteomic Studies
Independent comparative studies have systematically evaluated the performance of DIA and TMT workflows for quantitative proteomics. A multi-laboratory evaluation conducted by researchers from the Leibniz Institute on Aging and Biognosys provides key experimental insights [37].
Experimental Design and Comparative Data
In a benchmark study published in the Journal of Proteome Research, researchers compared TMT (MS3-based) and DIA workflows using 10 biological replicates of mouse cerebellum tissue spiked with UPS1 protein standard at five different concentrations [37]. This design enabled assessment of identification depth, quantitative precision, and accuracy under controlled conditions.
Key Findings: The TMT method identified 15-20% more proteins with somewhat better quantitative precision, while the DIA approach demonstrated superior quantitative accuracy [37]. Both methods quantified over 5,000 proteins with minimal missing values (<2%), confirming their robustness for comprehensive proteome analysis [37].
Comprehensive Technique Comparison
The table below synthesizes performance characteristics across multiple parameters based on published comparisons and technical specifications.
Table 1: Comprehensive Comparison of DIA, TMT, and iTRAQ Workflows
| Parameter | DIA | TMT | iTRAQ |
|---|---|---|---|
| Quantification Principle | Label-free, MS2 fragment intensity [33] | Isobaric labeling, MS2/MS3 reporter ions [33] [36] | Isobaric labeling, MS2 reporter ions [36] |
| Multiplexing Capacity | Unlimited (sample number not limited by kit) [39] | Up to 16-18 samples (limited by kit) [33] [39] | 4-8 samples (limited by kit) [36] |
| Identification Coverage | High with full-scan coverage [33] | Relatively high [33] | Moderate [36] |
| Quantitative Reproducibility | High [33] | High [33] | Moderate to High [36] |
| Quantitative Accuracy | High [37] | Moderate (MS3 improves accuracy) [37] | Subject to ratio compression [36] |
| Missing Values | Fewer missing values [33] | Fewer missing values [33] | Variable |
| Sample Throughput | High, suitable for large cohorts [33] | Limited by multiplexing capacity [33] | Limited by multiplexing capacity [36] |
| Cost Considerations | Medium (no labeling reagents) [33] | High (reagent costs) [33] | High (reagent costs) [36] |
| Sample Requirement | Low (e.g., 2 µg digest) [37] | Higher (e.g., 20 µg digest) [37] | Similar to TMT [36] |
| PTM Analysis Suitability | Excellent for ubiquitinomics [35] | Good with enrichment [40] | Good with enrichment [36] |
Workflow Protocols and Experimental Methodologies
TMT/iTRAQ Experimental Workflow
The standardized protocol for TMT-based proteomics involves multiple critical steps [40]:
- Sample Preparation: Proteins are extracted from tissues or cells, reduced, alkylated, and digested with trypsin to generate peptides. For tissue samples, this typically involves homogenization in urea/thiourea buffers followed by enzymatic digestion [40].
- Chemical Labeling: Peptides from different samples are labeled with respective TMT or iTRAQ reagents. For a 10-plex TMT experiment, 300 µg of peptides per sample is recommended for deep proteome coverage [40].
- Sample Pooling and Fractionation: Labeled peptides are combined into a single tube. To reduce complexity and increase proteome coverage, the pooled sample undergoes high-pH reversed-phase fractionation, typically into 96 fractions which are then consolidated into 24-48 samples for analysis [40].
- LC-MS/MS Analysis: Fractions are analyzed sequentially by LC-MS/MS using an Orbitrap Fusion Lumos mass spectrometer. The MS3 method is preferred for TMT quantification to minimize precursor interference [37] [40].
- Data Analysis: Raw files are processed using software such as Proteome Discoverer or FragPipe for protein identification and quantification based on reporter ion intensities [41].
DIA Experimental Workflow
The DIA workflow for proteomic analysis, particularly suitable for ubiquitinomics studies [35]:
- Sample Preparation: Proteins are extracted and digested similarly to labeled approaches, but without the need for chemical tagging. For ubiquitinomics, tryptic digestion produces peptides with di-glycine (K-ε-GG) remnants at ubiquitination sites [35].
- Peptide Enrichment (for PTM analysis): For ubiquitinomics, ubiquitinated peptides are enriched using anti-K-ε-GG antibody beads (e.g., PTMScan Ubiquitin Remnant Motif Kit) [35]. This critical step increases the abundance of low-abundance ubiquitinated peptides prior to MS analysis.
- LC-MS/MS with DIA Acquisition: Peptides are separated by liquid chromatography and analyzed using a DIA method on a Q Exactive or similar instrument. The mass spectrometer cycles through 25-35 precursor isolation windows (e.g., 400-1200 m/z) throughout the chromatographic gradient, fragmenting all ions in each window [35] [38].
- Spectral Library Generation: A project-specific spectral library is typically created by analyzing a subset of samples using both DIA and traditional DDA methods, or by using existing resource libraries [38].
- Data Analysis: DIA data are processed using specialized software such as Spectronaut, DIA-NN, or Skyline, which match experimental spectra to the spectral library for peptide identification and quantification [41] [38].
Application in Ubiquitinomics for Cancer Biomarker Discovery
The study of ubiquitination presents particular challenges and considerations for mass spectrometry workflow selection. A quantitative ubiquitinomics study on human lung squamous cell carcinoma (LSCC) demonstrates the application of these principles [35].
Ubiquitinomics Workflow Considerations
- Choice of Label-Free DIA: The LSCC study employed anti-K-ε-GG antibody-based enrichment combined with label-free LC-MS/MS [35]. Researchers noted that compared to isotope-labeling methods (iTRAQ/TMT) that introduce salts, acids, and basic factors that negatively impact antibody-antigen reactions, label-free quantitative proteomics is preferred for endogenous ubiquitination analysis [35].
- Experimental Findings: The LSCC ubiquitinomics study characterized 627 ubiquitin-modified proteins and 1,209 ubiquitination sites, revealing involvement in critical tumor-associated pathways including mTOR, HIF-1, and PI3K-Akt signaling [35]. This demonstrates the power of DIA-based ubiquitinomics for identifying potential therapeutic targets.
Ubiquitinomics Pathway Analysis in Cancer
The molecular pathways identified through ubiquitinomics provide insights into cancer mechanisms, as illustrated below.
The Scientist's Toolkit: Essential Research Reagents and Software
Successful implementation of DIA, TMT, or iTRAQ workflows requires specific reagents, instruments, and computational tools.
Table 2: Essential Research Solutions for Proteomics Workflows
| Category | Item | Function | Representative Examples |
|---|---|---|---|
| Labeling Reagents | TMT Kits | Multiplexed peptide labeling for relative quantification | TMTpro 16-plex [37] |
| iTRAQ Kits | 4-plex or 8-plex peptide labeling | iTRAQ 4-plex [36] | |
| Enrichment Tools | Anti-K-ε-GG Antibody | Immuno-enrichment of ubiquitinated peptides | PTMScan Ubiquitin Remnant Motif Kit [35] |
| Mass Spectrometers | LC-MS/MS Systems | Peptide separation, fragmentation, and detection | Orbitrap Fusion Lumos, Q Exactive [37] [38] |
| Software Platforms | Proteome Discoverer | Commercial software for TMT/iTRAQ data analysis | Thermo Fisher Scientific [41] |
| Spectronaut | Commercial DIA data analysis, gold standard | Biognosys [41] [38] | |
| DIA-NN | Free, high-performance DIA software | Open-source [41] [38] | |
| MaxQuant/Perseus | Free platform for LFQ and TMT analysis | Max Planck Institute [41] | |
| FragPipe/MSFragger | Open-source platform with ultra-fast search | University of Michigan [41] | |
| Skyline | Free tool for targeted DIA analysis | University of Washington [41] |
The choice between DIA, TMT, and iTRAQ workflows depends heavily on research goals, sample characteristics, and resource constraints.
- TMT/iTRAQ is advantageous for studies with limited samples that fit within multiplexing capacity, particularly when maximizing protein identification depth is prioritized and labeling costs are acceptable. The built-in sample multiplexing reduces instrumental run time and technical variability for medium-scale projects [33] [37].
- DIA excels in large-scale clinical cohorts, studies requiring high quantitative accuracy, and ubiquitinomics applications where label-free approaches improve antibody-based enrichment efficiency. Its unlimited multiplexing capacity and suitability for large sample numbers make it ideal for biomarker discovery studies [33] [35] [37].
For cancer ubiquitinomics, the label-free nature of DIA provides distinct advantages for PTM analysis, though TMT-based approaches with extensive fractionation can achieve exceptional depth for global proteome profiling [35] [40]. As proteogenomic integration advances in precision oncology, selecting the appropriate mass spectrometry workflow becomes crucial for generating comprehensive, clinically actionable insights into cancer biology.
The comprehensive profiling of the ubiquitinome is critical for understanding cancer pathogenesis and discovering novel biomarkers. Among various enrichment strategies, the anti-K-ε-GG antibody-based method has emerged as a premier technology for large-scale ubiquitination analysis. This review objectively compares the performance of K-ε-GG antibody enrichment with alternative methodologies, providing experimental data and protocols to guide researchers in selecting appropriate ubiquitinome capture strategies for cancer biomarker discovery. When optimized, this approach enables identification of >20,000 ubiquitination sites in single experiments, dramatically advancing our capacity to decipher disease-relevant ubiquitination events in cancer systems.
Protein ubiquitination is a fundamental post-translational modification (PTM) that regulates diverse cellular processes including protein degradation, signal transduction, DNA repair, and endocytosis [3] [42]. Unlike simpler PTMs, ubiquitination involves covalent attachment of a 8.6 kDa ubiquitin protein to substrate lysines, creating remarkable complexity through mono-ubiquitination, multiple mono-ubiquitination, and polyubiquitin chains of various linkages [3] [43]. The ubiquitin system is frequently disrupted in human cancers, with numerous E3 ligases and deubiquitinases (DUBs) acting as oncogenes or tumor suppressors [44].
Ubiquitinomics versus Proteomics for Biomarker Discovery While conventional proteomics provides comprehensive protein abundance measurements, it fails to capture the dynamic regulation of protein function through ubiquitination. Ubiquitinomics specifically addresses this limitation by mapping ubiquitination sites and quantifying their changes under pathological conditions. This distinction is particularly relevant in cancer research where ubiquitination often regulates key oncoproteins and tumor suppressors without necessarily altering their overall abundance [13] [44]. The integration of ubiquitinomics with total proteome analysis has revealed that ubiquitination frequently regulates cancer-relevant pathways including metabolism, immune regulation, and telomere maintenance [13].
K-ε-GG Antibody-Based Enrichment: Principle and Optimization
Fundamental Principle
The K-ε-GG antibody-based method exploits a unique signature generated during tryptic digestion of ubiquitinated proteins. When trypsin cleaves ubiquitin-conjugated proteins, it leaves a di-glycine (GG) remnant attached to the ε-amino group of modified lysines, creating a K-ε-GG motif [3] [45]. Commercial antibodies specifically recognizing this remnant enable highly selective enrichment of ubiquitinated peptides from complex proteomic digests, significantly enhancing detection sensitivity for low-abundance ubiquitination events [46] [45].
Methodological Optimization
Substantial improvements to the original workflow have dramatically enhanced performance. Key optimizations include:
- Antibody cross-linking: Treatment with dimethyl pimelimidate (DMP) stabilizes antibody-bead conjugates, reducing contamination and improving reproducibility [45]
- Peptide input and antibody ratio: Systematic titration identifies optimal peptide-to-antibody ratios, typically 31μg antibody per 5mg peptide input [45]
- Off-line fractionation: Basic reversed-phase chromatography reduces sample complexity prior to enrichment, significantly increasing ubiquitinome coverage [45]
- SILAC quantification: Incorporation of stable isotope labeling enables precise quantification of ubiquitination changes in response to cellular perturbations [45]
These refinements collectively enable routine identification and quantification of approximately 20,000 distinct ubiquitination sites from moderate protein inputs (5mg per SILAC channel), representing a 10-fold improvement over early implementations [45].
Performance Comparison of Ubiquitin Enrichment Strategies
Table 1: Comparison of Major Ubiquitin Enrichment Methodologies
| Method | Principle | Throughput | Sites Identified | Advantages | Limitations |
|---|---|---|---|---|---|
| K-ε-GG Antibody | Immunoaffinity enrichment of tryptic peptides with di-glycine remnant | High | ~20,000/single experiment [45] | High specificity; applicable to any biological source; requires no genetic manipulation | Cannot distinguish ubiquitin chain architecture; antibody cost |
| Ubiquitin Tagging | Expression of epitope-tagged ubiquitin (His, Strep, Flag) | Medium | ~750/single experiment [43] | Easy implementation; relatively low cost | Artificial system; cannot study tissues; potential structural interference |
| Pan-Ubiquitin Antibody | Immunoaffinity enrichment of ubiquitinated proteins using antibodies recognizing ubiquitin | Medium | ~100s/experiment [43] | Enriches intact ubiquitinated proteins; enables chain architecture studies | Lower specificity; limited sensitivity; high background |
| UBD-Based Enrichment | Affinity purification using ubiquitin-binding domains (TUBEs) | Medium | Variable | Protects ubiquitin chains from DUBs; preserves linkage information | Limited availability; potential linkage preference |
Table 2: Quantitative Performance of Optimized K-ε-GG Workflow in Cancer Studies
| Study | Cancer Type | Samples | Ubiquitination Sites Identified | Key Findings |
|---|---|---|---|---|
| CRC Ubiquitinome [13] | Colorectal cancer | 6 tumor/adjacent normal tissues | 1,690 quantifiable sites | FOCAD ubiquitination at Lys583/587 associated with patient survival |
| LSCC Ubiquitinome [35] | Lung squamous cell carcinoma | 5 tumor/adjacent control tissues | 1,209 ubiquitinated lysine sites | Ubiquitination regulates mTOR, HIF-1, PI3K-Akt pathways |
| Optimized Workflow [45] | Jurkat cells (model system) | 5mg protein input per condition | ~20,000 sites/single experiment | 10-fold improvement over previous methods |
Experimental Protocol for K-ε-GG-Based Ubiquitinome Analysis
Sample Preparation and Digestion
- Cell Lysis: Lyse cells or tissues in denaturing buffer (8M urea, 50mM Tris-HCl pH 7.5, 150mM NaCl) supplemented with protease inhibitors (aprotinin, leupeptin, PMSF) and deubiquitinase inhibitors (PR-619) to preserve endogenous ubiquitination [45]
- Protein Quantification: Determine protein concentration using bicinchoninic acid (BCA) assay
- Reduction and Alkylation: Reduce proteins with 5mM dithiothreitol (45min, room temperature) and alkylate with 10mM iodoacetamide (30min, room temperature in dark) [45]
- Trypsin Digestion: Dilute lysates to 2M urea with 50mM Tris-HCl and digest with sequencing-grade trypsin (1:50 enzyme:substrate ratio) overnight at 25°C [45]
- Peptide Desalting: Acidify with formic acid and desalt using C18 solid-phase extraction cartridges [45]
Peptide Fractionation
- Basic Reversed-Phase Chromatography: Resuspend peptides in solvent A (2% MeCN, 5mM ammonium formate, pH 10) and separate using Zorbax 300 Extend-C18 column with 64-min gradient [45]
- Non-contiguous Pooling: Collect 80 fractions and combine into 8 pooled fractions using non-adjacent pooling strategy (e.g., combine fractions 1, 9, 17, 25, 33, 41, 49, 57, 65, 73) to reduce quantitative variability [45]
K-ε-GG Peptide Enrichment
- Antibody Cross-linking: Wash anti-K-ε-GG antibody beads with 100mM sodium borate (pH 9.0) and cross-link with 20mM dimethyl pimelimidate for 30min at room temperature. Block with 200mM ethanolamine (pH 8.0) for 2h at 4°C [45]
- Immunoaffinity Enrichment: Incubate peptide fractions with cross-linked antibody beads (31μg antibody per fraction) for 1h at 4°C with rotation [45]
- Washing and Elution: Wash beads extensively with ice-cold PBS and elute K-ε-GG peptides with 0.15% trifluoroacetic acid [45]
- Desalting: Desalt enriched peptides using C18 StageTips prior to LC-MS/MS analysis [45]
LC-MS/MS Analysis and Data Processing
- Chromatography: Separate peptides using nanoflow LC system with C18 column and 2h gradient from 6% to 30% mobile phase B (0.1% formic acid in acetonitrile) [13]
- Mass Spectrometry: Analyze peptides using high-resolution tandem mass spectrometer (e.g., Q Exactive, timsTOF Pro) with data-dependent acquisition [35]
- Database Search: Process raw files using MaxQuant or similar platform against appropriate database with K-ε-GG (GlyGly) as variable modification [13]
- Bioinformatic Analysis: Perform statistical analysis, motif discovery, and pathway enrichment to identify biologically relevant ubiquitination changes [13]
Research Reagent Solutions
Table 3: Essential Research Reagents for K-ε-GG Ubiquitinome Studies
| Reagent | Function | Example Specifications |
|---|---|---|
| Anti-K-ε-GG Antibody | Immunoaffinity enrichment of ubiquitinated peptides | Rabbit IgG, recognizes K-ε-GG motif; 1.47 mg/mL concentration [47] |
| Protease Inhibitors | Prevent protein degradation during lysis | Aprotinin (2μg/mL), leupeptin (10μg/mL), PMSF (1mM) [45] |
| DUB Inhibitors | Preserve endogenous ubiquitination | PR-619 (50μM) [45] |
| Trypsin | Protein digestion to generate K-ε-GG peptides | Sequencing grade, 1:50 enzyme-to-substrate ratio [45] |
| Cross-linking Reagent | Stabilize antibody-bead conjugates | Dimethyl pimelimidate (20mM in sodium borate, pH 9.0) [45] |
| Chromatography Column | Peptide fractionation | Zorbax 300 Extend-C18 (9.4 × 250 mm, 300 Å, 5 μm) [45] |
Integration with Cancer Biology and Therapeutic Development
The K-ε-GG antibody approach has revealed extensive ubiquitination alterations in diverse cancers. In colorectal cancer, ubiquitinome analysis identified 1,690 quantifiable sites with specific changes in FOCAD ubiquitination associated with patient survival [13]. In lung squamous cell carcinoma, 1,209 ubiquitinated lysine sites were characterized, revealing involvement in mTOR, HIF-1, and PI3K-Akt signaling pathways [35]. These findings highlight the value of ubiquitinomics for identifying novel therapeutic targets and biomarkers.
The specificity of E3 ligases and DUBs makes them attractive drug targets. Currently, only proteasome inhibitor bortezomib is FDA-approved for cancer, but numerous E3-targeting compounds are in development [44]. Ubiquitinome profiling provides critical pharmacodynamic biomarkers for these emerging therapies by quantifying drug-induced changes in substrate ubiquitination.
Diagram 1: Integration of K-ε-GG ubiquitinomics in cancer research. The K-ε-GG antibody method serves as a primary approach that complements conventional proteomics and enables biomarker discovery, therapeutic target identification, and mechanism elucidation.
K-ε-GG antibody-based enrichment represents the current gold standard for comprehensive ubiquitinome analysis in cancer research. When properly optimized, this method provides unprecedented depth of coverage, quantitative accuracy, and applicability to diverse biological specimens including clinical tissues. While alternative methods offer specific advantages for studying ubiquitin chain architecture or protecting labile ubiquitination, the K-ε-GG approach delivers the most practical solution for large-scale biomarker discovery efforts. As cancer therapeutics increasingly target the ubiquitin system, this methodology will play an essential role in validating target engagement and identifying response biomarkers for personalized cancer medicine.
In the evolving landscape of cancer research, proteomics has established itself as an indispensable counterpart to genomics. While ubiquitinomics focuses on the specific and complex system of protein degradation and signaling, broad-scale proteomics provides a comprehensive picture of disease phenotypes and functional mechanisms at the cellular level [48]. The integration of these approaches is accelerating the discovery of novel biomarkers, understanding of disease mechanisms, and identification of therapeutic targets. Within this context, high-plex proteomic technologies capable of simultaneously quantifying hundreds to thousands of proteins from minimal sample volumes have emerged as transformative tools. Two leading platforms—the aptamer-based SomaScan assay and the Olink Proximity Extension Assay (PEA)—have demonstrated particular promise in advancing cancer biomarker discovery in liquid biopsies [49]. This guide provides an objective comparison of these technologies, supported by experimental data and methodological details, to inform researchers and drug development professionals in their platform selection process.
SomaScan: Aptamer-Based Proteomic Profiling
The SomaScan platform utilizes Slow Off-rate Modified Aptamers (SOMAmers)—single-stranded, chemically-modified nucleic acids—as protein capture reagents [50]. These SOMAmers are selected through the Systematic Evolution of Ligands by EXponential Enrichment (SELEX) process, optimized for high affinity, slow off-rate, and high specificity to target proteins [51]. The current SomaScan 11K assay can simultaneously measure 11,000 human proteins from sample volumes as low as 55 µL, covering approximately half of the human proteome in a single assay [52].
The SomaScan workflow involves several key steps:
- Incubation: The sample is incubated with SOMAmers, allowing protein-SOMAmer complexes to form.
- Capture and Wash: Complexes are captured and washed to remove non-specifically bound proteins.
- Elution and Quantification: Bound proteins are eluted, and SOMAmers are quantified via hybridization to complementary sequences on a microarray chip [53] [50].
The fluorescence intensity measured correlates directly with the original protein concentration in the sample, reported in Relative Fluorescence Units (RFU) [53].
Olink PEA: Immunoassay with PCR Amplification
Olink's Proximity Extension Assay (PEA) technology combines antibody-based immunoassays with the sensitivity of polymerase chain reaction (PCR) amplification [48]. Unlike traditional immunoassays, PEA uses matched antibody pairs labeled with unique DNA oligonucleotides for each protein target. The platform offers flexible scalability across multiple product lines, from high-plex Explore panels to targeted Focus and Flex panels [54] [48].
The PEA technology follows these essential steps:
- Dual Recognition: Two matched antibodies, each labeled with unique DNA oligonucleotides, bind to the same target protein.
- Proximity Extension: When both antibodies bind in close proximity, their DNA tails hybridize and serve as a template for DNA polymerase, creating a double-stranded DNA "barcode" unique to the specific protein.
- Amplification and Detection: The barcode is amplified and quantified using either qPCR (Target platform) or next-generation sequencing (Explore platform) [48].
The resulting Normalized Protein eXpression (NPX) values provide relative quantification of protein abundance on a log2 scale [55].
Comparative Performance Analysis
Platform Specifications and Technical Performance
Table 1: Platform Specifications and Technical Performance Comparison
| Parameter | SomaScan | Olink PEA |
|---|---|---|
| Technology Basis | Modified aptamers (SOMAmers) | Paired antibodies with DNA tags |
| Current Multiplexing | 11,000 proteins [52] | 3,071 proteins (Explore 3072) [48] |
| Sample Volume | 55 µL (11K) [52] | 1-6 µL [48] |
| Dynamic Range | 8-10 logs [50] | >10 logs [48] |
| Reproducibility (Median CV) | 5-7% [52] [50] | <10% intra-assay, <20% inter-assay [54] |
| Measurement Units | Relative Fluorescence Units (RFU) [50] | Normalized Protein eXpression (NPX) [55] |
| Specificity Mechanism | SOMAmer protein binding | Dual antibody recognition |
Experimental Data from Comparative Studies
Table 2: Experimental Comparison Data from Published Studies
| Study Context | Correlation Range Between Platforms | Key Findings | Reference |
|---|---|---|---|
| Plasma Profiling (Fenland Study) | Median: 0.38 (IQR: 0.08-0.64) | 36.3% of protein-phenotype connections were platform-specific | [56] |
| CSF Alzheimer's Biomarkers | r = 0.06 (SNAP-25) to r > 0.9 (NfL, Neurogranin, VILIP-1) | Variable correlation by protein target; SOMAscan performed well for most biomarkers | [57] |
| Melanoma Immunotherapy Response | Limited correlation observed | Discrepancies attributed to differences in specificity and dynamic range | [53] |
| Precision (CV) Comparison | 6.8% median CV (SomaScan 11K) vs 35.7% (High-plex antibody assay) | SomaScan showed 6x better precision than compared high-plex antibody assay | [52] |
Experimental Protocols for Platform Evaluation
Cross-Platform Validation Protocol
For researchers seeking to compare platform performance, the following protocol adapted from multiple studies provides a robust framework:
Sample Preparation:
- Collect plasma or serum samples using standardized protocols (e.g., EDTA plasma tubes)
- Process samples within 2 hours of collection: centrifuge at 800-1600 × g for 10-15 minutes at room temperature
- Aliquot and store at -80°C until analysis
- Use the same sample aliquot for both platforms to minimize pre-analytical variation [53]
Experimental Design:
- Include inter-plate technical replicates (minimum n=100 recommended) to assess reproducibility [50]
- Incorporate shared reference samples across all plates for normalization
- Randomize case and control samples across measurement plates
- Include buffer-only wells and calibrators for background subtraction [50]
Data Analysis and Normalization:
- Apply platform-specific normalization procedures (hyb.msnCal.ps.cal.msnAll for SomaScan) [50]
- For Olink data, use inter-plate controls and normalize to NPX values [55]
- Calculate correlation coefficients (Pearson/Spearman) for overlapping targets
- Assess technical variability using Coefficient of Variation (CV) or scaled relative differences [50]
Biomarker Discovery and Validation Workflow
The triangular strategy for biomarker discovery effectively leverages the complementary strengths of both platforms:
- Discovery Phase: Utilize SomaScan's broad 11K panel for hypothesis-free proteome profiling in small sample sets (n=50-100 per group) [52]
- Verification Phase: Employ Olink Target 96-plex panels for focused verification in larger cohorts (n=500-1000) [54] [55]
- Validation Phase: Develop custom Olink Flex panels (5-30 proteins) for clinical validation and assay transfer to diagnostic settings [54] [48]
Applications in Cancer Biomarker Discovery
Case Study: Early Detection of Esophageal Squamous Cell Carcinoma
A population-based case-control study utilizing Olink PEA technology demonstrated the potential of high-plex proteomics for early cancer detection. Researchers analyzed 92 cancer-related proteins in serum from 30 precancerous patients, 60 stage I patients, 70 stage II patients, 70 stage III/IV patients, and 70 healthy controls [55].
Key Findings:
- Identified 23 differentially expressed proteins (10 upregulated, 13 downregulated) in early-stage ESCC
- Developed a five-protein classifier (ANXA1, hK8, hK14, VIM, RSPO3) discriminating early ESCC from controls with AUC of 0.936
- Established a three-level hierarchical screening strategy for ESCC control [55]
This study highlights how PEA technology enables efficient biomarker signature development from initial discovery to clinical application.
Complementary Insights from Genetic Associations
Large-scale studies integrating proteomic and genetic data have revealed important insights into platform differences. An analysis of 871 proteins measured by both SomaScan and Olink in 10,708 individuals found that approximately 36% of protein-phenotype connections were specific to one platform, indicating complementary biological insights [56]. The study identified several factors associated with platform-specific protein quantitative trait loci (pQTLs), including:
- Lower observational correlation between platforms
- Lower SOMAmer binding affinity
- Linkage to protein-altering variants
- Effects of alternative splicing and post-translational modifications [56]
Essential Research Reagent Solutions
Table 3: Essential Research Reagents and Materials
| Reagent/Material | Function | Platform Application |
|---|---|---|
| EDTA Plasma Collection Tubes | Standardized blood collection for plasma proteomics | Both platforms |
| SOMAmer Reagents | Protein capture reagents targeting 11,000 proteins | SomaScan |
| Olink Panels | Pre-configured or custom protein target panels | Olink PEA |
| Inter-Plate Controls | Normalization across experimental batches | Both platforms |
| Buffer Solutions | Background determination and calibration | Both platforms |
| DNA Polymerase | PEA DNA barcode amplification | Olink PEA |
| Microarray Chips | SOMAmer hybridization and quantification | SomaScan |
| qPCR/NGS Reagents | Detection and quantification of DNA barcodes | Olink PEA |
Both SomaScan and Olink PEA technologies offer powerful capabilities for high-plex proteomic analysis in cancer biomarker research, each with distinct advantages. SomaScan provides unprecedented proteome coverage with 11,000 protein measurements, making it ideal for discovery-phase studies where hypothesis-free exploration is valuable. Olink PEA offers excellent sensitivity and specificity through its dual antibody recognition system, with flexibility from high-plex screening to targeted validation panels.
The experimental data consistently shows that these platforms provide complementary rather than redundant information, with a substantial proportion of biological insights being platform-specific [56]. This complementarity suggests that orthogonal validation across platforms may strengthen biomarker verification. Researchers should base platform selection on specific study objectives, sample availability, and required proteomic depth, with the option to leverage both technologies across the biomarker development pipeline from initial discovery to clinical validation.
Integrated Proteogenomics represents a transformative approach in cancer research that moves beyond genomic sequencing to directly examine the functional products of genes: proteins and their post-translational modifications (PTMs). This field addresses a critical limitation of genomics and transcriptomics, as mRNA expression levels often correlate poorly with protein abundance due to complex post-transcriptional regulation [58]. By bridging DNA alterations to protein dysfunction, proteogenomics provides a more comprehensive understanding of malignant transformation and therapeutic outcomes [59]. The application of this integrated approach is particularly valuable in the context of biomarker discovery, where it enables researchers to distinguish between driver mutations with functional protein consequences and passenger mutations without pathological significance.
Within this paradigm, specialized fields like ubiquitinomics—the large-scale study of protein ubiquitination—emerge as powerful complements to conventional proteomics. While traditional proteomics characterizes protein expression and common PTMs like phosphorylation, ubiquitinomics specifically maps the ubiquitin code that regulates protein degradation, signaling, and localization. This comparison is particularly relevant in cancer research, where dysregulated ubiquitination affects key oncoproteins and tumor suppressors. This guide objectively compares how these technological approaches perform in identifying clinically actionable biomarkers, with experimental data supporting their respective strengths and applications in precision oncology.
Technological Foundations: Methodologies and Workflows
Mass Spectrometry-Based Proteomics Technologies
Proteogenomics relies on advanced mass spectrometry (MS) platforms to quantitatively characterize proteomes. The core analytical strategies involve protein extraction from clinical samples, protease digestion (typically with trypsin), peptide fractionation, and liquid chromatography coupled to tandem mass spectrometry (LC-MS/MS) analysis [18]. Quantitative approaches fall into two primary categories: label-based and label-free methods, each with distinct advantages for biomarker discovery applications [18].
Label-based quantification strategies utilize stable isotope labeling to tag proteins or peptides from different conditions, allowing precise relative quantification. Common methods include:
- SILAC (Stable Isotope Labeling with Amino acids in Cell culture): A metabolic labeling method with minimal experimental variability as isotopes are incorporated during cell culture [18]
- Isobaric tagging (TMT, iTRAQ): Enables multiplexed analysis of multiple samples simultaneously, with reporter ions generated under tandem MS conditions [18]
- ICAT (Isotope-Coded Affinity Tags): Chemical labeling targeting cysteinyl residues that reduces sample complexity through affinity-based extraction [60]
Label-free quantification approaches, including MRM (Multiple Reaction Monitoring) and SWATH (Sequential Window Acquisition of all Theoretical Mass Spectra), eliminate chemical labeling steps, making them suitable for large-scale clinical studies. These methods quantify proteins based on signal intensities or spectral counts of unique peptides, with recent advances in high-resolution mass spectrometers significantly improving their reproducibility and reliability [18].
Table 1: Comparison of Quantitative Proteomics Methods for Biomarker Discovery
| Method | Principle | Throughput | Precision | Best Use Cases |
|---|---|---|---|---|
| SILAC | Metabolic incorporation of stable isotopes | Medium | High | Cell line models, translational dynamics |
| TMT/iTRAQ | Isobaric chemical labeling of peptides | High | High | Multiplexed tissue analysis, phosphoproteomics |
| Label-free | Spectral counting or peak intensity | Very High | Medium | Large cohort studies, clinical biomarker validation |
| MRM/SRM | Targeted peptide quantification | Very High | Very High | Clinical assay development, biomarker verification |
Ubiquitinomics Workflows and Enrichment Strategies
Ubiquitinomics presents unique technical challenges due to the complexity of ubiquitin signaling and the dynamic nature of this modification. Specialized enrichment strategies are required before LC-MS/MS detection, typically utilizing antibodies or matrices with specific binding properties for ubiquitin remnants [61]. Unlike phosphorylation studies that benefit from well-established IMAC (Immobilized Metal Affinity Chromatography) and MOAC (Metal Oxide Affinity Chromatography) methods, ubiquitin enrichment often relies on diGly remnant antibodies following tryptic digestion, which recognizes the glycine-glycine signature left on ubiquitinated lysines after digestion [61].
The experimental workflow for ubiquitinomics involves:
- Protein extraction under denaturing conditions to preserve ubiquitination states
- Trypsin digestion generating diGly-modified peptides
- Immunoaffinity enrichment using diGly-specific antibodies
- LC-MS/MS analysis with specialized methods to identify and quantify ubiquitination sites
- Bioinformatic processing to map ubiquitination to specific pathways and biological processes
This specialized requirement for enrichment creates both limitations and opportunities compared to conventional proteomics, which can more readily profile global protein expression changes without targeted enrichment steps.
Comparative Performance in Biomarker Discovery
Analytical Depth and Clinical Applicability
Proteogenomics has demonstrated superior capability in identifying resistance mechanisms not fully apparent from standard genomic or transcriptomic analyses alone. In a comprehensive analysis of the CALGB 40601 clinical trial, proteogenomic profiling of HER2+ breast cancer identified two protein biomarkers, GPRC5A and TPBG, that strongly predicted resistance to anti-HER2 therapy [62]. This study revealed that ~7% of tumors clinically designated as HER2-positive lacked proteogenomic evidence of ERBB2 gene amplification at the protein level—cases uniformly associated with lack of pathological complete response [62]. This finding highlights how proteogenomics can address diagnostic limitations that contribute to treatment resistance.
Ubiquitinomics offers unique advantages in characterizing protein degradation pathways and signaling regulation that are particularly relevant in cancer. The ability to map ubiquitination sites across the proteome provides insights into the stability of oncoproteins and tumor suppressors. For example, the regulation of key cancer-relevant proteins like HIF1α, p53, and c-Myc through ubiquitin-mediated degradation represents a promising area for biomarker discovery that conventional proteomics might miss, as it would detect only steady-state levels without mechanistic insight into turnover rates.
Table 2: Comparison of Biomarker Types Detectable by Each Approach
| Biomarker Category | Proteogenomics | Ubiquitinomics | Clinical Utility |
|---|---|---|---|
| Pathway activation | Phosphoproteins, signaling nodes | Ubiquitin ligase substrates | Treatment selection, target engagement |
| Resistance mechanisms | Elevated resistance proteins, bypass pathways | Altered degradation of drug targets | Predicting therapy response |
| Early detection | Secreted proteins, tissue leakage | Dysregulated protein turnover | Cancer screening, minimal residual disease |
| Tumor classification | Protein-based subtypes | Ubiquitination signatures | Diagnosis, prognosis stratification |
Technical Considerations and Limitations
The implementation of these technologies presents distinct practical challenges. Proteogenomics requires substantial infrastructure for multi-omic data integration and computational expertise for analyzing complex datasets. A typical proteogenomic study involves sample collection, nucleic acid extraction (DNA/RNA), protein extraction, sequencing (WGS/WES/RNA-seq), LC-MS/MS proteomics, data processing, and integrated statistical analysis [61]. The requirement for both genomic and proteomic facilities can limit accessibility for some research groups.
Ubiquitinomics faces different constraints, primarily related to the dynamic range and stoichiometry of ubiquitination. Unlike phosphorylation, which can affect a substantial fraction of a target protein pool, ubiquitination is often sub-stoichiometric and rapidly leads to protein degradation, making detection challenging. Additionally, the complexity of ubiquitin chain topology (linking through different lysine residues) creates analytical challenges that require specialized MS methods beyond standard proteomic workflows.
Experimental Protocols and Data Generation
Standardized Proteogenomic Workflow for Tissue Analysis
A robust proteogenomic protocol for cancer biomarker discovery follows these key steps:
Sample Preparation and Quality Control
- Obtain frozen tissue sections (optimal) or FFPE tissues (archival resources)
- Perform laser capture microdissection for spatial resolution if needed
- Extract DNA, RNA, and proteins from adjacent sections or split samples
- Quality assessment: Bioanalyzer for nucleic acids, BCA assay for proteins
Genomic and Transcriptomic Profiling
- Whole exome sequencing (WES) or panel sequencing for somatic mutations
- RNA-seq for transcriptome quantification and fusion detection
- Single-cell RNA-seq optional for heterogeneous tissues [61]
Proteomic and Phosphoproteomic Analysis
- Protein digestion using trypsin (typically 100μg input material)
- Peptide labeling with TMT 11-plex for multiplexed analysis
- Phosphopeptide enrichment using Fe-IMAC or TiO2 chromatography
- LC-MS/MS on Orbitrap instruments with high-field asymmetric waveform ion mobility spectrometry (FAIMS) for enhanced sensitivity
Data Integration and Bioinformatics
- Somatic variant calling from DNA sequencing
- Custom database construction incorporating sample-specific variants
- Proteogenomic search with tools like MS-GF+ or MaxQuant
- Pathway analysis using Ingenuity Pathway Analysis or similar platforms
This integrated approach was successfully applied in a study of lung adenocarcinoma, where proteogenomic characterization revealed therapeutic vulnerabilities that would not have been identified through genomic analysis alone [59].
Ubiquitinomics Profiling Protocol
For ubiquitinomics analysis, the specialized protocol includes:
Sample Lysis Under Denaturing Conditions
- Use 8M urea or similar denaturant to preserve ubiquitination states
- Include deubiquitinase inhibitors (N-ethylmaleimide) in lysis buffer
- Sonicate to ensure complete protein solubilization
Digestion and DiGly Peptide Enrichment
- Reduce with dithiothreitol and alkylate with iodoacetamide
- Digest with trypsin (1:50 enzyme-to-substrate ratio) overnight
- Acidify and desalt peptides using C18 solid-phase extraction
- Immunoprecipitate with diGly remnant antibody (e.g., Cell Signaling Technology #5562)
Mass Spectrometry Analysis
- Load enriched peptides onto C18 column for LC separation
- Perform data-dependent acquisition on high-resolution MS
- Use stepped collision energy for improved fragmentation
Data Processing
- Database search against reference proteome with variable diGly modification
- Filter to 1% FDR at peptide and protein levels
- Normalize to protein abundance from global proteome analysis
Visualizing Proteogenomic Data Integration
The following diagram illustrates the core proteogenomic workflow and how it bridges genomic alterations to functional protein-level consequences in cancer biology:
Proteogenomic Workflow: Bridging DNA to Protein Dysfunction
The Scientist's Toolkit: Essential Research Reagents
Successful implementation of proteogenomic and ubiquitinomic approaches requires specialized reagents and platforms. The following table details essential research solutions for conducting these analyses:
Table 3: Essential Research Reagents for Proteogenomics and Ubiquitinomics
| Reagent Category | Specific Products/Platforms | Function | Considerations |
|---|---|---|---|
| Sample Preparation | PreOmics iST kits, S-Trap columns | Automated, reproducible protein extraction and digestion | Throughput, compatibility with low input samples |
| Protein Quantitation | TMTpro 16-plex, SILAC kits | Multiplexed quantitative comparisons | Cost, labeling efficiency, number of samples |
| PTM Enrichment | PTMScan antibodies, IMAC/TiO2 kits | Specific enrichment of modified peptides | Specificity, background binding, yield |
| Mass Spectrometry | Orbitrap Astral, timsTOF platforms | High-sensitivity peptide identification | Resolution, speed, dynamic range |
| Data Analysis | MaxQuant, FragPipe, Spectronaut | Identification and quantification from raw data | Processing speed, false discovery rate control |
| Data Integration | CPTAC pipelines, custom Python/R scripts | Multi-omic data correlation and visualization | Computational resources, bioinformatics expertise |
The comparative analysis of integrated proteogenomics and specialized ubiquitinomics reveals complementary strengths for biomarker discovery in cancer research. Proteogenomics provides a comprehensive systems biology perspective, directly connecting genetic alterations to functional protein consequences and offering clinically actionable insights, as demonstrated in the identification of GPRC5A and TPBG as resistance biomarkers in HER2+ breast cancer [62]. Ubiquitinomics delivers deep mechanistic insights into protein regulation through degradation, offering unique value for understanding drug resistance and identifying targets for PROTAC-based therapeutics.
The strategic selection between these approaches depends on the specific research questions and available resources. For tumor classification and subtyping, proteogenomics offers robust protein expression signatures that complement transcriptomic data. For understanding dynamic signaling responses to targeted therapies or identifying protein degradation vulnerabilities, ubiquitinomics provides specialized insights. As MS technologies continue to advance, with improvements in sensitivity, throughput, and single-cell applications, both approaches will become increasingly accessible and impactful for precision oncology initiatives, ultimately bridging the gap between DNA alterations and clinically actionable protein dysfunction in cancer patients.
The field of liquid biopsy is rapidly evolving beyond the analysis of circulating tumor DNA (ctDNA) and cells, expanding into the rich landscape of protein-based biomarkers. Within this context, ubiquitinomics emerges as a powerful complementary approach to traditional proteomics for biomarker discovery in cancer research. While conventional proteomics provides a snapshot of protein abundance, ubiquitinomics delves deeper into the post-translational modifications that regulate protein stability, function, and localization—offering a dynamic view of cellular processes in real-time [63].
Ubiquitination, the process by which ubiquitin molecules are attached to target proteins, is a critical regulatory mechanism involved in cell cycle progression, DNA repair, and signal transduction. Dysregulation of ubiquitination pathways is a hallmark of various cancers, making ubiquitination signatures in blood a promising reservoir of disease-specific information [64]. This guide compares the emerging application of detecting ubiquitination signatures in blood against established proteomic approaches, providing researchers with a comprehensive framework for evaluating these complementary technologies in liquid biopsy development.
Technological Foundations: Analytical Approaches Compared
Liquid Biopsy Components and Their Applications
Liquid biopsy encompasses the analysis of various tumor-derived components found in body fluids. Table 1 summarizes the key analytes and their current applications in cancer detection and monitoring.
Table 1: Liquid Biopsy Components and Clinical Applications
| Analyte | Description | Primary Applications in Cancer | Detection Challenges |
|---|---|---|---|
| Circulating Tumor DNA (ctDNA) | Tumor-derived fragmented DNA in bloodstream | Early cancer detection, treatment monitoring, minimal residual disease (MRD) assessment [65] [66] | Low abundance in early-stage disease [67] |
| Circulating Tumor Cells (CTCs) | Intact tumor cells circulating in blood | Prognostic assessment, metastasis research, treatment selection [66] | Extreme rarity (approximately 1 CTC per million blood cells) [66] |
| Proteins & Proteomic Markers | Soluble proteins and protein fragments | Risk stratification, early detection, companion diagnostics [64] | High background of non-tumor derived proteins [63] |
| Exosomes/Extracellular Vesicles | Membrane-bound vesicles carrying molecular cargo | Early cancer detection, monitoring treatment response [65] | Isolation complexity, heterogeneous content [66] |
| Ubiquitination Signatures | Post-translational modification patterns on proteins | Pathway activity monitoring, drug response assessment, mechanistic insights | Technical complexity of enrichment and detection [63] |
Established Proteomic Approaches in Liquid Biopsy
Traditional proteomic technologies have paved the way for protein biomarker discovery in liquid biopsy. The aptamer-based multiplexed proteomic technology represents one significant advancement, capable of simultaneously measuring thousands of proteins from small sample volumes (15 µL of serum or plasma) with low limits of detection (1 pM median) and 7 logs of overall dynamic range [64]. This technology utilizes chemically modified nucleotides to expand the physicochemical diversity of nucleic acid libraries, enabling large-scale comparison of proteome profiles among discrete populations.
Mass spectrometry-based approaches, particularly liquid chromatography (LC) combined with mass spectrometry (MS), provide high-throughput platforms for large-scale protein analysis, enabling comprehensive investigation of protein expression, post-translational modifications, and interactions [63]. The isobaric tags for relative and absolute quantitation (iTRAQ) method allows isotopic labeling and simultaneous quantification of protein abundance from various sources, making the iTRAQ-LC-MS/MS method widely used in quantitative proteomics.
Ubiquitination Signature Detection: Methodologies and Workflows
Experimental Protocols for Ubiquitination Signature Analysis
The detection of ubiquitination signatures in blood requires specialized methodologies that address the complexity and transient nature of this modification. The following protocols represent key approaches in the field:
Ubiquitin Remnant Immunoaffinity Enrichment Protocol: This widely adopted method utilizes antibodies specific for the diglycine remnant left on ubiquitinated peptides after tryptic digestion. The protocol begins with plasma collection from blood samples using EDTA-containing tubes, followed by rapid processing (within 2 hours) to prevent protein degradation. Proteins are then denatured, reduced, alkylated, and digested with trypsin. The resulting peptides undergo immunoaffinity purification using anti-diglycine remnant antibodies, with the enriched ubiquitinated peptides subsequently analyzed by LC-MS/MS. This approach allows for the systematic identification and quantification of ubiquitination sites across the proteome [63].
Ubiquitin Binding Domain-Based Capture Methods: As an alternative to antibody-based approaches, this method utilizes ubiquitin-associated domains (UBA) or ubiquitin-interacting motifs (UIM) immobilized on solid supports. These domains exhibit high affinity for ubiquitin chains, enabling the enrichment of ubiquitinated proteins prior to digestion. Following capture, bound proteins are eluted under denaturing conditions, digested, and analyzed by MS. This approach preserves information about polyubiquitin chain topology, which is critical for understanding the functional consequences of ubiquitination.
Tandem Ubiquitin Binding Entity (TUBE) Technology: TUBEs consist of multiple ubiquitin-associated domains in tandem, providing high affinity for polyubiquitinated proteins and protection against deubiquitinases. This method is particularly valuable for preserving labile ubiquitination signatures during sample processing. After incubation with plasma samples, TUBE-bound complexes are captured using magnetic beads, washed, and subjected to either western blot analysis or MS-based identification.
Ubiquitination Detection Workflow
Diagram 1: Workflow for detecting ubiquitination signatures in blood-based liquid biopsy samples. The process begins with blood collection and proceeds through multiple preparation stages before final data analysis.
Comparative Performance: Ubiquitinomics vs. Proteomics
Technical Comparison of Approaches
Table 2 provides a direct comparison of key performance metrics between ubiquitinomics and established proteomic approaches for liquid biopsy applications.
Table 2: Performance Comparison of Ubiquitinomics vs. Proteomics in Liquid Biopsy
| Parameter | Ubiquitinomics | Traditional Proteomics | Aptamer-based Proteomics |
|---|---|---|---|
| Sample Volume Required | 50-100 µL | 50-100 µL | 15 µL [64] |
| Detection Sensitivity | Low abundance (fmol) | Moderate (pmol) | High (fM-pM range) [64] |
| Dynamic Range | ~3 orders of magnitude | ~4 orders of magnitude | ~7 orders of magnitude [64] |
| Multiplexing Capacity | Hundreds of sites | Thousands of proteins | 813 proteins (current assay) [64] |
| Information Content | Protein regulation, pathway activity | Protein abundance | Protein abundance [64] |
| Technical Variability | 15-20% CV | 10-15% CV | 5% median CV [64] |
| Clinical Implementation | Research phase | Early clinical adoption | CKD biomarker validation [64] |
Biomarker Potential in Cancer Detection
The diagnostic performance of ubiquitination signatures shows particular promise in early cancer detection contexts. In a comparative study focusing on ovarian cancer, ubiquitination-based markers demonstrated superior specificity (92%) compared to conventional protein biomarkers like CA125 (78%) when detecting early-stage disease, though sensitivity remained moderate (68% versus 85% for CA125) [68].
For multi-cancer early detection (MCED), ubiquitination signatures have shown variable performance across cancer types. In a proof-of-concept study analyzing plasma samples from 350 patients across 12 cancer types, a 25-ubiquitination-site panel detected cancers with an overall sensitivity of 64% at 98% specificity. Performance was highest in hepatocellular carcinoma (89% sensitivity) and pancreatic cancer (78% sensitivity), while lower in early-stage prostate cancer (42% sensitivity) [69].
Pathway Analysis: Ubiquitination in Cancer Signaling
Ubiquitination regulates critical cancer-related pathways, and its detection in liquid biopsies provides unique insights into tumor dynamics. Diagram 2 illustrates key signaling pathways characterized by ubiquitination signatures detectable in blood.
Diagram 2: Cancer-relevant signaling pathways with detectable ubiquitination signatures in blood. Percentages indicate detection rates in validation studies.
The Scientist's Toolkit: Essential Research Reagents
Table 3 catalogues essential reagents and materials required for implementing ubiquitination signature analysis in liquid biopsy studies, with comparative options for traditional proteomic approaches.
Table 3: Essential Research Reagents for Ubiquitination Signature Analysis
| Reagent Category | Specific Products/Assays | Function | Proteomics Alternative |
|---|---|---|---|
| Enrichment Reagents | Anti-K-ε-GG Antibody, TUBE2, UIM Magnetic Beads | Ubiquitinated peptide/protein enrichment | Anti-protein antibodies, Albumin depletion kits |
| Protease Inhibitors | PR-619, MG-132, N-ethylmaleimide | Deubiquitinase and protease inhibition | Standard protease inhibitor cocktails |
| Sample Preparation Kits | SP3 Beads, FASP Protein Digestion Kit | Protein cleanup and digestion | S-Trap Micro Columns, EasyPep Mini MS Sample Prep Kit |
| Mass Spectrometry Standards | Hi3 Ubiquitinated Yeast Protein Standard, TMTpro 16-plex | Quantification standardization | Pierce Quantitative Peptide Standards, iRT-Kits |
| Validation Reagents | Ubiquitin Mutation Plasmids, Deubiquitinase Inhibitors | Target verification | siRNA Libraries, Recombinant Proteins |
| Analysis Software | MaxQuant, FragPipe, Ubiquity | Data processing and ubiquitination site mapping | Skyline, Spectronaut, DIA-NN |
The comparison between ubiquitinomics and proteomics for liquid biopsy applications reveals complementary strengths rather than competing value propositions. While ubiquitinomics provides unprecedented insights into the dynamic regulation of protein activity and cellular pathway status, traditional proteomics offers a more established framework for quantifying protein abundance with high sensitivity and reproducibility [64] [63].
For researchers and drug development professionals, the optimal approach likely involves integrated multi-omic strategies that combine ubiquitination signatures with other liquid biopsy analytes. As the field advances, standardization of detection methods, sample collection, and analysis protocols will be crucial for translating these biomarkers into clinical practice [65] [67]. The unique capacity of ubiquitination signatures to reveal drug-target engagement and resistance mechanisms positions this emerging technology as a valuable addition to the liquid biopsy toolkit, potentially enhancing early cancer detection, monitoring treatment response, and guiding therapeutic decisions in precision oncology.
Navigating Analytical Challenges in Cancer Ubiquitinomics and Proteomics
Tumor heterogeneity represents one of the most significant challenges in modern oncology, contributing to therapeutic resistance, disease progression, and diagnostic inaccuracy. While genomic studies have revealed the complex mutational landscape of cancers, proteins serve as the primary functional actors in cellular processes, making proteomic analysis essential for understanding tumor biology. The emerging field of spatial proteomics has revolutionized our ability to dissect this complexity by enabling the detection and quantification of proteins within intact tissue architecture at subcellular resolution, providing unprecedented insights into cellular interactions, signaling pathways, and functional states within the tumor microenvironment (TME) [70]. Simultaneously, single-cell proteomics has emerged as a powerful complement to transcriptomic approaches, revealing that the proteome remains stable while the transcriptome exhibits greater variability, highlighting the importance of direct protein measurement for understanding translational regulation in cancer [71].
In the broader context of biomarker discovery, a fundamental comparison exists between conventional proteomics, which surveys global protein expression, and ubiquitinomics, which specifically investigates the ubiquitin-proteasome system (UPS)—a crucial regulatory network governing oncogenic processes through dynamic post-translational modifications that control protein stability, functional modulation, and subcellular localization [5]. This article provides a comprehensive comparison of current single-cell and spatial proteomics technologies, their experimental frameworks, and their respective capabilities in addressing tumor heterogeneity, with particular emphasis on their applications in ubiquitin-related cancer research.
Technological Platforms: A Comparative Landscape
Spatial Proteomics Modalities
Spatial proteomics technologies preserve architectural context while enabling multiplexed protein detection, with platforms primarily differing in their detection methods and multiplexing capabilities [70]. The table below summarizes the primary spatial proteomics modalities and their key characteristics:
Table 1: Comparison of Spatial Proteomics Technologies
| Technology | Principle | Multiplexing Capacity | Resolution | Key Advantages | Key Limitations |
|---|---|---|---|---|---|
| Multiplexed Immunofluorescence (MxIF) | Fluorescence-based detection with antibody staining | 4-6 markers simultaneously | Cellular/Subcellular | Simultaneous detection, well-established | Spectral overlap limits multiplexing |
| Cyclic Immunofluorescence (CyCIF/IBEX) | Sequential staining and fluorophore removal/bleaching | 40-60 markers | Cellular/Subcellular | High multiplexing, whole-slide imaging | Time-consuming, antibody validation required |
| CODEX | Antibodies conjugated with oligonucleotide tags imaged over multiple cycles | Up to 100 markers | Cellular | Extreme multiplexing capability | No signal amplification, difficult for low-expression markers |
| Imaging Mass Cytometry (IMC) | Metal-tagged antibodies with laser ablation and time-of-flight detection | 40+ proteins simultaneously | 1μm | No spectral overlap, high multiplexing | Tissue destruction, slow image acquisition |
| Digital Spatial Profiler (DSP) | UV-cleavable barcoded oligonucleotides on antibodies | 40-100 proteins | Region of interest or single-cell | Combines proteomics and transcriptomics | Requires predefined regions of interest |
Single-Cell Proteomics Platforms
Single-cell proteomics (SCP) technologies have advanced significantly to address cellular heterogeneity that bulk proteomics approaches inevitably obscure. These platforms enable the identification and quantification of thousands of proteins from individual cells, providing critical insights into rare cell populations, signaling dynamics, and post-translational modifications that cannot be inferred from genomic and transcriptomic measurements alone [71]. The SCPro platform exemplifies recent advancements, combining multiplexed imaging and flow cytometry with ion exchange-based protein aggregation capture technology to characterize spatial proteome heterogeneity with single-cell resolution [72]. This multimodal approach integrates image-guided spatial proteomics and flow cytometry-based cell-type proteomics to uncover cell-type heterogeneity in tissue context, demonstrating particular utility in mapping the pancreatic tumor microenvironment.
Table 2: Performance Comparison of Single-Cell and Spatial Proteomics Methods
| Method/Platform | Sensitivity (Protein Groups) | Sample Input | Quantitative Reproducibility (CV) | Key Applications in Cancer Research |
|---|---|---|---|---|
| SCPro | >5,000 protein groups | 100-1,000 cells | <15% median CV | Pancreatic TME mapping, immune cell subtypes, Treg discovery |
| iPAC Technology | >3,000 protein groups (from 10 cells) | 10-100 cells | ~15% (10-cell group) | Rare cell analysis, FFPE tissue processing, stained tissue slices |
| LMD-based Spatial Proteomics | 800-3,200 protein groups | 2.4-60 cells | 8.2-15% | Ovarian cancer, colon cancer, tuberculosis, pancreatic cancer, COVID-19 |
| Conventional Bulk Proteomics | >5,000 protein groups | Thousands to millions of cells | 5-10% | Biomarker discovery, signaling pathway analysis, drug response |
Experimental Frameworks: From Sample to Insight
Integrated Workflows for Spatial and Single-Cell Resolution
The SCPro platform exemplifies an integrated approach to addressing tumor heterogeneity, combining complementary methodologies for comprehensive tissue characterization:
Spatial Proteomics Workflow:
- Multiplexed Imaging: Centimeter-scale formalin-fixed, paraffin-embedded (FFPE) tissue sections are stained with multi-color immunohistochemical markers for cell typing [72].
- Automated Cell Dissection: Single-cell contours are automatically defined based on nuclei and cell membrane identification algorithms without manual annotation [72].
- Laser Microdissection (LMD): Precise single-cell collection is performed using automated LMD systems [72].
- Sample Preparation: The ion exchange-based protein aggregation capture (iPAC) technology processes rare stained tissue cells (<100 cells to single cells) [72].
- MS Analysis: High-sensitive proteomics profiling is conducted using nanoflow liquid chromatography coupled to mass spectrometry [72].
Cell-Type Proteomics Workflow:
- Cell Sorting: Flow cytometry is employed to sort distinct cell populations from the same tumor (up to 14 different cell types, 100-1000 cells per type) [72].
- Proteome Characterization: Deep proteomic profiling of each cell type generates a reference map [72].
- Computational Deconvolution: Spatial distribution of immune cell subtypes is deconvoluted using reference proteomes, enabling discovery of specialized cell states like regulatory T cell subtypes [72].
The iPAC Technology for Limited Sample Input
A critical technical hurdle in spatial proteomics has been the manipulation and processing of rare cells from tissue sections. The iPAC (ion exchange-based protein aggregation capture) technology addresses this challenge through several innovative features [72]:
- Carrier Surfactant: Introduction of N-dodecyl-β-D-maltoside (DDM) prevents nonspecific adsorption of low nanogram-level proteins during sample processing.
- Solid-Phase Extraction: SAX and C18 disks in tandem replace loosely packed beads, significantly improving protein-capturing efficiency.
- In Situ Protein Aggregation: Incubation with pure acetonitrile after protein capture induces precipitation of proteins, facilitating extended wash to remove contaminants.
- Enhanced Chromatography: Integration of homemade 50μm I.D. zero-dead-volume (ZDV) columns with negligible dead volume significantly improves ionization efficiency and sensitivity.
This technology has demonstrated robust performance, identifying over 3,000 protein groups from just 10 sorted cells with median coefficient of variation below 15%, and has been successfully applied to H&E-stained mouse brain tissue slices, identifying over 3,200 protein groups from samples corresponding to approximately 60 cells in volume [72].
Figure 1: Integrated Workflow of the SCPro Platform Combining Spatial and Cell-Type Resolved Proteomics
Ubiquitinomics vs. Proteomics: Complementary Approaches for Biomarker Discovery
In the context of cancer biomarker discovery, a fundamental distinction exists between conventional proteomics and ubiquitinomics, each offering unique insights into tumor biology:
Conventional Proteomics focuses on global protein expression profiling, identifying quantitative changes in protein abundance across different cancer states. This approach has successfully identified biomarker panels for multiclass cancer discrimination. For example, one study identified 12 proteins with differential abundance across colon, kidney, liver, and brain tumors, including vimentin (VIM), glial fibrillary acidic protein (GFAP), and pyruvate kinase type M2 (PKM2) [7]. These tissue-derived proteomes represent a rich source of potential cancer markers that may enter circulation and serve as serological diagnostic tools.
Ubiquitinomics specifically investigates the ubiquitin-proteasome system (UPS), focusing on post-translational modifications that regulate protein stability and degradation. This approach provides unique insights into cancer pathogenesis by examining:
- E3 Ubiquitin Ligases: Enzymes that confer substrate specificity for ubiquitination
- Deubiquitinating Enzymes (DUBs): Proteins that remove ubiquitin modifications
- Ubiquitination Dynamics: The balance between protein ubiquitination and deubiquitination
In non-small cell lung cancer (NSCLC), UPS dysregulation impacts key oncogenic drivers including EGFR, KRAS, and p53. For instance, the WDR4-Cul4 complex promotes tumorigenesis by inhibiting PTPN23-mediated EGFR degradation, while USP22 and USP37 serve as regulators of EGFR ubiquitination, offering dual therapeutic targets to overcome EGFR-TKI resistance [5]. The delicate equilibrium between ubiquitination and deubiquitination thus constitutes a fundamental yet underexplored axis in cancer biology with significant implications for targeted therapy.
Figure 2: The Ubiquitin-Proteasome System in Cancer Pathogenesis and Therapy
The Scientist's Toolkit: Essential Research Reagents and Platforms
Table 3: Key Research Reagent Solutions for Single-Cell and Spatial Proteomics
| Reagent/Platform | Function | Application Examples | Technical Considerations |
|---|---|---|---|
| iPAC Spintip | Integrated sample preparation with SAX and C18 disks | Processing rare stained tissue cells (<100 cells) | Prevents sample loss, enables extended wash steps |
| Metal-tagged Antibodies | Multiplexed protein detection via mass spectrometry | Imaging Mass Cytometry (IMC), Multiplexed Ion Beam Imaging (MiBI) | No signal amplification, requires specialized instrumentation |
| DNA-barcoded Antibodies (CODEX) | Oligonucleotide-conjugated antibodies for cyclic imaging | Ultra-high-plex imaging (up to 100 markers) | Requires antibody validation after conjugation |
| Photocleavable Barcoded Oligos | Spatially-resolved protein indexing | Digital Spatial Profiler (DSP) GeoMX | Enables combined proteomic and transcriptomic analysis |
| Zero-Dead-Volume (ZDV) Columns | Nanoflow LC separation with minimal dead volume | High-sensitivity LC-MS for limited input samples | Improves ionization efficiency, requires custom fabrication |
| TN5 Transposase | Chromatin accessibility mapping | scATAC-seq for epigenetic profiling | Integrates well with multi-omics approaches |
| Unique Molecular Identifiers (UMIs) | Barcoding for single-cell resolution | Single-cell RNA and protein sequencing | Reduces technical noise in single-cell data |
The rapid evolution of single-cell and spatial proteomics technologies has fundamentally enhanced our ability to dissect tumor heterogeneity at unprecedented resolution. The integration of these approaches with ubiquitinomics provides a powerful framework for understanding not only protein expression patterns but also the dynamic post-translational modifications that govern protein function and stability in cancer. As these technologies continue to mature, standardization of workflows, reduction of operational costs, and development of accessible analytical tools will be crucial for widespread clinical adoption. The future of cancer research lies in multi-omic integration, where spatial context, single-cell resolution, and dynamic protein regulation converge to provide comprehensive insights into tumor biology, ultimately enabling truly personalized therapeutic interventions based on the unique molecular architecture of each patient's cancer.
The detection of low-abundance biomarkers in complex biological fluids is a fundamental challenge in cancer proteomics and ubiquitinomics. The extensive dynamic range of protein concentrations, often spanning over 10 orders of magnitude in blood plasma, obscures crucial low-abundance signals. This guide objectively compares the performance of major depletion strategies—immunoaffinity removal, low-abundance protein enrichment, and precipitation methods—evaluating their efficacy in revealing the deep proteome for biomarker discovery. Data presented herein provide a framework for selecting appropriate methodologies to enhance sensitivity in both conventional proteomic and specialized ubiquitinomic analyses.
In the quest for cancer biomarkers, proteomics aims to characterize the entire protein complement of a cell, tissue, or organism [18]. However, a central analytical problem persists: the dynamic range of protein concentrations in biofluids like plasma and serum is immense. The top ten most abundant proteins constitute approximately 90% of the total protein content, while potential disease biomarkers, such as tissue-leaked proteins or cellular signaling molecules, exist at concentrations that are several orders of magnitude lower [73] [74]. This discrepancy severely limits the detection capacity of even the most advanced mass spectrometry (MS) platforms. The emerging field of ubiquitinomics, which seeks to characterize the entire complement of ubiquitinated proteins, faces an analogous challenge. Ubiquitinated proteins are typically low in abundance but are critical regulators of cancer-related processes like protein degradation and cell signaling. Effective depletion of high-abundance proteins (HAPs) is therefore a prerequisite for sensitive analysis in both conventional proteomics and ubiquitinomics.
Comparison of Core Depletion and Enrichment Strategies
Several strategies have been developed to overcome the dynamic range limitation. The two principal approaches are the depletion of HAPs and the enrichment of low-abundance proteins (LAPs). The following section compares the performance, advantages, and limitations of these core strategies based on published experimental data.
Immunoaffinity Depletion of High-Abundance Proteins
Immunoaffinity depletion uses antibodies immobilized on a solid support to selectively remove specific, abundant proteins from a sample.
- Performance and Identifications: A direct comparison between a 20-protein immunoaffinity depletion kit (ProteoPrep20) and a LAP enrichment technology (ProteoMiner) found that depletion allowed the identification of about 25% more proteins from human plasma [73] [74]. This suggests that for maximizing the sheer number of protein identifications, deep immunoaffinity depletion can be superior.
- Co-depletion and Specificity: A significant drawback of immunoaffinity methods is the co-depletion of non-target proteins that interact with HAPs or the antibody resin. Studies note that this co-depletion can inadvertently remove biologically relevant, lower-abundance proteins, thereby limiting the potential for biomarker discovery [75] [73].
- Sample Source Considerations: The efficacy of immunoaffinity depletion can vary by sample type. A study on chronic kidney disease (CKD) patient urine found that while depletion efficiently removed albumin and other targets, it did not yield a higher number of protein identifications compared to the analysis of unfractionated starting urine. This indicates that the added value of depletion may be context-dependent [75].
Enrichment of Low-Abundance Proteins
As an alternative to depletion, enrichment methods use combinatorial peptide ligand libraries (CPLL), such as in the ProteoMiner technology, to compress the dynamic range. Each unique hexapeptide ligand binds to a different protein, saturating the HAPs and concentrating the LAPs [73] [74].
- Practical Advantages: While the aforementioned study identified fewer total proteins than deep immunoaffinity depletion, the LAP enrichment approach recovered 150 times more protein mass due to its larger column capacity. This provides a much larger amount of material for subsequent multi-step fractionation and analysis [76]. The method also requires less sample handling, resulting in negligible keratin contamination, whereas depletion methods showed nearly 10% keratin peptides [76].
- Complementary Nature: The datasets from HAP depletion and LAP enrichment are only partially overlapping, indicating that the two strategies are complementary and can be combined in multi-fractionation protocols for a more comprehensive plasma proteome analysis [74].
Precipitation and Other Cost-Effective Methods
Precipitation-based methods offer a cost-effective alternative for HAP removal.
- Cost and Efficacy: A 2025 cross-species study evaluated a perchloric acid (PerCA) precipitation method against several commercial kits. The PerCA method was found to be over 20 times cheaper than commercial kits and demonstrated strong performance, particularly in depleting HAPs from mouse serum [77].
- Albumin Depletion: Another study focusing on albumin and IgG removal found that a 70% cold acetone precipitation achieved 98% depletion of albumin from human plasma [78]. However, the recovery of reference low-abundance proteins like ubiquitin was poor (12%), highlighting a potential trade-off between depletion efficiency and LAP recovery [78].
Table 1: Quantitative Comparison of Depletion and Enrichment Method Performance
| Method (Example Product) | Core Mechanism | Proteins Identified | Key Performance Metric | Major Limitation |
|---|---|---|---|---|
| Multi-Immunodepletion (ProteoPrep20) | Antibody-based removal of 20 HAPs | ~25% more than ProteoMiner [73] [74] | High specificity for target HAPs | Co-depletion of bound LAPs; high cost |
| LAP Enrichment (ProteoMiner) | Crystallization of dynamic range using hexapeptide libraries | Fewer than ProteoPrep20 [73] [74] | 150x higher protein recovery; less keratin contamination [76] | Does not increase total identifications in all contexts (e.g., urine) [75] |
| Acid Precipitation (PerCA) | Solubility-based precipitation of HAPs | Varies by sample; competitive with lower-cost kits [77] | >20x cost savings per sample [77] | Potential poor recovery of specific LAPs (e.g., ubiquitin) [78] |
| Albumin/IgG Depletion (ProteoExtract) | Antibody-based removal of two main HAPs | 28 proteins in one study [78] | Best recovery (61-106%) of spiked reference proteins [78] | Limited scope of HAP removal |
Experimental Protocols for Key Methods
To ensure reproducibility, detailed protocols for two pivotal methods are provided below.
Protocol: Immunoaffinity Depletion with ProteoPrep20
This protocol is adapted from Millioni et al. (2011) for depleting 20 HAPs from human plasma or serum [74].
- Sample Preparation: Dilute 8 µL of plasma sample to 100 µL with PBS buffer. Filter the diluted sample through a 0.2 µm centrifugal filter to remove particulates.
- Column Equilibration: Pre-equilibrate the immunoaffinity spin column with PBS buffer.
- Incubation and Depletion: Apply the 100 µL filtered sample to the column. Incubate at room temperature for 20 minutes to allow HAPs to bind to the immobilized antibodies.
- Collection: Centrifuge the column at 1,500 RCF for 1 minute. Collect the flow-through, which contains the depleted plasma.
- Wash: Perform two additional washes of the column with 100 µL of PBS each, collecting the flow-through in the same tube to maximize yield of unbound proteins.
- Concentration: Concentrate the pooled flow-through using an appropriate centrifugal filter (e.g., Ultrafree-MC) to a desired volume (e.g., 125 µL).
Protocol: Low-Abundance Protein Enrichment with ProteoMiner
This protocol is based on the work of Millioni et al. (2011) and utilizes combinatorial peptide ligand libraries [74].
- Bead Preparation: Place the ProteoMiner beads in a spin column or suitable container. Remove the storage solution by centrifugation at 1,000 RCF for 2 minutes.
- Sample Loading: Incubate the prepared complex protein sample (e.g., plasma or serum) with the beads under gentle agitation for a specified duration to allow protein binding.
- Washing: Wash the beads extensively with an appropriate buffer to remove high-abundance proteins that have saturated their ligands and other non-specifically bound material.
- Elution: Elute the bound low-abundance proteins from the beads using a suitable elution buffer. The eluate is now enriched for LAPs and can be concentrated for downstream analysis.
Implications for Ubiquitinomics in Cancer Research
The choice of depletion strategy has profound implications for the sensitivity and success of ubiquitinomic studies in cancer.
- Revealing the Ubiquitinome: Ubiquitinated proteins are often present in low stoichiometry. Effective depletion of HAPs is critical to unmask these regulatory proteins, which can include tumor suppressors and oncoproteins. The complementary nature of depletion and enrichment methods suggests that a combined or sequential approach may be most powerful for deep ubiquitinome coverage [74].
- Integration with Multi-Omics: Oncoproteomics is increasingly integrated with genomics and transcriptomics in a multi-omics framework to achieve a comprehensive view of cancer biology [18]. The data generated after effective sample fractionation can be used to build detailed cancer proteome databases, identify aggressive cancers early, and understand tumor heterogeneity [79] [18]. Reliable depletion is the foundational step that makes such large-scale, integrated analyses possible.
- Pathway Analysis: Different depletion methods can selectively impact the observed biological pathways. The 2025 cross-species study noted that distinct biological processes were highlighted depending on the depletion method used, indicating that the methodological choice can influence the biological interpretation of the data [77].
The following workflow diagram illustrates the role of depletion strategies within a comprehensive ubiquitinomics/proteomics pipeline for cancer biomarker discovery.
The Scientist's Toolkit: Essential Research Reagents
This table details key reagents and their functions in depletion protocols, as featured in the cited experiments.
Table 2: Key Research Reagents for Depletion Studies
| Reagent / Kit Name | Primary Function | Specific Role in Workflow |
|---|---|---|
| ProteoPrep20 (Sigma-Aldrich) | Multi-Immunodepletion | Spin column for simultaneous removal of 20 high-abundance plasma proteins [73] [74]. |
| ProteoMiner (BioRad) | Low-Abundance Enrichment | Combinatorial hexapeptide library beads for dynamic range compression [73] [74]. |
| ProteoExtract Albumin/IgG Removal Kit (Calbiochem) | Dual Immunodepletion | Affinity column for specific removal of albumin and IgG [78]. |
| Perchloric Acid (PerCA) | Acid Precipitation | Reagent for cost-effective, solubility-based precipitation of high-abundance proteins [77]. |
| Multiple Affinity Removal System (MARS) | Multi-Immunodepletion | HPLC column for removal of 7, 14, or other numbers of high-abundance proteins [77]. |
| Cold Acetone | Solvent Precipitation | Organic solvent used for efficient precipitation of albumin from plasma samples [78]. |
In the evolving landscape of cancer biomarker discovery, post-translational modification (PTM) stoichiometry analysis has emerged as a pivotal methodology for differentiating the functional significance of protein modifications. While conventional proteomics provides a quantitative snapshot of protein abundance, it often fails to reveal the intricate regulatory mechanisms governed by PTMs. Ubiquitinomics, the specialized study of protein ubiquitination, particularly benefits from stoichiometric analysis because the same ubiquitin modification can signal either proteasomal degradation or non-proteolytic functions depending on its stoichiometry and chain topology [3] [4]. The stoichiometry of a PTM refers to the fraction of modified protein molecules at a specific site, providing crucial context that absolute quantification alone cannot deliver [80]. This distinction is especially critical in cancer research, where understanding the functional role of specific ubiquitination events can reveal novel therapeutic targets and biomarker signatures not apparent through conventional proteomic profiling alone [35] [18].
The integration of stoichiometric measurements enables researchers to move beyond mere cataloging of modification sites toward genuine functional characterization. For drug development professionals, this distinction is paramount—inhibiting degradation-specific ubiquitination would produce dramatically different therapeutic outcomes than disrupting ubiquitination involved in cellular signaling or trafficking. This comparative guide examines the experimental approaches, applications, and technical considerations for PTM stoichiometry analysis, with particular emphasis on differentiating functional ubiquitin signaling in cancer research.
Methodological Approaches in Stoichiometry Analysis
Quantitative Strategies for Stoichiometry Determination
Multiple mass spectrometry-based strategies have been developed to quantify PTM stoichiometry, each with distinct advantages and limitations for specific research contexts. The choice of methodology significantly influences the scale, accuracy, and biological interpretation of stoichiometry measurements.
Table 1: Comparison of Major MS-Based Approaches for PTM Stoichiometry Analysis
| Method | Quantification Type | Stoichiometry Output | Throughput | Best Applications | Key Limitations |
|---|---|---|---|---|---|
| AQUA | Absolute | Direct stoichiometry calculation | Low to medium | Targeted validation; Clinical biomarker verification | Limited peptide selection; High cost for large scales [81] |
| Label-Free Quantification | Relative | Relative occupancy changes | High | Discovery studies; Multiple condition comparisons | Requires precise normalization; Higher variability [80] |
| SILAC | Relative | Relative occupancy changes | Medium | Controlled cell systems; Mechanism studies | Not suitable for primary tissues or body fluids [4] |
| TMT/iTRAQ | Relative | Relative occupancy changes | High | Multiple conditions; Time-course experiments | Ratio compression; Complex data analysis [82] |
The AQUA (Absolute Quantification) method utilizes synthetic, stable isotope-labeled internal standard peptides (ILISPs) spiked into biological samples in known quantities [81]. These standards chemically mirror native peptides generated by proteolytic digestion, enabling precise absolute quantification by comparing MS signal intensities between endogenous and reference peptides. For stoichiometry calculations, both modified and unmodified forms of the same peptide sequence must be quantified, allowing computation of the modified fraction [80]. While this approach provides rigorous stoichiometric measurements, its requirement for synthetic standards for each peptide of interest makes it poorly suited for discovery-scale studies.
Metabolic labeling approaches such as SILAC (Stable Isotope Labeling with Amino Acids in Cell Culture) enable robust relative quantification by incorporating heavy isotopes during cell proliferation [4]. When applied to stoichiometry analysis, SILAC facilitates comparison of occupancy changes under different conditions, such as proteasome inhibition, which can help differentiate degradation versus non-degradation ubiquitin signaling. However, this method is restricted to cell culture models and cannot be applied to primary tissues or clinical samples.
Isobaric labeling methods (TMT, iTRAQ) have gained popularity for high-throughput stoichiometry studies due to their multiplexing capabilities, allowing simultaneous analysis of up to 11 conditions in a single MS run [82]. The recently developed UbiFast method combines TMT labeling with on-bead tagging after ubiquitin remnant enrichment, significantly enhancing throughput and sensitivity while reducing sample requirements to sub-milligram levels [82]. This approach is particularly valuable for time-course experiments monitoring dynamic changes in ubiquitin occupancy across multiple conditions.
Enrichment Strategies for Ubiquitinomics
A critical challenge in ubiquitinomics is the typically low stoichiometry of endogenous ubiquitination, necessitating effective enrichment strategies prior to MS analysis. The development of anti-K-ε-GG antibodies that specifically recognize the diglycine remnant left on trypsinized ubiquitination sites revolutionized the field, enabling identification of over 10,000 ubiquitination sites in single experiments [3] [82]. This enrichment approach, combined with high-resolution mass spectrometry, has become the cornerstone of modern ubiquitin site profiling.
Recent advancements have addressed limitations of the traditional K-ε-GG antibody approach, including sequence context bias and inability to detect non-lysine ubiquitination. The UbiSite method utilizes an antibody recognizing a 13-mer LysC digestion fragment of ubiquitin, substantially expanding ubiquitinome coverage to approximately 64,000 sites under proteasome inhibition conditions [82]. For researchers requiring exceptional depth of coverage, Data-Independent Acquisition (DIA) mass spectrometry combined with K-ε-GG enrichment has demonstrated remarkable performance, identifying up to 110,000 ubiquitination sites in recent studies [82].
Experimental Protocols for Functional Ubiquitin Signaling Analysis
Protocol 1: Differentiation of Degradation vs. Non-Degradation Ubiquitination
Principle: This SILAC-based approach distinguishes degradative from non-degradative ubiquitin signaling by monitoring changes in ubiquitin occupancy and protein abundance in response to 26S proteasome inhibition [4]. Degradation-specific ubiquitination sites show increased occupancy upon proteasome inhibition without corresponding increases in total protein abundance, while non-degradative sites display coordinated changes in both parameters.
Step-by-Step Workflow:
Cell Culture & Metabolic Labeling:
- Culture two populations of SKOV3 ovarian carcinoma cells (or other relevant cell line)
- Maintain "light" population in standard RPMI 1640 media
- Culture "heavy" population in SILAC RPMI media containing 13C615N4-l-arginine and 13C6-l-lysine
- Validate isotope incorporation >98% by LC-MS/MS analysis [4]
Proteasome Inhibition Treatment:
- Treat "light" cells with 20 μM MG132 proteasome inhibitor for 6 hours
- Use DMSO-treated "light" cells as negative control
- Confirm proteasome inhibition by immunoblotting with ubiquitin antibody [4]
Sample Preparation & Digestion:
- Lyse light and heavy cells simultaneously in 8M urea buffer
- Mix light and heavy lysates in 1:1 protein ratio
- Reduce with 10 mM TCEP (1 hour, 37°C)
- Alkylate with 12 mM iodoacetamide (30 minutes, room temperature)
- Dilute sixfold with 50 mM Tris-HCl (pH 8.0)
- Digest with trypsin (1:50 enzyme:substrate) overnight at 25°C [4]
Ubiquitinated Peptide Enrichment:
- Divide digested peptides into multiple aliquots
- Enrich ubiquitinated peptides using PTMScan Ubiquitin Remnant Motif Kit
- Incubate with anti-K-ε-GG antibody beads (2 hours, 4°C)
- Pool enriched peptides from all aliquots [4]
LC-MS/MS Analysis & Data Processing:
- Fractionate enriched peptides by basic reversed-phase liquid chromatography
- Analyze by LC-MS/MS using high-resolution mass spectrometer
- Identify ubiquitination sites and quantify SILAC ratios
- Calculate relative ubiquitin occupancy changes [4]
Figure 1: Experimental workflow for differentiating degradation versus non-degradation ubiquitination using SILAC-based quantitative ubiquitinomics.
Protocol 2: Large-Scale Ubiquitinome Profiling with TMT Multiplexing
Principle: The UbiFast method combines tandem mass tagging (TMT) with on-bead labeling to enable multiplexed analysis of ubiquitination sites across multiple conditions, significantly enhancing throughput while reducing sample requirements [82].
Step-by-Step Workflow:
Sample Preparation:
- Prepare protein extracts from up to 11 different conditions (cell lines, tissues, or treatments)
- Digest proteins to peptides using standard proteomic protocols
Ubiquitin Remnant Enrichment:
- Incubate peptide mixtures with anti-K-ε-GG antibody beads
- Wash extensively to remove non-specifically bound peptides
On-Bead TMT Labeling:
- While peptides are bound to antibody beads, add TMT reagents
- Label peptide N-termini directly on beads
- Wash away excess TMT reagents to minimize contamination
Peptide Elution and Analysis:
- Elute labeled ubiquitinated peptides from beads
- Pool samples from different conditions
- Analyze by LC-MS/MS using high-resolution instrument
- Quantify ubiquitination changes across conditions [82]
Applications in Cancer Research: Ubiquitinomics vs. Proteomics
The integration of stoichiometric analysis into cancer ubiquitinomics has revealed molecular mechanisms and potential biomarkers that conventional proteomic approaches routinely miss. Where traditional proteomics might identify proteins with altered abundance in cancer tissues, ubiquitinomics with stoichiometry measurements can pinpoint the specific regulatory sites and functional consequences of those changes.
Table 2: Cancer Research Applications of Ubiquitinomics with Stoichiometry Analysis
| Cancer Type | Ubiquitinomics Finding | Stoichiometry Insight | Clinical/Functional Significance | Proteomic Comparison |
|---|---|---|---|---|
| Lung Squamous Cell Carcinoma | 627 ubiquitin-modified proteins identified with 1209 sites [35] | mTOR, HIF-1, PI3K-Akt pathway regulation | 33 UPs correlated with overall survival | Conventional proteomics would miss site-specific regulatory mechanisms |
| Ovarian Cancer | 9 novel HER2 ubiquitination sites discovered [4] | Functional differentiation: degradation vs. signaling | Predictive value for targeted therapies | HER2 abundance alone insufficient to predict ubiquitination status |
| Pancreatic Cancer | LKB1 loss impacts ubiquitination | Metabolic reprogramming via mTOR pathway [18] | Identifies combinatorial targeting strategies | Proteomics detects abundance changes but not PTM-specific effects |
| Hepatocellular Carcinoma | PYCR2 and ADH1A ubiquitination [18] | Metabolic reprogramming in HBV-related HCC | Reveals metabolic vulnerabilities | Phosphoproteomics identified ALDOA phosphorylation but missed ubiquitination |
In lung squamous cell carcinoma (LSCC), quantitative ubiquitinomics analysis of clinical tissue samples identified 627 ubiquitin-modified proteins with 1,209 specific ubiquitination sites [35]. Importantly, this study revealed that 33 ubiquitinated proteins significantly correlated with patient overall survival, providing potential prognostic biomarkers that would not be evident from protein abundance measurements alone. Pathway analysis further demonstrated enrichment in mTOR, HIF-1, and PI3K-Akt signaling pathways, suggesting specific regulatory nodes for therapeutic intervention [35].
In ovarian cancer research, the application of stoichiometry analysis to the oncoprotein HER2 revealed nine previously unreported ubiquitination sites with distinct functional implications [4]. By measuring ubiquitin occupancy changes in response to proteasome inhibition, researchers could classify specific sites as participating in degradation versus non-degradative signaling, information crucial for designing targeted therapies that might selectively modulate specific HER2 functions without completely eliminating the protein.
Figure 2: Logical workflow for extracting biological insights from ubiquitinomics data with stoichiometry analysis in cancer research.
The distinction between conventional proteomics and ubiquitinomics becomes particularly evident in studies of cancer metabolism. While proteomic analysis of pancreatic cancer models identified proteins with altered abundance following LKB1 loss, ubiquitinomics with stoichiometry measurements could reveal how specific ubiquitination events coordinate metabolic reprogramming through mTOR-dependent pathways [18]. This additional layer of functional information enables more precise targeting of metabolic vulnerabilities in cancer cells.
The Scientist's Toolkit: Essential Reagents and Technologies
Successful implementation of PTM stoichiometry analysis requires specialized reagents and technologies optimized for ubiquitinomics applications. This toolkit highlights essential components for researchers designing ubiquitin stoichiometry studies.
Table 3: Essential Research Reagents and Technologies for Ubiquitin Stoichiometry Analysis
| Reagent/Technology | Function | Key Features | Representative Examples |
|---|---|---|---|
| K-ε-GG Antibody | Enrichment of ubiquitinated peptides | Recognizes diglycine remnant after trypsinization; enables site identification | PTMScan Ubiquitin Remnant Motif Kit (Cell Signaling) [4] |
| UbiSite Antibody | Alternative enrichment method | Recognizes 13-mer LysC fragment; reduces sequence bias | Anti-UbiSite antibody [82] |
| Tandem Mass Tags | Multiplexed quantification | Enables comparison of up to 11 conditions; reduces MS run time | TMT (Tandem Mass Tag), iTRAQ reagents [82] |
| SILAC Media | Metabolic labeling | Incorporates stable isotopes during cell growth; minimal technical variability | SILAC RPMI with 13C6-15N4-l-arginine/13C6-l-lysine [4] |
| AQUA Peptides | Absolute quantification | Synthetic isotope-labeled standards; precise quantification | Custom synthetic peptides with 13C/15N labels [81] |
| Proteasome Inhibitors | Functional perturbation | Blocks protein degradation; reveals degradation-specific ubiquitination | MG132, Bortezomib, Carfilzomib [4] |
| DIA Mass Spectrometry | High-sensitivity analysis | Reduces stochastic sampling; improves quantification of low-abundance sites | Q Exactive, Orbitrap Fusion series [82] |
The anti-K-ε-GG antibody remains the most widely used enrichment tool, with proven performance across numerous studies [3] [82] [4]. However, researchers should be aware of its limitations, including sequence context bias and inability to detect non-lysine ubiquitination. The emerging UbiSite antibody provides an attractive alternative with demonstrated coverage of approximately 30,000 ubiquitination sites per replicate [82].
For quantification, the choice between SILAC, TMT, and label-free approaches depends on experimental design and sample availability. SILAC provides excellent quantification accuracy but cannot be applied to clinical specimens, while TMT multiplexing enables larger experimental designs with limited sample amounts. Label-free approaches offer maximum flexibility for sample types but may exhibit higher variability requiring more replicates [18].
Recent advances in Data-Independent Acquisition (DIA) mass spectrometry have dramatically improved the sensitivity and reproducibility of ubiquitinome analysis, with recent studies reporting identification of over 100,000 ubiquitination sites using DIA methods [82]. This technology is particularly valuable for detecting low-stoichiometry ubiquitination events that might be missed by traditional data-dependent acquisition.
PTM stoichiometry analysis represents a critical advancement beyond conventional proteomic profiling, particularly in the context of ubiquitinomics for cancer research. By quantifying the fraction of modified protein molecules at specific sites, researchers can differentiate between functionally distinct ubiquitination events—most notably degradation versus non-degradation signaling—that would be indistinguishable through protein abundance measurements alone. The experimental approaches detailed in this guide, from SILAC-based functional classification to multiplexed TMT profiling, provide researchers with powerful tools to decipher the complex ubiquitin code in cancer biology.
As mass spectrometry technologies continue to evolve, particularly with improvements in DIA methods and enrichment strategies, the scope and precision of stoichiometry analysis will further expand. For drug development professionals and translational researchers, integrating these approaches into biomarker discovery pipelines offers the promise of more functional, mechanistically informed targets that reflect the complex regulatory landscape of cancer cells. The future of ubiquitinomics lies not merely in cataloging modification sites, but in quantitatively understanding their occupancy dynamics and functional consequences across the spectrum of cancer types and therapeutic interventions.
In the pursuit of reliable cancer biomarkers, the fields of proteomics and the emerging discipline of ubiquitinomics face significant standardization hurdles that impact reproducibility. Proteomics involves the large-scale study of proteins, their expression levels, modifications, and interactions, typically using mass spectrometry (MS)-based technologies [18]. Ubiquitinomics focuses specifically on the system-wide analysis of protein ubiquitination, a post-translational modification crucial for regulating protein degradation, cell signaling, and cancer pathways. Both approaches offer promise for biomarker discovery but encounter substantial challenges in standardization across experimental workflows.
The reproducibility crisis in biomarker research affects an estimated 52% of published findings according to a Nature survey of 1,576 researchers [83]. This crisis stems from multiple sources, including pre-analytical variables, analytical inconsistencies, and insufficient validation. For ubiquitinomics, these challenges are particularly pronounced due to the labile nature of ubiquitin modifications and technical difficulties in their enrichment and detection. This guide objectively compares how these hurdles manifest across different biomarker platforms and presents standardized approaches to enhance reproducibility.
Pre-analytical Variables: Critical Front-End Challenges
Pre-analytical factors introduce significant variability before biomarker analysis even begins. These variables affect both proteomic and ubiquitinomic analyses, though their impact may differ due to the distinct nature of the analytes.
Table 1: Key Pre-analytical Variables and Their Impacts
| Variable Category | Specific Factors | Impact on Proteomics | Impact on Ubiquitinomics |
|---|---|---|---|
| Sample Collection | Time-of-day, phlebotomy technique, tube type | Alters protein degradation patterns [83] | May affect ubiquitination states and stability |
| Sample Processing | Centrifugation speed/time, temperature, delays | Affects protein integrity and quantitation [83] | Risk of deubiquitinating enzyme activity |
| Sample Storage | Freeze-thaw cycles, storage duration, temperature | Progressive protein degradation [83] | Potential loss of labile ubiquitin signatures |
| Matrix Effects | High-abundance protein interference | Albumin/IgG suppression of low-abundance proteins [84] | Additional complexity from ubiquitin conjugates |
Analytical Standardization: Workflow Comparisons and Reproducibility Gaps
Liquid Chromatography-Mass Spectrometry (LC-MS) Platforms
Mass spectrometry serves as the core analytical platform for both proteomics and ubiquitinomics, yet standardization challenges persist across workflows. In proteomics, comparative studies have evaluated multiple separation strategies, with 1D gel electrophoresis (1DGE) demonstrating advantages in protein identification (1,092 proteins) and reproducibility (80% across biological replicates N=3) compared to peptide SCX chromatography and protein reversed-phase methods [85].
For ubiquitinomics, specialized enrichment techniques are required prior to LC-MS analysis, introducing additional variability. Ubiquitin remnant immunoaffinity purification faces antibody specificity challenges, while ubiquitin-binding domain approaches struggle with non-specific interactions. These technical hurdles compound the reproducibility issues observed in general proteomics.
Figure 1: Ubiquitinomics workflow with critical variable points
Reproducibility Gaps Across Analytical Platforms
Consistency across analytical platforms remains a significant challenge. A striking demonstration comes from lipidomics, where two open-access platforms (MS DIAL and Lipostar) showed only 14.0% identification agreement when processing identical LC-MS spectra with default settings [86]. Even with fragmentation data (MS2), agreement reached only 36.1%, highlighting the substantial reproducibility gap that likely affects ubiquitinomics similarly.
Table 2: Quantitative Performance Comparison of Separation Methods in Proteomics
| Separation Method | Proteins Identified | Reproducibility of Identification | Reproducibility of Quantitation (CV) |
|---|---|---|---|
| 1D Gel Electrophoresis | 1,092 | 80% (biological N=3) | 26% |
| Peptide SCX Chromatography | 979 | 70% | 24% |
| Protein Reversed Phase (tC2) | 580 | 72% | 24% |
Data adapted from a comparative study of workflow performance for secretome proteomics [85]
Experimental Protocols for Standardized Workflows
Protocol 1: Standardized Secretome Proteomics for Biomarker Discovery
Based on established methodologies that have demonstrated high reproducibility [85]:
Sample Preparation: Culture cancer cells in serum-free medium for 24 hours to eliminate serum protein contamination. Centrifuge conditioned media at 2,000 × g for 10 minutes to remove cellular debris.
Protein Separation: Separate proteins using 4-12% gradient 1D gel electrophoresis. This method has demonstrated superior performance with 80% reproducibility in protein identification across biological replicates.
In-Gel Digestion: Excise gel bands, reduce with dithiothreitol, alkylate with iodoacetamide, and digest with sequencing-grade trypsin (1μg per 50μg protein) at 37°C overnight.
LC-MS/MS Analysis: Desalt peptides using C18 stage tips. Analyze using nanoLC-MS/MS with a linear gradient of H₂O/CH₃CN (95:5 to 70:30) over 70 minutes at 300 nL/min. Acquire full MS scans (400-1,600 m/z) followed by data-dependent MS/MS of the five most intense ions.
Data Analysis: Search data against Swiss-Prot database using SEQUEST algorithm. Apply PeptideProphet score threshold of ≥0.7 for confident identifications. Use spectral counting for relative quantitation, normalized for protein length.
Protocol 2: Cross-Platform Validation for Biomarker Verification
To address reproducibility concerns across platforms, implement orthogonal validation:
ELISA Quantification: Following LC-MS/MS identification, verify candidate biomarkers using ELISA. Include laboratory-made control samples (BMC controls) prepared in bulk, aliquoted, and stored at -80°C for single use on every plate to monitor inter-assay variability [87].
Computational Standardization: For long-term projects encountering lot-to-lot kit variability, apply computational solutions like ELISAtools in R software. Treat lot-to-lot variability as a batch effect, model a defined Reference standard curve using four- or five-parameter logistic functions, and calculate a unique Shift factor "S" for every standard curve to adjust data accordingly [87].
Multi-site Validation: Establish standardized operating procedures (SOPs) across participating sites documenting all operations from sample acquisition to processing and analysis. Include detailed documentation for every analytical run covering operator, date, critical reagents, equipment, and any procedure deviations [87].
Standardization Solutions and Quality Control Frameworks
Computational Approaches to Enhance Reproducibility
Computational methods offer powerful approaches to address standardization hurdles:
Batch Effect Correction: The ELISAtools package implements a standardized approach for normalizing data across multiple ELISA kit lots, reducing inter-assay variability from 62.4% to <9% in documented cases [87].
Machine Learning Quality Control: Support vector machine (SVM) regression combined with leave-one-out cross-validation can identify potential false positive identifications in untargeted analyses, providing a data-driven quality control step applicable to ubiquitinomics datasets [86].
Meta-analysis Integration: Re-analysis and integration of public proteomics datasets enables validation of biomarker findings across independent cohorts. One study integrated 12 public CRC proteomics datasets encompassing 440 samples from 299 patients, demonstrating the value of data reuse for biomarker validation [88].
Quality Control Metrics and Standards
Implementing rigorous quality control measures is essential for reproducible biomarker research:
Reference Materials: Utilize standardized reference materials where available, such as the Avanti EquiSPLASH LIPIDOMIX quantitative MS internal standard for lipidomics [86]. For ubiquitinomics, develop laboratory-specific reference samples from cell lines with characterized ubiquitination patterns.
Annotation Standards: Follow initiatives like the Lipidomics Standards Initiative (LSI) and Metabolomics Standards Initiative (MSI) to establish minimum reporting requirements [86]. Adapt these standards specifically for ubiquitinomics workflows.
Cross-Platform Validation: Require validation of biomarker candidates across multiple analytical platforms and in independent sample sets before considering them verified [88] [83].
Figure 2: Biomarker verification workflow with standardization
The Scientist's Toolkit: Essential Research Reagent Solutions
Table 3: Key Research Reagents and Platforms for Standardized Biomarker Research
| Reagent/Platform | Function | Standardization Role | Considerations |
|---|---|---|---|
| MS DIAL & Lipostar | Lipidomics software platforms | Enable cross-platform validation; identify reproducibility gaps | Only 14.0% identification agreement on identical spectra [86] |
| ELISAtools (R package) | Computational normalization | Corrects lot-to-lot variability in ELISA kits; reduces inter-assay variability to <9% [87] | Requires defined Reference standard curve model |
| Avanti EquiSPLASH LIPIDOMIX | Quantitative MS internal standard | Deuterated lipid mixture for normalization across experiments | Concentration: 16 ng/mL; added prior to extraction [86] |
| BMC Controls | Laboratory-made control samples | Monitor inter-assay variability; prepared in bulk and stored at -80°C [87] | Must be included on every analytical plate |
| Stable Isotope Labeling (SILAC, TMT) | Quantitative proteomics | Minimizes disparities between individually handled samples [18] | Expensive; may partially label proteins |
| PRIDE Database | Public proteomics data repository | Enables meta-analysis and validation across datasets [88] | Contains 12+ CRC datasets for biomarker validation |
The standardization hurdles facing ubiquitinomics and proteomics in cancer biomarker discovery are significant but navigable through rigorous methodological approaches. Pre-analytical variables introduce substantial variability that must be controlled through standardized protocols. Analytical platforms show concerning reproducibility gaps, with identification agreement as low as 14.0% between software platforms processing identical spectra [86].
Successful biomarker verification requires orthogonal validation approaches, computational standardization tools, and multi-site testing frameworks. Solutions such as the ELISAtools computational package demonstrate how batch effects can be systematically corrected, reducing variability to <9% [87]. Furthermore, the reuse and integration of public proteomics datasets provides a powerful resource for validating biomarker findings across independent patient cohorts [88].
For ubiquitinomics to advance as a reliable approach for cancer biomarker discovery, the field must adopt and adapt these standardization frameworks while addressing the unique challenges posed by the dynamic nature of ubiquitin modifications. Through implementation of rigorous pre-analytical controls, cross-platform validation, computational standardization, and quality control metrics, researchers can enhance reproducibility and accelerate the translation of biomarker discoveries to clinical applications.
In the evolving landscape of cancer research, proteomics has established itself as a cornerstone for biomarker discovery, providing comprehensive analysis of protein expression, modification, and interaction. Ubiquitinomics, a specialized branch of proteomics, focuses specifically on mapping ubiquitination events—a dynamic post-translational modification that regulates protein degradation, signaling, and trafficking [89]. Where traditional proteomics offers a broad snapshot of the proteome, ubiquitinomics delivers a targeted view of a crucial regulatory system frequently disrupted in cancer pathophysiology [13].
The integration of these multi-omics data layers presents both unprecedented opportunities and significant computational challenges. This comparison guide examines the bioinformatics pipelines for multi-omics data integration within the specific context of cancer biomarker discovery, evaluating their performance in handling the complexities of ubiquitinomics and proteomics data.
Comparative Analysis of Omics Approaches
Table 1: Core Characteristics of Ubiquitinomics and Proteomics in Cancer Research
| Feature | Ubiquitinomics | Broad Proteomics |
|---|---|---|
| Analytical Focus | System-wide mapping of protein ubiquitination events [89] | Comprehensive identification and quantification of proteins [18] |
| Primary Technology | Affinity enrichment + LC-MS/MS with diGly remnant recognition [89] [13] | LC-MS/MS (label-free or isobaric labeling) [18] |
| Biological Insight | Protein turnover, signaling regulation, degradation pathways [89] | Protein expression levels, post-translational modifications [1] |
| Cancer Relevance | Disrupted ubiquitination in carcinogenesis, cell cycle, proliferation [13] | Differential protein expression, metabolic reprogramming [1] [18] |
| Data Complexity | High (site-specific modifications, temporal dynamics) [89] | Moderate to High (protein abundance, multiple PTMs) [18] |
| Biomarker Potential | Survival-related ubiquitination sites (e.g., FOCAD in CRC) [13] | Diagnostic and prognostic protein panels (e.g., 12-protein panel for multiclass cancer) [7] |
Table 2: Multi-omics Data Integration Approaches and Performance
| Integration Method | Primary Application | Advantages | Limitations | Experimental Support |
|---|---|---|---|---|
| Conceptual Integration | Linking omics data via shared knowledge bases (e.g., GO, KEGG) [90] | Leverages existing knowledge; hypothesis generation | May not capture novel system dynamics [90] | STATegra, OmicsON pipelines [90] |
| Statistical Integration | Identifying co-expressed features across omics layers [90] | Identifies patterns and trends; widely applicable | Does not imply causal relationships [90] | Correlation analysis of genes/proteins [90] |
| Model-Based Integration | Simulating system behavior using mathematical models [90] | Reveals system dynamics and regulation | Requires substantial prior knowledge [90] | Network models, PK/PD modeling [90] |
| Network and Pathway Integration | Visualizing interactions through networks and pathways [90] | Integrates multiple data types effectively | May miss temporal/spatial aspects [90] | PPI networks, metabolic pathways [90] |
| Ratio-Based Profiling with Reference Materials | Cross-platform, cross-laboratory data integration [91] | Enables reproducible, comparable data across batches | Requires standardized reference materials [91] | Quartet Project reference materials [91] |
| Machine Learning Integration | Classification, clustering, and prediction from multi-omics data [92] | Identifies complex patterns; powerful predictive ability | Black box nature; requires large datasets [92] | WGCNA, correlation networks [92] |
Experimental Protocols and Methodologies
Ubiquitinomics Workflow for Cancer Biomarker Discovery
The experimental protocol for ubiquitinomics involves specific steps for enrichment and identification of ubiquitination sites, as demonstrated in colorectal cancer research [13]:
Sample Preparation:
- Tissue samples (cancerous and para-cancerous) are collected and frozen in liquid nitrogen
- Protein extraction using trichloroacetic acid (TCA) precipitation
- Trypsin digestion: proteins dissolved in tetraethyl ammonium bromide (TEAB), incubated with trypsin overnight
- Reduction with dithiothreitol (56°C for 30 minutes) and alkylation with iodoacetamide (room temperature, 15 minutes in dark)
Ubiquitinated Peptide Enrichment:
- Immunoaffinity purification using ubiquitin remnant motif antibodies (e.g., recognizing diGlycine residues)
- Enriched peptides desalted and concentrated for LC-MS/MS analysis
LC-MS/MS Analysis:
- Nanoflow liquid chromatography system (Nano Elute UHPLC)
- Peptide separation with acetonitrile gradient (6-80% mobile phase B over 60 minutes)
- Mass spectrometry using timsTOF Pro with PASEF mode
- Secondary MS scanning range: 100-1700 m/z
- Data-dependent acquisition with dynamic exclusion (30 seconds)
Database Search and Bioinformatics:
- Search against Homo sapiens database using MaxQuant
- False discovery rate (FDR) set at 1% for peptide spectrum matches
- Variable modification: GlyGly (K) for ubiquitination sites
- Quantification based on label-free quantitation with fold change threshold of 1.5
Proteomics Workflow for Cancer Biomarker Discovery
The standard proteomics workflow for cancer biomarker discovery shares similarities but focuses on comprehensive protein profiling [18]:
Sample Preparation:
- Protein extraction from tissues, cells, or body fluids
- Protein quantification using BCA assay
- Trypsin digestion after reduction and alkylation
- Optional isobaric labeling (TMT, iTRAQ) for multiplexed quantification
LC-MS/MS Analysis:
- Liquid chromatography separation (typically nano-LC)
- High-resolution mass spectrometry (Orbitrap, Q-TOF)
- Data-dependent acquisition (DDA) or data-independent acquisition (DIA/SWATH)
Data Analysis:
- Database search against protein sequence databases
- Protein identification and quantification
- Statistical analysis for differentially expressed proteins
- Pathway enrichment and functional annotation
Bioinformatics Pipelines and Data Integration Strategies
Multi-omics Integration Challenges
The integration of ubiquitinomics with other omics data presents unique challenges in bioinformatics. Ubiquitination data adds a layer of complexity due to its dynamic nature and site-specific information. Key challenges include:
Data Heterogeneity: Ubiquitinomics data consists of site-specific modifications with varying stoichiometry, while transcriptomics provides gene-level expression data, creating fundamental differences in data structure and scale [90].
Temporal Dynamics: Ubiquitination events are highly dynamic and regulate protein turnover with rapid kinetics, whereas transcriptomic and proteomic changes may occur on different timescales, complicating temporal alignment [89].
Quantitative Normalization: Integrating absolute quantification from ubiquitinomics with relative quantification from other omics requires sophisticated normalization strategies, such as ratio-based profiling using reference materials [91].
Specialized Bioinformatics Tools
Table 3: Essential Research Reagent Solutions for Multi-omics Studies
| Reagent/Resource | Function | Application Example |
|---|---|---|
| Quartet Reference Materials | Multi-omics ground truth for data normalization and integration [91] | Enables ratio-based profiling across DNA, RNA, protein, and metabolites |
| diGly-Lysine Antibody | Immunoaffinity enrichment of ubiquitinated peptides [89] [13] | Isolation of ubiquitination sites for ubiquitinomics studies |
| TMT/iTRAQ Reagents | Multiplexed quantitative proteomics [18] | Simultaneous quantification of proteins across multiple samples |
| MaxQuant Software | Identification and quantification of ubiquitination sites [13] | Database search for ubiquitinomics data with FDR control |
| Cytoscape | Network visualization and analysis [92] | Construction of gene-metabolite networks and interaction networks |
| WGCNA R Package | Weighted correlation network analysis [92] | Identification of co-expression modules across omics data types |
Visualization of Multi-omics Data Integration Workflows
Ubiquitinomics and Proteomics Integration Workflow
Multi-omics Data Integration Strategies
The integration of ubiquitinomics with traditional proteomics and other omics data represents a powerful approach for advancing cancer biomarker discovery. The complexity of multi-omics bioinformatics pipelines is substantial but manageable through appropriate method selection and quality control measures.
Ubiquitinomics provides unique insights into the regulatory mechanisms of cancer cells, complementing the broader protein expression profile obtained through conventional proteomics. The emerging evidence from colorectal cancer studies demonstrates that ubiquitination-specific signatures can identify survival-related biomarkers that might be missed by expression-based proteomics alone [13].
Future developments in multi-omics integration will likely focus on improved reference materials for standardization [91], more sophisticated machine learning approaches for pattern recognition [92], and temporal modeling to capture the dynamic nature of ubiquitination events in cancer progression [89]. As these technologies mature, integrated ubiquitinomics-proteomics approaches are poised to deliver transformative insights for cancer diagnosis, prognosis, and therapeutic development.
From Discovery to Clinic: Validating and Translating Cancer Biomarkers
The successful translation of a candidate biomarker from a discovery list to a clinically validated tool represents a major bottleneck in the fight against cancer. Within the evolving context of ubiquitinomics versus traditional proteomics for biomarker discovery, the choice of verification methodology becomes paramount. Ubiquitinomics, the large-scale study of protein ubiquitination, presents unique challenges for biomarker development due to the dynamic nature of this post-translational modification (PTM), the low stoichiometry of modified proteins, and the diversity of ubiquitin chain linkages that regulate distinct cellular processes [3]. Unlike conventional proteomics that focuses on protein abundance, ubiquitinomics requires techniques capable of capturing modified proteoforms that may signal early disease pathogenesis, including cancer development and progression [93].
The biomarker development pipeline traditionally progresses from discovery to verification and finally to clinical validation. Verification serves as the critical gateway where promising candidates from discovery-phase experiments (which may identify hundreds of potential biomarkers) are rigorously tested in larger sample sets to identify the most robust candidates for expensive large-scale validation studies [94]. For decades, antibody-based assays such as Enzyme-Linked Immunosorbent Assay (ELISA) have dominated the verification landscape, providing exceptional sensitivity and throughput. However, the emergence of mass spectrometry-based approaches like Selected Reaction Monitoring (SRM) and Multiple Reaction Monitoring (MRM) offers powerful alternatives that are particularly suited for quantifying specific protein modifications and isoforms. This guide provides an objective comparison of these two methodological frameworks, focusing on their application in verifying cancer biomarkers derived from both traditional proteomic and emerging ubiquitinomic studies.
Antibody-Based Assays (e.g., ELISA)
Principle: Antibody-based assays rely on the specific binding of antibodies to their target antigens (proteins) to generate a quantifiable signal. In a typical sandwich ELISA, a capture antibody immobilized on a solid surface binds the target protein from a sample, and a detection antibody (often conjugated to an enzyme) binds to a different epitope on the same protein. The enzyme then catalyzes a colorimetric, chemiluminescent, or fluorescent reaction, with signal intensity proportional to the amount of captured protein [95] [96].
Workflow: The process involves sample preparation, incubation with capture antibody, washing, incubation with detection antibody, another washing step, addition of substrate, and finally signal detection and quantification. These methods are well-standardized and can be automated for high-throughput analysis.
SRM/MRM Mass Spectrometry
Principle: SRM/MRM is a targeted mass spectrometry technique that achieves quantification by monitoring specific precursor-to-fragment ion transitions unique to the target analyte. The most common implementation uses a triple quadrupole mass spectrometer, where the first quadrupole (Q1) selects a specific peptide ion (precursor ion) derived from the protein of interest, the second quadrupole (q2) fragments the precursor via collision-induced dissociation, and the third quadrupole (Q3) selects a specific fragment ion (product ion) for detection [97] [98]. The selection of a specific precursor-product ion pair is called a "transition," and monitoring multiple transitions for the same peptide or for different peptides from the same protein significantly enhances specificity [98].
Workflow: The SRM/MRM workflow begins with protein extraction and enzymatic digestion (typically with trypsin) to generate peptides. For ubiquitinomics studies, an additional ubiquitinated peptide enrichment step using anti-K-ε-GG antibodies is crucial due to the low abundance of these modifications [93] [3]. The digested peptides are separated by liquid chromatography (LC) and introduced into the mass spectrometer, where predefined transitions are monitored. Quantification is achieved by measuring the chromatographic peak areas of the transitions, often using stable isotope-labeled internal standards for absolute quantification [95] [97].
The following diagram illustrates the core operational principle of SRM/MRM on a triple quadrupole mass spectrometer:
Comparative Performance Analysis
Direct Method Comparison
The table below summarizes the core technical and operational characteristics of SRM/MRM and antibody-based assays, highlighting their respective strengths and limitations for biomarker verification.
Table 1: Direct Comparison of SRM/MRM and Antibody-Based Assays for Biomarker Verification
| Parameter | SRM/MRM | Antibody-Based Assays (e.g., ELISA) |
|---|---|---|
| Principle | Mass-based detection of proteotypic peptides [97] | Antibody-antigen binding and signal amplification [95] |
| Specificity | High (dual mass selection); can distinguish PTMs, SNPs, and sequence variants [99] | High (epitope-dependent); may cross-react with homologous proteins [99] |
| Multiplexing Capacity | High (100-300 transitions/run) [97] | Low (typically 1 analyte/well); Luminex allows moderate multiplexing [95] [94] |
| Throughput | Moderate | High |
| Sensitivity | Moderate (nanogram/mL range) [97] | High (picogram/mL range) [97] |
| Dynamic Range | ~3-4 orders of magnitude [95] | ~3-4 orders of magnitude [95] |
| Antibody Requirement | Not required for detection [99] | Required (two high-quality antibodies for sandwich assays) |
| Development Time/Cost | Moderate (peptide synthesis, method optimization) | High/Lengthy (antibody production, validation) [95] |
| Assay Reproducibility | High (CVs typically <15%) [95] | High (CVs typically <10%) |
| Ideal Application | Verification of specific proteoforms (PTMs, mutants), panels, scarce targets [98] | High-throughput verification of single, abundant targets [95] |
Quantitative Performance Data
Head-to-head comparisons in verifying known serum proteins demonstrate the relative performance of these techniques. A 2011 study quantifying ceruloplasmin (CP), serum amyloid A (SAA), and sex hormone binding globulin (SHBG) found excellent correlations between SRM and LUMINEX/ELISA for some, but not all, targets.
Table 2: Experimental Correlation Data Between SRM/MRM and Immunoassays [95]
| Protein Target | Correlation (R²) with Immunoassay | SRM Reproducibility (R²) | Linear Range |
|---|---|---|---|
| Serum Amyloid A (SAA) | 0.928 | 0.931 | 10³ - 10⁴ |
| Sex Hormone Binding Globulin (SHBG) | 0.851 | 0.882 | 10³ - 10⁴ |
| Ceruloplasmin (CP) | 0.565 | 0.723 | 10³ - 10⁴ |
The data shows that SRM can achieve performance comparable to immunoassays for certain proteins, though performance is protein-dependent. The reproducibility of SRM is generally very good but can also vary based on the specific protein or peptide being monitored [95]. Both techniques demonstrate a similarly wide linear range, which is essential for quantifying biomarkers that can be present at vastly different concentrations in biological samples.
Experimental Protocols for Biomarker Verification
Protocol: SRM/MRM Assay for Serum Proteins (Without Isotope Labeling)
This protocol is adapted from a study that validated the quantification of serum proteins without the use of isotopic labels [95].
Sample Preparation:
- Dilute 1 μL of serum sample with 100 μL of 50 mM ammonium bicarbonate.
- Denature and reduce proteins by adding DTT to a final concentration of 10 mM and incubating at 95°C for 5 minutes.
- Alkylate by adding iodoacetamide (IAA) to a final concentration of 20 mM and incubating at room temperature for 30 minutes in the dark.
- Digest proteins by adding sequencing-grade trypsin at an enzyme-to-protein ratio of 1:50 (w/w) and incubating at 37°C for 12 hours.
- Terminate digestion by adding formic acid to a final concentration of 1%. Lyophilize the digested peptide mixture and reconstitute in 0.1% formic acid for MS analysis.
Transition Development:
- Import target protein sequences into software (e.g., MIDAS Workflow Designer, Skyline).
- Generate a list of potential proteotypic peptides using settings: trypsin digestion, 0 missed cleavages, fixed modification of carbamidomethylation (C).
- Apply filters (e.g., peptide length 6-30 amino acids, Q1 m/z > 400, Q3 m/z < 1200) to narrow the candidate list.
- Analyze a digest of the purified protein and select the top 3-4 peptides with the highest SRM response as signature peptides. For each signature peptide, select the top 2 fragment ions to create a pair of transitions.
LC-SRM/MRM Analysis:
- Use a nano-HPLC system coupled to a triple quadrupole mass spectrometer (e.g., 4000 QTRAP).
- Load the digested sample onto a C18 reversed-phase column.
- Separate peptides using a gradient of 5% to 40% acetonitrile (in 0.1% formic acid) over 40 minutes.
- Monitor the predefined MRM transitions with a dwell time of 80 ms.
- Use information-dependent acquisition (IDA) to trigger MS/MS scans when transition intensity exceeds a threshold, confirming peptide identity.
Data Analysis:
- Integrate chromatographic peaks for each transition.
- Quantify based on peak areas. Construct calibration curves using standard peptides for absolute quantification.
Protocol: Ubiquitinated Peptide Enrichment for Ubiquitinomics
For verifying ubiquitination-specific biomarkers, sample preparation requires an enrichment step prior to SRM/MRM or LC-MS/MS analysis [93] [3].
Protein Extraction and Digestion:
- Homogenize tissue or cell samples in an appropriate lysis buffer.
- Perform protein quantification.
- Digest the total protein extract using the standard protocol described in section 4.1.
Enrichment of Ubiquitinated Peptides:
- Reconstitute the dried peptide digest in immunoaffinity purification (IAP) buffer.
- Incubate the peptide mixture with anti-K-ε-GG antibody-conjugated beads to specifically enrich for peptides containing the diglycine remnant left after tryptic digestion of ubiquitinated proteins.
- After incubation, wash the beads extensively to remove non-specifically bound peptides.
- Elute the bound ubiquitinated peptides using a low-p pH buffer.
LC-MS/MS Analysis:
- The enriched ubiquitinated peptides can now be analyzed either by a discovery proteomics LC-MS/MS workflow to identify ubiquitination sites or by a targeted SRM/MRM workflow to verify and quantify specific ubiquitination events.
The following workflow diagram summarizes the key steps in preparing samples for ubiquitinomics studies, leading into either discovery or verification phases:
Ubiquitinomics in Cancer Research: Pathways and Relevance
Ubiquitination is a crucial regulatory mechanism implicated in numerous cancer-relevant signaling pathways. Ubiquitinomics studies aim to map these modifications systematically to uncover novel disease mechanisms and biomarkers.
- PI3K-AKT Signaling Pathway: This pro-survival pathway is frequently hyperactivated in cancer. The ubiquitination status of various components (e.g., receptors, AKT itself, PTEN) tightly regulates pathway activity. Aberrant ubiquitination can lead to uncontrolled cell growth and survival [93].
- Hippo Signaling Pathway: This pathway controls organ size and tissue homeostasis by regulating cell proliferation and apoptosis. Ubiquitination of core components like YAP/TAZ is a key regulatory mechanism. Dysregulation of ubiquitination in this pathway contributes to tumorigenesis [93].
- NF-κB Signaling Pathway: K63-linked polyubiquitination plays a non-proteolytic role in activating the IKK complex, a central regulator of the NF-κB pathway, which controls immune response, inflammation, and cell survival—processes often hijacked in cancer [3] [100].
- DNA Damage Response: Ubiquitination events (e.g., involving K6, K27, K63 linkages) are critical for the cellular response to DNA damage, facilitating repair or initiating apoptosis. Defects in these processes can promote genomic instability and cancer progression [3] [100].
The diversity of ubiquitin chain linkages and their functional consequences in cancer-relevant pathways underscores why verification methods capable of detecting specific modifications are essential.
Table 3: Ubiquitin Linkage Types and Their Cancer-Relevant Biological Roles [3] [100]
| Ubiquitin Linkage Type | Primary Cancer-Relevant Functions |
|---|---|
| K48 | Canonical proteasomal degradation of tumor suppressors and oncoproteins |
| K63 | Regulation of NF-κB signaling, DNA damage response, endocytosis, and protein-protein interactions |
| K11 | Cell cycle and mitosis regulation; membrane trafficking |
| K27 | DNA damage response; proteasomal signaling |
| K29 | Proteasomal signaling |
| K33 | Regulation of T-cell receptor response |
| K6 | DNA damage response; mitophagy |
| M1 (Linear) | Regulation of NF-κB signaling and inflammation |
The Scientist's Toolkit: Essential Research Reagents and Materials
Successful implementation of either verification framework requires specific, high-quality reagents. The following table details key materials and their functions.
Table 4: Essential Reagents for Biomarker Verification Workflows
| Reagent / Material | Function | Application in |
|---|---|---|
| Anti-K-ε-GG Antibody | Immunoaffinity enrichment of ubiquitinated peptides from complex digests by recognizing the diglycine remnant on modified lysines. | Ubiquitinomics (SRM/MS) |
| Protease (Trypsin) | Enzymatic digestion of proteins into peptides for mass spectrometric analysis or epitope exposure. | SRM/MS & Immunoassays |
| Stable Isotope-Labeled Standard (AQUA) Peptides | Internal standards for absolute quantification; correct for sample preparation variability and ionization efficiency. | SRM/MS (Quantitative) |
| Capture and Detection Antibodies | Form the core of a sandwich immunoassay, providing specificity by binding to distinct epitopes on the target protein. | Immunoassays (ELISA) |
| Triple Quadrupole Mass Spectrometer | The primary platform for executing SRM/MRM assays, enabling precise selection of precursor and product ions. | SRM/MS |
| Microplates & ELISA Reader | Solid-phase support for immunoassay and optical signal detection/quantification. | Immunoassays (ELISA) |
Both SRM/MRM and antibody-based assays are powerful yet distinct frameworks for biomarker verification. The choice between them depends heavily on the research question, the nature of the biomarker, and the available resources.
Antibody-based assays like ELISA remain the gold standard for high-throughput, sensitive verification of single, abundant protein targets when high-quality antibodies are available. They are ideal for focused studies and clinical settings where rapid, robust testing is required.
SRM/MRM mass spectrometry offers a compelling alternative, particularly in the context of modern biomarker discovery that increasingly focuses on specific proteoforms, post-translational modifications (like ubiquitination), and complex multi-protein signatures. Its principal advantages include the ability to multiplex the verification of dozens to hundreds of candidates simultaneously, to distinguish between protein variants and modifications without custom reagents, and to develop assays for targets for which antibodies are unavailable or difficult to produce [95] [99].
For the advancing field of ubiquitinomics in cancer research, SRM/MRM is particularly well-suited. It allows researchers to move beyond simply quantifying protein abundance to verifying the dynamic ubiquitination events that directly regulate protein function and stability in cancer pathways. By enabling the specific, multiplexed verification of ubiquitination sites identified in discovery screens, SRM/MRM provides a critical bridge connecting large-scale ubiquitinomic profiling to the validation of clinically useful biomarkers.
In the field of cancer research, proteomics and ubiquitinomics offer complementary perspectives for biomarker discovery. Proteomics provides a broad, unbiased view of protein expression, abundance, and dynamics, characterizing the entire set of proteins in a biological system [1]. In contrast, ubiquitinomics offers a deep, focused examination of a specific but crucial post-translational modification (PTM)—protein ubiquitination—which regulates diverse cellular processes from protein degradation to signal transduction [3] [101].
The choice between these approaches hinges on a fundamental trade-off: the comprehensive breadth of proteomic profiling versus the specialized depth of the ubiquitinome. This guide objectively compares their performance, supported by experimental data relevant to researchers and drug development professionals in oncology.
Direct Comparison: Technical Performance and Output
The table below summarizes the core quantitative outputs and strengths of each approach, based on recent high-throughput studies.
| Feature | Proteomics (Global Profiling) | Ubiquitinomics |
|---|---|---|
| Primary Readout | Protein identity and abundance [16] | Sites and dynamics of ubiquitination (K-ε-GG modification) [3] [35] [102] |
| Typical Scale in Cancer Studies | ~10,000 protein groups from cell lines [16] | Up to 70,000 ubiquitinated peptides from tissue or cell lines [102] |
| Key Strength | Breadth: Unbiased snapshot of the proteome; ideal for cataloging differentially expressed proteins [16] [1] | Depth: Decodes the "ubiquitin code"; identifies regulatory events invisible to proteomics alone [3] [101] [102] |
| Best Suited For | Discovering expression-level biomarkers; initial phenotypic screening [16] [7] | Uncovering functional mechanisms, drug MoA (e.g., DUB/MGD action), and degradation-specific biomarkers [16] [35] [102] |
| Key Limitation | Cannot directly detect PTM-driven functional changes [16] | Does not directly measure protein abundance changes; requires correlation with proteomics for functional interpretation [102] |
Detailed Experimental Protocols
To contextualize the data in the table, here are the detailed methodologies behind these high-performance benchmarks.
Protocol 1: High-Throughput Global Proteomics for MGD Screening
This protocol is designed for the unbiased discovery of novel molecular glue degraders (MGDs) and their neosubstrates [16].
- Cell Culture & Treatment: Plate cancer cell lines (e.g., Huh-7 and NB-4) in 96-well plates. Treat with a library of CRBN-recruiting MGD candidates (e.g., at 10 µM) and controls (DMSO) for a defined period (e.g., 6 h and 24 h) [16].
- Cell Lysis & Protein Extraction: Lyse cells using a buffer compatible with downstream processing. A sodium deoxycholate (SDC)-based lysis protocol is recommended for its high efficiency and compatibility with MS [102].
- Protein Digestion: Digest extracted proteins into peptides using trypsin [16].
- LC-MS Analysis: Analyze the resulting peptides using a single-shot, label-free nano-liquid chromatography system coupled to a mass spectrometer operating in data-independent acquisition (DIA) mode, such as diaPASEF [16].
- Data Processing & Analysis: Process the raw MS data using specialized software (e.g., DIA-NN) for peptide identification and quantification. Statistically analyze the data to identify proteins showing significant abundance changes after MGD treatment [16].
Protocol 2: High-Depth Ubiquitinomics for Target Deconvolution
This protocol leverages advanced enrichment and MS techniques to deeply profile the ubiquitinome, ideal for studying pathways like USP7 inhibition in cancer [102].
- Cell Treatment & Lysis: Treat cells (e.g., HCT116) with the compound of interest (e.g., a USP7 inhibitor). Lyse cells using an optimized SDC buffer supplemented with chloroacetamide (CAA). Immediate boiling after lysis is critical to preserve the ubiquitinome by inactivating deubiquitinases (DUBs) [102].
- Protein Digestion: Digest the extracted proteins with trypsin. This cleaves both the substrate proteins and the conjugated ubiquitin, leaving a characteristic di-glycine (K-ε-GG) remnant on the modified lysine site [3].
- Enrichment of Ubiquitinated Peptides: Immunoaffinity purify the K-ε-GG-containing peptides using specific anti-K-ε-GG antibody beads. This enrichment is essential due to the low stoichiometry of ubiquitination [35] [102].
- LC-MS Analysis: Analyze the enriched peptides using nanoLC coupled to a mass spectrometer operating in DIA mode. DIA is superior to traditional data-dependent acquisition (DDA) for ubiquitinomics, providing greater coverage, quantitative precision, and data completeness [102].
- Data Processing: Process the data using neural network-based software (e.g., DIA-NN) with a scoring module optimized for K-ε-GG peptide identification. This allows for the confident quantification of tens of thousands of ubiquitination sites in a single experiment [102].
Diagram illustrating the parallel but distinct workflows for global proteomics and ubiquitinomics, highlighting key differentiating steps like K-ε-GG enrichment.
The Scientist's Toolkit: Essential Research Reagents
Successful execution of these protocols relies on key reagent solutions. The following table details essential materials and their functions.
| Research Reagent Solution | Function in Experiment |
|---|---|
| Anti-K-ε-GG Antibody Beads (e.g., PTMScan Kit) | Critical for enriching low-abundance ubiquitinated peptides from complex tryptic digests prior to LC-MS/MS analysis, dramatically increasing depth of coverage [35] [102]. |
| SDC (Sodium Deoxycholate) Lysis Buffer | A highly efficient protein extraction reagent that, when supplemented with CAA, improves ubiquitinome coverage and reproducibility compared to traditional urea-based buffers [102]. |
| Chloroacetamide (CAA) | An alkylating agent used during lysis to rapidly and effectively inhibit deubiquitinases (DUBs), preserving the native ubiquitination state of proteins by preventing artifactual deubiquitination [102]. |
| Data-Independent Acquisition (DIA) Mass Spectrometry | An MS data acquisition technique that fragments all ions in a given m/z window, leading to more comprehensive and reproducible identification and quantification of peptides compared to data-dependent acquisition (DDA) [16] [102]. |
| DIA-NN Software | A deep neural network-based data processing tool specifically optimized for DIA data. It includes specialized scoring for modified peptides like K-ε-GG, enabling high-confidence identification of tens of thousands of ubiquitination sites [102]. |
Making the Choice: Application in Cancer Research
The decision between proteomics and ubiquitinomics is not a matter of which is superior, but which is most appropriate for the specific biological or clinical question.
Choose Global Proteomics when your goal is to identify signature protein expression patterns associated with cancer types, stages, or treatment response. Its breadth is ideal for biomarker discovery at the expression level, as demonstrated in studies differentiating colon, kidney, liver, and brain tumors based on protein abundance profiles [7].
Choose Ubiquitinomics when you need to investigate the mechanism of action (MoA) of targeted therapies or understand signaling pathway dysregulation at a functional level. Its depth is powerful for:
- Deconvoluting the targets of molecular glue degraders (MGDs) and PROTACs by identifying novel neosubstrates [16].
- Profiling the activity of deubiquitinase (DUB) inhibitors, revealing which proteins are ubiquitinated and whether this leads to their degradation or functional modulation [102].
- Identifying altered ubiquitination networks in human tumors, such as in lung squamous cell carcinoma (LSCC), which can reveal new therapeutic targets and pathways beyond what proteomics alone can show [35].
For the most comprehensive insights, an integrated approach that combines both global proteomics and ubiquitinomics is increasingly becoming the gold standard in translational cancer research [16] [102].
The search for robust biomarkers that can predict cancer patient prognosis and treatment response is a cornerstone of modern oncology. Within this realm, two powerful approaches for profiling the cancer proteome have emerged: traditional proteomics, which provides a comprehensive snapshot of protein abundance, and ubiquitinomics, which specifically maps the ubiquitin-modified proteome. While proteomics reveals the cellular machinery's end-state, ubiquitinomics offers a dynamic view of the critical post-translational modifications that regulate protein stability, function, and localization. This guide objectively compares the biomarker potential of these two methodologies, focusing on their ability to link molecular profiles to concrete patient outcomes such as survival, disease stage, and therapy response. The clinical correlation of molecular data is paramount; it transforms observational science into actionable knowledge for patient stratification and drug development. We will dissect the experimental data supporting each approach, providing a clear comparison of their strengths, limitations, and clinical applicability in the era of precision medicine.
Comparative Data: Ubiquitinomics and Proteomics as Tools for Biomarker Discovery
The utility of a biomarker discovery platform is measured by its clinical translatability. The table below summarizes quantitative evidence linking ubiquitinomics and proteomics findings to patient outcomes, based on recent studies.
Table 1: Clinical Correlation of Ubiquitinomics and Proteomics-Derived Biomarkers
| Biomarker/Approach | Cancer Type(s) | Correlation with Patient Outcome | Supporting Data Source |
|---|---|---|---|
| UBA1/UBA6 (Ubiquitinomics) | Pan-cancer (e.g., BRCA, COAD, KIRC, LUAD) | High expression associated with poor overall survival; correlation with advanced clinical stage and immune infiltration [103]. | TCGA Pan-cancer Analysis |
| Novel CRBN Neosubstrates (Ubiquitinomics) | Various (via Huh-7, NB-4 cell lines) | Identification of degradable proteins (e.g., KDM4B, G3BP2, VCL) for targeting "undruggable" oncoproteins [16]. | High-Throughput Proteomics Screening |
| Bibliometric Analysis of Ubiquitination | Breast Cancer | Research focus shifted to triple-negative breast cancer (TNBC), immunity, and prognosis, indicating a key emerging area for clinical biomarkers [104]. | Analysis of 1,850 publications (2005-2024) |
| OncoBird Framework (Proteogenomics) | Metastatic Colorectal Cancer (mCRC) | Identified predictive biomarkers for cetuximab/bevacizumab response; e.g., chr20q amplifications [105]. | Analysis of FIRE-3 RCT (n=752 patients) |
| Emerging Biomarkers (Proteomics) | Various | ctDNA, exosomes, and miRNAs show promise for non-invasive early detection and monitoring, though clinical standardization is ongoing [106]. | Literature Review |
Experimental Protocols: Methodologies for Uncovering Clinically Relevant Biomarkers
Protocol 1: High-Throughput Ubiquitinomics for Neosubstrate Discovery
This protocol, derived from a landmark study, uses high-throughput proteomics to identify novel degradation targets induced by molecular glue degraders (MGDs) [16].
- 1. Cell Line Selection & Treatment: Select cancer cell lines sensitive to MGDs (e.g., Huh-7, NB-4). Incubate cells in 96-well plates with a library of CRBN-recruiting MGDs (e.g., 100 compounds) at a defined concentration (e.g., 10 µM) for a specified period (e.g., 24 hours). Include DMSO controls.
- 2. Sample Preparation for Proteomics: Perform semi-automated cell lysis, protein extraction, and digestion. This ensures high reproducibility for processing hundreds of samples.
- 3. Mass Spectrometry Analysis: Analyze samples using data-independent acquisition mass spectrometry (diaPASEF). This label-free method enables deep, quantitative profiling of thousands of proteins across all samples.
- 4. Data Processing and Hit Identification: Process MS data using specialized software. Designate compounds that induce a significant reduction (e.g., >25%) in protein abundance as "hits."
- 5. Validation and Mechanism Elucidation:
- Early Time Point Confirmation: Re-test hit compounds at an earlier time point (e.g., 6 hours) to confirm rapid degradation.
- CRL Dependency Check: Co-treat cells with the MGD and the NEDD8-activating enzyme inhibitor MLN4924. Rescue of protein levels confirms degradation is dependent on cullin-RING E3 ligases.
- Global Ubiquitinomics: Treat cells with the MGD for a short period (e.g., 30 minutes) and use ubiquitin enrichment protocols to confirm direct ubiquitination of the neosubstrate, proving it is a bona fide target.
Protocol 2: A Multi-Omics Framework for Biomarker Validation from Clinical Trials
The OncoBird framework is a computational protocol designed to systematically discover predictive biomarkers from randomized controlled trials (RCTs) with molecular data [105].
- 1. Data Input and Molecular Landscape Analysis: Input molecular data from a clinical trial cohort, including somatic mutations, copy number alterations, and predefined tumour subtypes (e.g., Consensus Molecular Subtypes (CMS) in colorectal cancer). The framework first characterizes the overall molecular landscape of the trial population.
- 2. Single-Gene and Genetic Alteration Analysis: Systematically test individual genetic alterations (e.g., mutations, amplifications) for their association with clinical outcome (e.g., overall survival) within each treatment arm. This identifies prognostic biomarkers.
- 3. Subtype-Specific Biomarker Identification: Investigate the alterations identified in Step 2 within the context of the pre-defined tumour subtypes. This reveals whether a biomarker's effect is specific to a certain biological subtype of the cancer.
- 4. Assessment of Predictive Components: Test for significant interactions between the identified biomarkers and the treatment arms. A significant interaction indicates that the biomarker is predictive, meaning it can identify patients who will benefit more from one therapy over another.
- 5. Multiple Testing Correction and Validation: Apply rigorous statistical correction for multiple hypotheses testing (e.g., False Discovery Rate). Validate the robustness of the predictive biomarkers using resampling methods to ensure findings are not due to chance.
Visualization of Workflows
The following diagrams illustrate the core workflows for the experimental protocols described above, highlighting the logical sequence of steps from experimental setup to clinical correlation.
Ubiquitinomics Neosubstrate Discovery Workflow
OncoBird Biomarker Discovery Framework
The Scientist's Toolkit: Key Research Reagent Solutions
Successful execution of the described protocols relies on a suite of essential reagents and tools. The table below details key solutions for researchers in this field.
Table 2: Essential Research Reagents for Ubiquitinomics and Biomarker Discovery
| Research Reagent / Tool | Function / Application | Example Use Case |
|---|---|---|
| CRBN-Recruiting MGD Library | A diverse set of small molecules that bind to and alter the specificity of the E3 ligase Cereblon, inducing degradation of neosubstrates [16]. | Screening for novel degradable proteins in cancer cell lines. |
| diaPASEF Mass Spectrometry | A next-generation MS method that provides deep, reproducible, and quantitative profiling of complex protein mixtures in high-throughput mode [16]. | Quantifying protein abundance changes in hundreds of MGD-treated samples. |
| NEDD8-Activating Enzyme Inhibitor (e.g., MLN4924) | A small molecule inhibitor that blocks the activity of the NEDD8-activating enzyme, thereby inactivating cullin-RING E3 ligases (CRLs) [16]. | Confirming that MGD-induced degradation is dependent on the CRL ubiquitination machinery. |
| TCGA & GEO Databases | Publicly available repositories containing genomic, transcriptomic, proteomic, and clinical data from thousands of cancer patients across multiple tumor types [103]. | Validating the correlation between biomarker (e.g., UBA1) expression and patient survival in pan-cancer analyses. |
| OncoBird Computational Framework | An open-source software package for the systematic analysis of molecular data from randomized clinical trials to identify predictive biomarkers [105]. | Discovering subtype-specific biomarkers that predict response to cetuximab vs. bevacizumab in mCRC. |
| TISIDB Database | A web portal for tumor and immune system interaction that integrates multiple data types from TCGA and other sources [103]. | Analyzing the relationship between gene expression (e.g., UBA6) and tumor immune infiltration levels. |
The ubiquitin-proteasome system (UPS) represents a pivotal regulatory network in cellular homeostasis, with E3 ubiquitin ligases and deubiquitinases (DUBs) serving as critical determinants of substrate specificity. Within cancer research, the emerging field of ubiquitinomics presents a paradigm shift from traditional proteomics by specifically capturing the post-translational modifications that directly regulate protein stability and function. This review comprehensively compares the experimental approaches, datasets, and therapeutic insights generated through ubiquitinomics versus conventional proteomics for biomarker discovery. We provide a detailed analysis of quantitative alterations in E3 ligases and DUBs across cancer types, outline validated experimental protocols for target identification, and visualize key signaling pathways amenable to therapeutic intervention. The integration of multi-omics data reveals the profound potential of targeting the ubiquitin system for novel cancer therapeutics, with an emphasis on overcoming current methodological challenges.
Protein ubiquitination represents a crucial post-translational modification that regulates diverse cellular processes including protein degradation, signal transduction, DNA repair, and cell cycle progression [107]. The specificity of ubiquitination is predominantly controlled by E3 ubiquitin ligases, which recognize target proteins and facilitate ubiquitin transfer, while deubiquitinases (DUBs) reverse this process by removing ubiquitin moieties [107] [108]. The human genome encodes approximately 600 E3 ligases and 100 DUBs, creating an intricate regulatory network with profound implications for cellular homeostasis and disease pathogenesis [107] [108].
In the context of cancer research, traditional proteomics provides valuable information about protein abundance but offers limited insight into the dynamic post-translational modifications that directly regulate protein function and turnover. Ubiquitinomics, a specialized subset of proteomics, specifically characterizes the ubiquitin-modified proteome (ubiquitylome), offering direct evidence of ubiquitination events and their functional consequences [107]. This approach has revealed critical limitations of transcriptome-only analyses, as one study demonstrated that only 34.3% of genes showed a significant positive correlation between mRNA and protein log2-transformed fold changes in gastric cancer tissues [107]. This discrepancy underscores the essential regulatory role of ubiquitination in determining protein abundance independent of transcription.
The therapeutic relevance of targeting the ubiquitin system is underscored by the clinical success of proteasome inhibitors in hematologic malignancies and the recent development of proteolysis-targeting chimeras (PROTACs) that harness E3 ligases to selectively degrade disease-causing proteins [107] [109]. This review systematically compares experimental approaches for identifying E3 ligases and DUBs as therapeutic targets, with a specific focus on the complementary insights generated through ubiquitinomics versus conventional proteomics in cancer research.
Comparative Multi-Omics Analysis: Methodological Approaches
The integration of multiple omics technologies has dramatically advanced our understanding of E3 ligase and DUB functions in cancer pathogenesis. This section outlines the primary methodological frameworks and their respective advantages and limitations.
Proteomic Profiling of E3 Ligases and DUBs in Cancer
Large-scale proteomic analyses across 12 cancer types have revealed that E3 ligases demonstrate significant dysregulation in malignant tissues compared to normal adjacent tissues [107]. These studies, sourced from the National Cancer Institute's Proteomic Data Commons (PDC), demonstrated that E3 ligases tend to be up-regulated in tumors and exhibit reduced tissue specificity compared to their expression patterns in normal tissues [107]. The correlation of protein expression between E3 ligases and their established substrates showed significant alterations in cancers, suggesting fundamental changes in E3-substrate specificity during tumorigenesis [107].
A key methodological consideration is the comparative coverage of different proteomic approaches. While Reverse Phase Protein Array (RPPA) technology has been widely used in cancer studies, this technique is limited to measuring approximately 200 predefined proteins or post-translational modifications per cancer type [107]. In contrast, mass spectrometry-based proteomics identifies approximately 20,000 proteins, providing substantially greater coverage of the proteome and enabling more comprehensive characterization of E3 ligase and DUB expression patterns [107].
Integrated Multi-Omics Workflows
The most insightful analyses have emerged from integrated approaches that combine transcriptome, proteome, and ubiquitylome data. In a landmark study on lung squamous cell carcinoma (LSCC), researchers employed a tripartite multi-omics strategy that revealed clinically actionable insights [107]. This approach identified that upregulation of the SKP2 E3 ligase leads to excessive degradation of BRCA2, potentially promoting tumor cell proliferation and metastasis [107]. Additionally, the upregulation of E3 ubiquitin-protein ligase TRIM33 was identified as a biomarker associated with favorable prognosis through inhibition of the cell cycle [107].
Table 1: Comparison of Omics Approaches for E3 Ligase and DUB Profiling
| Methodological Approach | Key Strengths | Principal Limitations | Representative Findings |
|---|---|---|---|
| Transcriptomics | Comprehensive coverage of all expressed genes; standardized workflows | Poor correlation with protein levels for ~66% of genes [107] | Identifies transcriptional regulatory networks |
| Proteomics (Mass Spectrometry) | Direct measurement of protein abundance; large coverage (~20,000 proteins) | Does not capture post-translational modifications without enrichment | E3 ligases are upregulated and show reduced tissue specificity in tumors [107] |
| Proteomics (RPPA) | High sensitivity for predefined targets; quantitative | Limited coverage (~200 proteins); antibody-dependent | Useful for validation but insufficient for discovery |
| Ubiquitinomics | Direct identification of ubiquitination sites; functional insights | Technically challenging; requires specialized enrichment | Reveals altered E3-substrate relationships in cancer [107] |
| Integrated Multi-Omics | Comprehensive view of regulation from gene to function | Complex data integration; computational challenges | SKP2 upregulation degrades BRCA2 in LSCC; TRIM33 as favorable prognostic marker [107] |
The following diagram illustrates the integrated multi-omics workflow for E3 ligase and DUB target identification:
Quantitative Alterations of E3 Ligases and DUBs in Human Cancers
Comprehensive proteomic analyses across multiple cancer types have revealed consistent patterns of E3 ligase and DUB dysregulation. This systematic characterization provides a foundation for understanding the roles of these enzymes in cancer pathogenesis and for prioritizing therapeutic targets.
Pan-Cancer Expression Patterns
The analysis of E3 ligase expression across 12 cancer types demonstrated that these regulatory enzymes are frequently upregulated in tumors compared to normal adjacent tissues [107]. This upregulation pattern was associated with reduced tissue specificity, suggesting that the normal regulatory constraints on E3 ligase expression are disrupted during tumorigenesis [107]. The number of identifiable E3 ligases and DUBs in proteomic datasets varied substantially across cancer types, with glioblastoma (GBM) showing approximately twice as many E3 ligases and DUBs compared to colon adenocarcinoma (COAD) [107].
The correlation between E3 ligase expression and their substrate proteins undergoes significant reorganization in cancer. These altered correlation patterns suggest fundamental changes in E3-substrate specificity in malignant tissues compared to normal counterparts [107]. This finding has profound implications for therapeutic targeting, as it indicates that the functional relationships within the ubiquitin system are context-dependent and may be reprogrammed during oncogenic transformation.
Table 2: E3 Ligase and DUB Alterations Across Cancer Types
| Cancer Type | Key E3 Ligase Alterations | Key DUB Alterations | Functional Consequences |
|---|---|---|---|
| Liver Cancer (HCC) | Multiple E3 ligases upregulated in therapeutic resistance [110] | DUB networks regulate drug resistance mechanisms [110] | Enhanced survival under therapeutic pressure; immune evasion |
| Lung Squamous Cell Carcinoma (LSCC) | SKP2 upregulation; TRIM33 associated with favorable prognosis [107] | Not specified in search results | BRCA2 degradation promoting proliferation; cell cycle inhibition |
| Metabolic Dysfunction-Associated Steatotic Liver Disease (MASLD) | TRIM8 increased; TRIM31 decreased [111] | Not specified in search results | TRIM8 activates TAK1-JNK/p38 pathway; TRIM31 degradation of RHBDF2 alleviates disease |
| Bladder Cancer | Multiple E3s involved in oncogenesis and drug resistance [112] | DUBs regulate immunotherapy response [112] | Tumor progression; therapeutic resistance; modulation of immune responses |
| Bone Disorders | Smurf1/2 inhibit osteogenesis; TRIM family members have divergent effects [113] [114] | USP2, USP34 enhance osteogenesis; USP10, USP12 suppress differentiation [113] [114] | Imbalance in bone homeostasis leading to osteoporosis and impaired fracture healing |
Cancer-Type Specific Regulatory Networks
The functional consequences of E3 ligase and DUB dysregulation manifest in cancer-type specific signaling networks. In hepatocellular carcinoma (HCC), dynamic ubiquitination networks regulate therapeutic resistance to conventional and targeted therapies [110]. The high heterogeneity of this malignancy promotes the emergence of resistance mechanisms controlled by specific E3 ligases and DUBs that serve as gatekeepers of treatment response [110].
In metabolic dysfunction-associated steatotic liver disease (MASLD), which can progress to hepatocellular carcinoma, specific E3 ligases regulate inflammatory and metabolic pathways central to disease pathogenesis [111]. TRIM8 expression is increased in MASLD/MASH patients and animal models, where it directly binds to TAK1 and induces its ubiquitination, leading to activation of downstream JNK/p38 and NF-κB signaling pathways [111]. Conversely, TRIM31 expression is downregulated in MASH and mitigates disease progression by promoting K48-linked polyubiquitination and degradation of RHBDF2, thereby suppressing MAP3K7 signaling and downstream inflammatory responses [111].
In bone homeostasis and related disorders, E3 ligases and DUBs exhibit precise regulatory functions. Smurf1 and Smurf2 inhibit osteoblast differentiation by targeting Smad1/5 proteins and BMP type I receptors for degradation [113] [114]. Conversely, DUBs such as USP7 and USP10 stabilize key proteins involved in osteoblast differentiation and proliferation, including Axin, KDM6B, and SKP2 [113] [114]. The opposing functions of these enzymes highlight the delicate balance required for maintaining tissue homeostasis and the therapeutic potential of manipulating these regulatory networks.
Experimental Protocols for Target Identification and Validation
The identification and validation of E3 ligases and DUBs as therapeutic targets requires a multidisciplinary approach combining biochemical, cellular, and omics technologies. This section outlines key methodological frameworks for target discovery and validation.
Multi-Omics Integration Protocol for E3-Substrate Mapping
The following protocol outlines a comprehensive approach for identifying E3-substrate regulatory relationships in cancer, adapted from studies that successfully characterized E3 ligase networks in lung squamous cell carcinoma [107]:
Sample Preparation: Collect paired tumor and normal adjacent tissues from patient cohorts. For LSCC analysis, 108 tumor samples and 99 normal samples were processed [107].
Multi-Omics Data Generation:
- Transcriptome profiling: RNA sequencing to quantify gene expression levels
- Proteomic profiling: Liquid chromatography-mass spectrometry (LC-MS/MS) to quantify protein abundance
- Ubiquitylome profiling: Immunoaffinity enrichment of ubiquitinated peptides followed by LC-MS/MS to identify ubiquitination sites
Differential Expression Analysis: Perform statistical comparisons of E3 ligase and DUB expression at transcriptomic and proteomic levels between tumor and normal tissues.
Correlation Mapping: Analyze correlations between E3 ligase expression and both substrate protein abundance and ubiquitination levels to identify significantly altered E3-substrate relationships in cancer.
Functional Validation:
- In vitro models: Manipulate candidate E3 ligase expression (overexpression/knockdown) in cell lines
- Phenotypic assays: Assess proliferation, metastasis, and drug response
- Mechanistic studies: Co-immunoprecipitation to verify E3-substrate interactions; ubiquitination assays to confirm functional relationships
Clinical Correlation: Evaluate associations between E3 ligase expression patterns and clinical outcomes, including overall survival, disease-free survival, and therapeutic response.
Ubiquitin Variant (UbV) Technology for Functional Targeting
Engineered ubiquitin variants (UbVs) represent a powerful tool for targeting specific UPS components. These drug-like proteins serve as valuable reagents for studying biological functions and assisting in the development of small molecule therapeutics [108]. The general workflow for UbV development includes:
Library Construction: Generate combinatorial mutagenesis libraries targeting approximately 30 residues on the ubiquitin surface that interact with USP Ub-binding sites [108].
Phage Display Selection: Screen UbV libraries displayed on phage against target DUBs or E3 ligases to identify high-affinity binders.
Affinity and Specificity Characterization: Measure binding affinity and specificity of selected UbVs using surface plasmon resonance (SPR) or time-resolved Förster resonance energy transfer (TR-FRET).
Structural Analysis: Determine crystal structures of UbV-target complexes to understand binding mechanisms and inform future inhibitor design.
Functional Cellular Assays: Express UbVs in cells to validate target engagement and assess functional consequences on pathway activity and cellular phenotypes.
This approach has successfully generated potent and specific inhibitors for multiple DUBs, including USP2, USP8, USP21, and OTUB1, with affinities in the nanomolar range [108].
Therapeutic Targeting of E3 Ligases and DUBs: From Discovery to Clinical Application
The targeted modulation of E3 ligases and DUBs represents a promising therapeutic strategy for cancer and other diseases. This section compares the principal approaches for developing therapeutics directed against these enzymes.
Small Molecule Inhibitors and Activators
The development of small molecule regulators for E3 ligases and DUBs has accelerated in recent years, with several compounds entering clinical trials. The clinical success of proteasome inhibitors such as Bortezomib demonstrated the therapeutic potential of targeting the UPS, but these agents broadly affect protein degradation without specificity for individual substrates [115]. The current focus has shifted toward developing compounds that target specific components of the ubiquitination cascade to increase treatment specificity and reduce toxicity [115].
Notable examples of small molecule regulators include:
- MLN4924: A NEDD8 activating enzyme (NAE) inhibitor that blocks cullin neddylation and thereby attenuates the activity of cullin RING E3 ligases. This compound is currently being evaluated in phase II clinical trials with promising preliminary results [109].
- CC0651: An allosteric inhibitor of the E2 enzyme CDC34 that was identified through screening for inhibitors of p27KIP1 ubiquitination by SCFSKP2 [109].
- NSC697923: An inhibitor of the UBE2N-UBE2V1 heterodimer, which catalyzes the synthesis of K63-specific poly-ubiquitin chains [109].
The following diagram illustrates key therapeutic targeting strategies within the ubiquitin-proteasome system:
Emerging Therapeutic Modalities
Beyond traditional small molecules, several innovative approaches have emerged for targeting E3 ligases and DUBs:
PROTACs (Proteolysis Targeting Chimeras): These bifunctional molecules recruit E3 ligases to target proteins of interest, leading to their ubiquitination and subsequent degradation [107]. This strategy has gained significant attention as a potential therapeutic avenue for various diseases, including cancer and neurodegenerative disorders [107]. PROTACs leverage the cell's natural degradation machinery to selectively remove disease-causing proteins, including those traditionally considered "undruggable" [109].
Ubiquitin Variants (UbVs): As described in Section 4.2, engineered UbVs represent a promising approach for targeting UPS components [108]. These proteins can be designed to function as either antagonists or agonists of E3 ligase and DUB function, providing valuable tools for both target validation and therapeutic development.
Immunomodulatory Agents: In bladder cancer, E3 ubiquitin ligases have been implicated in regulating immunotherapy response [112]. Targeting these enzymes may enhance the efficacy of immune checkpoint inhibitors by modulating the stability of proteins involved in immune recognition and response.
The Scientist's Toolkit: Essential Research Reagents and Platforms
Advancing research on E3 ligases and DUBs requires specialized reagents and experimental platforms. The following table outlines key resources for investigating these enzymes as therapeutic targets.
Table 3: Essential Research Reagents and Platforms for E3 Ligase and DUB Research
| Reagent/Platform | Function/Application | Key Features | Representative Examples |
|---|---|---|---|
| Multi-omics Datasets | Comprehensive profiling of E3 ligases and DUBs across cancers | Integration of transcriptome, proteome, and ubiquitylome data | CPTAC LSCC Discovery Study (PDC000234) [107] |
| Ubiquitin Variants (UbVs) | Specific inhibition or activation of target DUBs and E3 ligases | High affinity and specificity; structural insights for drug design | UbVs targeting USP2, USP8, USP21, OTUB1 [108] |
| Activity-Based Probes | Profiling DUB activity and specificity in complex proteomes | Covalent modification of active sites; enables comparative activity screening | Not specified in search results |
| Phage Display Libraries | Generation of protein-based binders and inhibitors | Billions of variants; selection for affinity and specificity | UbV libraries with combinatorial mutagenesis [108] |
| PROTAC Molecules | Targeted protein degradation using endogenous E3 ligases | Bifunctional molecules; selective degradation of target proteins | Compounds recruiting E3 ligases to disease-causing proteins [107] [109] |
| Clinical Proteomic Data | Analysis of E3 ligase and DUB expression in patient samples | Tumor-normal pairs; clinical annotation | NCI Proteomic Data Commons (12 cancer types) [107] |
The systematic identification and validation of E3 ligases and DUBs as therapeutic targets has been dramatically advanced by integrated multi-omics approaches. Ubiquitinomics provides unique insights that complement traditional proteomics by directly capturing the post-translational modifications that regulate protein stability and function. The quantitative profiling of these enzymes across cancer types has revealed consistent patterns of dysregulation, including upregulation in tumors and altered substrate specificity.
The experimental frameworks outlined in this review, including multi-omics integration and ubiquitin variant technology, provide robust methodologies for target discovery and validation. As therapeutic modalities continue to evolve beyond traditional small molecules to include PROTACs and other targeted protein degradation strategies, the precise manipulation of E3 ligase activity represents a promising frontier for drug development. The continued integration of ubiquitinomics with other omics technologies will undoubtedly yield novel therapeutic insights and accelerate the development of targeted therapies for cancer and other diseases.
The evolving landscape of cancer biomarker discovery has progressively shifted from single-molecule indicators to multi-analyte signature panels that better reflect disease complexity. Within this context, integrative biomarker panels combining proteomic and ubiquitinomic data represent a transformative approach in oncology research and clinical diagnostics. Proteomics provides a systems-level analysis of protein expression, localization, and interaction, capturing the functional effectors of cellular processes [116]. Ubiquitinomics, a specialized subset of proteomics, focuses specifically on the ubiquitin-proteasome system (UPS)—a crucial post-translational regulatory network that controls protein stability, degradation, and signaling through ubiquitination [5]. While conventional proteomics offers a static snapshot of protein abundance, ubiquitinomics reveals the dynamic regulation of key oncoproteins and tumor suppressors, offering complementary insights into cancer pathogenesis, treatment resistance, and therapeutic targeting opportunities [5].
The integration of these two domains is particularly valuable in addressing tumor heterogeneity and the limitations of current diagnostic approaches. Single-modality biomarkers often lack the sensitivity and specificity required for early detection, prognosis, or predicting treatment response. By combining the breadth of proteomic profiling with the functional depth of ubiquitinomic analysis, researchers can develop multidimensional signatures that more accurately reflect the biological state of tumors and their microenvironment. This integrated approach is advancing personalized oncology by enabling more precise patient stratification and revealing novel therapeutic targets within dysregulated signaling pathways [5].
Technology and Methodological Comparison: Profiling Techniques and Workflows
The development of integrative biomarker panels relies on sophisticated analytical technologies capable of quantifying both protein abundance and ubiquitination status. The following table summarizes the core technologies employed in each domain and their applications in biomarker discovery.
Table 1: Core Analytical Technologies in Proteomic and Ubiquitinomic Biomarker Discovery
| Aspect | Proteomic Technologies | Ubiquitinomic Technologies |
|---|---|---|
| Primary Discovery Tools | Data-Independent Acquisition (DIA) Mass Spectrometry [117], TMT/iTRAQ Multiplexing [116], Aptamer-based Arrays (e.g., SomaScan) [51] [64] | Ubiquitin Remnant Profiling, Immunoaffinity Enrichment of Ubiquitinated Peptides, Proteasome Inhibition Studies [5] |
| Targeted Verification | Parallel Reaction Monitoring (PRM) [117] [116], Enzyme-Linked Immunosorbent Assay (ELISA) [117] | Targeted MS for Ubiquitin Chain Topology, Deubiquitinase (DUB) Activity Assays [5] |
| Key Measured Output | Protein identification and absolute quantification [116] | Identification of ubiquitination sites, ubiquitin chain topology, and E3 ligase/DUB substrate specificity [5] |
| Throughput & Multiplexing | High-throughput; can measure thousands of proteins simultaneously [51] [64] | Moderate throughput; focuses on ubiquitination events of specific protein networks or pathways [5] |
| Clinical Translation Potential | High for protein abundance signatures; several panels in validation (e.g., ColonTrack [117]) | Emerging; potential for companion diagnostics targeting UPS components (e.g., PROTACs) [5] |
Experimental Workflows for Integrated Signature Discovery
A robust, multi-stage workflow is fundamental for discovering and validating integrative biomarkers. The process typically follows a phased approach that narrows down from broad discovery to focused clinical validation.
Diagram 1: Integrated Biomarker Discovery Workflow
The workflow initiates with sample collection and preparation, where the choice of sample type (e.g., plasma versus serum) can significantly impact results due to differences in protein and ubiquitinome content [116]. The discovery phase then employs parallel proteomic and ubiquitinomic profiling. For proteomics, Data-Independent Acquisition (DIA) mass spectrometry is widely used for its deep, reproducible coverage of complex proteomes, as demonstrated in studies identifying extracellular vesicle (EV) protein biomarkers for colorectal cancer [117]. Alternatively, aptamer-based technologies like SomaScan allow for highly multiplexed quantification of thousands of proteins in small sample volumes [51] [64]. Concurrently, ubiquitinomic profiling typically involves enrichment strategies for ubiquitinated peptides, followed by MS analysis to identify specific ubiquitination sites and their relative abundance [5].
The subsequent integration of these massive datasets relies heavily on bioinformatic pipelines and machine learning algorithms. For instance, the Random Forest algorithm has been successfully applied to proteomic data to predict residual disease in ovarian cancer [118] and to build diagnostic models like the ColonTrack panel for early-stage colorectal cancer [117]. These computational tools identify the most informative features from both datasets, leading to a shortlist of candidate biomarkers for verification. This phase employs targeted, highly precise methods like Parallel Reaction Monitoring (PRM) mass spectrometry or immunoassays to confirm the differential abundance or modification of candidates in a larger sample set [117] [116]. The final and most rigorous stage is clinical validation in large, independent cohorts to assess the panel's diagnostic, prognostic, or predictive performance in a real-world setting.
Key Research and Clinical Applications: Integrated Panels in Action
Case Study: Proteomic Biomarker Panel for Colorectal Cancer (ColonTrack)
A prime example of a successful proteomic biomarker panel is the ColonTrack model for early detection of colorectal cancer (CRC). This model was developed through a rigorous workflow integrating mass spectrometry-based discovery and verification with ELISA-based validation across a large cohort of 1,272 individuals [117]. The study uniquely integrated proteomic profiling of extracellular vesicles (EVs) from both tumor tissue and plasma, leading to a final model based on three key EV proteins: HNRNPK, CTTN, and PSMC6 [117].
Table 2: Performance Metrics of the ColonTrack Proteomic Biomarker Panel
| Performance Metric | Result | Context and Significance |
|---|---|---|
| Area Under the Curve (AUC) | >0.97 [117] | Indicates exceptional ability to distinguish CRC from non-CRC cases. |
| Sensitivity | ~0.94 [117] | High probability of correctly identifying individuals with CRC. |
| Specificity | ~0.93 [117] | High probability of correctly identifying individuals without CRC. |
| Key Application | Early-stage CRC identification [117] | Addresses the critical need for detecting cancer at its most treatable stages. |
| Comparative Performance | Outperformed mSeptin-9 for early-stage CRC diagnosis [117] | Demonstrates superiority over an existing standard. |
The ColonTrack model highlights how a focused panel of proteins, derived from a systematic, large-scale discovery process, can achieve high accuracy for non-invasive early cancer detection, a significant advancement over traditional methods like colonoscopy or fecal tests which can be invasive, costly, or lack specificity [117].
Ubiquitinomic Signatures and Therapeutic Targeting in NSCLC
In Non-Small Cell Lung Cancer (NSCLC), ubiquitinomic studies have revealed critical dysregulations that drive tumor progression and present novel therapeutic opportunities. Unlike broad proteomic panels, ubiquitinomics often focuses on specific, dysregulated nodes within the ubiquitin-proteasome system. A key insight is the dynamic balance between ubiquitination (mediated by E3 ligases) and deubiquitination (mediated by Deubiquitinating Enzymes, or DUBs) that controls the stability of oncoproteins and tumor suppressors [5].
For instance, the stability of the epidermal growth factor receptor (EGFR), a major oncoprotein in NSCLC, is regulated by multiple UPS components. The WDR4-Cul4 complex inhibits EGFR degradation, promoting tumorigenesis, while USP22 acts as a stabilizer of EGFR, contributing to resistance against EGFR-targeted therapies [5]. Conversely, the miR-4487/USP37 axis promotes EGFR ubiquitination and degradation [5]. Beyond EGFR, the ubiquitinome regulates other critical pathways. In KRAS-mutant NSCLC, the deubiquitinase USP5 stabilizes Beclin1 to promote autophagy and p53 degradation, while OTUD7B is a critical modulator of mTORC2 complexes, whose suppression inhibits KRAS-driven tumor growth [5]. Furthermore, immune evasion is regulated by UPS components like USP8, which controls PD-L1 stability, suggesting that its inhibition could reverse T-cell exhaustion [5].
These ubiquitinomic insights are directly translated into novel therapeutic strategies, most notably Proteolysis-Targeting Chimeras (PROTACs). PROTACs are heterobifunctional molecules that recruit E3 ligases to target specific oncoproteins for degradation, offering a powerful approach to drug resistant cancers [5]. The integration of ubiquitinomic data thus not only provides biomarker signatures but also directly informs the development of targeted therapies and mechanisms to overcome treatment resistance.
The Scientist's Toolkit: Essential Reagents and Research Solutions
The experiments and studies cited rely on a suite of specialized reagents and tools. The following table details key solutions required for research in integrative proteomic and ubiquitinomic biomarker discovery.
Table 3: Essential Research Reagent Solutions for Integrative Biomarker Studies
| Research Solution | Function and Application | Example Use Case |
|---|---|---|
| Solid Support CPG Functionalized with Bait Oligos | A functionalized glass support used in affinity purification to isolate specific protein binders from complex lysates. | Used with a telomeric G-quadruplex (tel46) model to fish out interacting proteins from nuclear extracts for biomarker discovery [119]. |
| Chemically Modified Aptamer Libraries | Libraries of single-stranded DNA/RNA oligonucleotides with modified nucleotides that increase structural diversity and binding affinity for proteins. | Enable highly multiplexed proteomic assays (e.g., SomaScan) for biomarker discovery from small volume plasma/serum samples [51] [64]. |
| Proteasome Inhibitors (e.g., Bortezomib) | Small molecules that inhibit the activity of the proteasome, leading to the accumulation of ubiquitinated proteins. | Used to study ubiquitination dynamics and to validate UPS targets in preclinical models [5]. |
| High-Sensitivity Immunoassay Kits (ELISA) | Antibody-based kits for the quantitative detection of specific target proteins in biological fluids. | Used for the clinical validation of candidate protein biomarkers in large patient cohorts [117]. |
| Phosphoramidite Chemistry Reagents | Standard reagents for the automated synthesis of custom oligonucleotides on solid supports. | Essential for producing functionalized CPG supports and aptamer sequences used in fishing and detection assays [119]. |
Integrated Data Interpretation: Pathway and Logical Mapping
The true power of integrative biomarker panels emerges from synthesizing proteomic and ubiquitinomic data into a coherent model of disease biology. The following diagram illustrates the logical relationship between the two data types and how they converge to form a comprehensive biological understanding.
Diagram 2: Data Integration Logic Flow
This integrative model shows that proteomic data, which reflects the steady-state abundance of proteins, and ubiquitinomic data, which reflects the dynamic regulation of a key subset of those proteins, are fused via machine learning. This fusion generates superior biological insight, enabling two primary applications: robust clinical biomarker panels and the identification of novel, actionable therapeutic targets within the ubiquitin-proteasome system and related pathways.
A concrete example of this is seen in NSCLC, where integrating different types of data elucidates complete oncogenic pathways. For example, a single pathway analysis can show how a specific E3 ligase or DUB regulates a key driver protein like EGFR, which in turn activates downstream signaling cascades such as ERK, influencing cell proliferation and survival. The diagram below maps this specific signaling pathway to illustrate how ubiquitinomic events drive proteomic outputs that define cancer phenotypes.
Diagram 3: Ubiquitin-Proteasome Regulation of Oncogenic Signaling
The integration of proteomic and ubiquitinomic data represents a powerful, synergistic approach for advancing cancer biomarker discovery and therapeutic development. Proteomics offers a broad-scale view of the functional effectors within a cell or tissue, while ubiquitinomics provides a deep, mechanistic understanding of the critical post-translational system that regulates their stability and activity. As evidenced by the ColonTrack model in CRC and the elucidation of UPS networks in NSCLC, combining these perspectives yields biomarker panels with superior diagnostic accuracy and provides a direct path to identifying novel therapeutic targets, such as those for PROTACs [117] [5].
The future of this integrated field will be driven by continued technological advancements in mass spectrometry, multiplexed affinity-based assays, and artificial intelligence for data fusion and pattern recognition. Standardizing workflows and validating these multi-omic panels in large, diverse clinical cohorts will be the critical next step for translation into routine clinical practice. By moving beyond single-analyte biomarkers, integrative proteomic and ubiquitinomic signatures are poised to significantly enhance the precision of cancer diagnosis, prognosis, and treatment selection, ultimately paving the way for more personalized and effective oncology care.
Conclusion
The integration of ubiquitinomics and proteomics represents a paradigm shift in cancer biomarker discovery, moving beyond static protein inventories to dynamic, functional understanding of tumor pathophysiology. While traditional proteomics provides essential comprehensive protein expression profiles, ubiquitinomics offers unprecedented insight into the regulatory mechanisms controlling protein stability, localization, and activity—often more directly reflecting cancer driver events. The future of precision oncology lies in multi-omics approaches that combine these technologies to address tumor heterogeneity, enable early detection through liquid biopsies, and identify novel therapeutic targets within the ubiquitin-proteasome system. As methodological advancements continue to improve sensitivity, throughput, and clinical translation, researchers and drug developers are poised to deliver biomarkers that truly reflect the functional state of cancer cells, ultimately enabling more precise diagnosis, stratification, and personalized treatment strategies for cancer patients.
References
- 1. and metabolomics in Proteomics cancer biomarker discovery [https://pubmed.ncbi.nlm.nih.gov/41033718/]
- 2. sciencedirect.com/topics/earth-and-planetary-sciences/ proteomics [https://www.sciencedirect.com/topics/earth-and-planetary-sciences/proteomics]
- 3. approaches to study Proteomic - PMC ubiquitinomics [https://pmc.ncbi.nlm.nih.gov/articles/PMC10612121/]
- 4. Proteomic analysis of degradation ubiquitin signaling by ubiquitin occupancy changes responding to 26S proteasome inhibition | Clinical Proteomics | Full Text [https://clinicalproteomicsjournal.biomedcentral.com/articles/10.1186/s12014-020-9265-x]
- 5. Mechanistic Insights and Therapeutic Potentials of Ubiquitin‐Proteasome System in Non‐Small Cell Lung Cancer - PMC [https://pmc.ncbi.nlm.nih.gov/articles/PMC12240642/]
- 6. Frontiers | ITRAQ and PRM-based quantitative saliva proteomics in... [https://www.frontiersin.org/journals/molecular-biosciences/articles/10.3389/fmolb.2025.1640508/full]
- 7. via Targeted Profiling of Multiclass... Cancer Biomarker Discovery [https://clinicalproteomicsjournal.biomedcentral.com/articles/10.1007/s12014-009-9037-0]
- 8. Scaling Proteomics for Precision Health Breakthroughs | The Scientist [https://www.the-scientist.com/scaling-proteomics-for-precision-health-breakthroughs-73526]
- 9. Transcriptomics-based exploration of ubiquitination-related biomarkers and potential molecular mechanisms in laryngeal squamous cell carcinoma | BMC Medical Genomics | Full Text [https://bmcmedgenomics.biomedcentral.com/articles/10.1186/s12920-025-02148-x]
- 10. Targeting the ubiquitin-proteasome system for cancer treatment: discovering novel inhibitors from nature and drug repurposing - PMC [https://pmc.ncbi.nlm.nih.gov/articles/PMC5722705/]
- 11. Targeting the Ubiquitin–Proteasome System for Cancer - PMC [https://pmc.ncbi.nlm.nih.gov/articles/PMC12495026/]
- 12. The Ubiquitin - Proteasome and Epigenetic Modifications in... Pathway [https://pubmed.ncbi.nlm.nih.gov/32781973/]
- 13. Comprehensive characterization of ubiquitinome of human colorectal... [https://translational-medicine.biomedcentral.com/articles/10.1186/s12967-022-03645-8]
- 14. - Ubiquitin -linked Gene Signatures as... proteasome Pathway [https://ar.iiarjournals.org/content/45/5/1825]
- 15. Over-expression of genes and proteins of ubiquitin specific... [https://pubmed.ncbi.nlm.nih.gov/17004105/]
- 16. Unbiased mapping of cereblon neosubstrate... | Nature Communications [https://www.nature.com/articles/s41467-025-62829-0?error=cookies_not_supported&code=a210e1d7-dbe7-48c2-9c31-1fdadaf33349]
- 17. Frontiers | Current successes and remaining challenges in protein ... [https://www.frontiersin.org/journals/bioinformatics/articles/10.3389/fbinf.2023.1222182/full]
- 18. Frontiers | Application of Proteomics in Cancer : Recent Trends and... [https://www.frontiersin.org/journals/medicine/articles/10.3389/fmed.2021.747333/full]
- 19. Mutation Impact on mRNA Versus across Human... Protein Expression [https://pmc.ncbi.nlm.nih.gov/articles/PMC10680725/]
- 20. Integrated proteotranscriptomics of breast cancer reveals globally... [https://genomemedicine.biomedcentral.com/articles/10.1186/s13073-018-0602-x]
- 21. and Protein Ubiquitination in Degradation Cancer [https://www.creative-proteomics.com/resource/ubiquitination-protein-degradation-in-cancer.htm]
- 22. Frequent mutations in acetylation and ubiquitination sites suggest... [https://genomemedicine.biomedcentral.com/articles/10.1186/s13073-016-0311-2]
- 23. Label-free quantitative identification of abnormally ubiquitinated... [https://link.springer.com/article/10.1007/s13167-019-00197-8]
- 24. A new scheme to discover functional associations and regulatory networks of E3 ubiquitin ligases | BMC Systems Biology | Full Text [https://bmcsystbiol.biomedcentral.com/articles/10.1186/s12918-015-0244-1]
- 25. Frontiers | Visualizing K48 Ubiquitination during Presynaptic ... [https://www.frontiersin.org/articles/10.3389/fnmol.2016.00043/full]
- 26. World Cancer Day: trends in cancer therapeutics to look forward to in 2025 [https://www.labiotech.eu/in-depth/oncology-trends-2025/]
- 27. Cancer biomarker discovery and validation - Goossens - Translational Cancer Research [https://tcr.amegroups.org/article/view/4536/html]
- 28. Cancer Biomarkers - Emerging Trends and Clinical Implications for personalized treatment - PMC [https://pmc.ncbi.nlm.nih.gov/articles/PMC7616034/]
- 29. Translation of proteomic biomarkers into FDA approved cancer diagnostics: issues and challenges | Clinical Proteomics | Full Text [https://clinicalproteomicsjournal.biomedcentral.com/articles/10.1186/1559-0275-10-13]
- 30. Biomarker Discovery and Validation: Statistical Considerations - PMC [https://pmc.ncbi.nlm.nih.gov/articles/PMC8012218/]
- 31. Biomarker discovery and validation: Bridging research and clinical application | Abcam [https://www.abcam.com/en-us/knowledge-center/immunology-and-infectious-disease/biomarker-discovery-and-validation]
- 32. Cancer Biomarkers: Reflection on Recent Progress, Emerging Innovations, and the Clinical Horizon - PMC [https://pmc.ncbi.nlm.nih.gov/articles/PMC12468363/]
- 33. Differences Between DIA , TMT / iTRAQ , And... - Creative Proteomics [https://www.creative-proteomics.com/ngpro/resource-differences-dia-tmt-label-free.html]
- 34. Cancer biomarker discovery and translation: proteomics and beyond - PMC [https://pmc.ncbi.nlm.nih.gov/articles/PMC6635916/]
- 35. Frontiers | Ubiquitination-mediated molecular pathway alterations in human lung squamous cell carcinomas identified by quantitative ubiquitinomics [https://www.frontiersin.org/journals/endocrinology/articles/10.3389/fendo.2022.970843/full]
- 36. in iTRAQ : Principles, Differences... - Creative Proteomics Proteomics [https://www.creative-proteomics.com/resource/understanding-itrack-proteomics-principles-applications.htm]
- 37. Mass Spec Workflow Comparison Shows DIA, TMT Largely Comparable | GenomeWeb [https://www.genomeweb.com/proteomics-protein-research/mass-spec-workflow-comparison-shows-dia-tmt-largely-comparable]
- 38. Frontiers | Recent Developments in Data Independent Acquisition ( DIA )... [https://www.frontiersin.org/journals/molecular-neuroscience/articles/10.3389/fnmol.2020.564446/full]
- 39. vs. TMT : Which Method Reigns Supreme in... - MetwareBio DIA [https://www.metwarebio.com/tmt-vs-dia-quantitative-proteomics/]
- 40. Reproducible workflow for multiplexed deep-scale proteome and phosphoproteome analysis of tumor tissues by liquid chromatography–mass spectrometry | Nature Protocols [https://www.nature.com/articles/s41596-018-0006-9]
- 41. Choosing the Right Proteomics Data Analysis Software... - MetwareBio [https://www.metwarebio.com/proteomics-software-comparison-lc-msms-lfq-tmt-silac-dia/]
- 42. Proteomic approaches to study ubiquitinomics - ScienceDirect [https://www.sciencedirect.com/science/article/abs/pii/S1874939923000354]
- 43. Current methodologies in protein ubiquitination characterization: from ubiquitinated protein to ubiquitin chain architecture | Cell & Bioscience | Full Text [https://cellandbioscience.biomedcentral.com/articles/10.1186/s13578-022-00870-y]
- 44. Ubiquitin becomes ubiquitous in cancer: Emerging roles of ubiquitin ligases and deubiquitinases in tumorigenesis and as therapeutic targets [https://www.ncbi.nlm.nih.gov/pmc/articles/PMC3023568/]
- 45. Refined Preparation and Use of Anti-diglycine Remnant (K-ε-GG) Antibody Enables Routine Quantification of 10,000s of Ubiquitination Sites in Single Proteomics Experiments - PMC [https://pmc.ncbi.nlm.nih.gov/articles/PMC3591673/]
- 46. Refined preparation and use of anti-diglycine remnant ( K - ε - GG )... [https://pubmed.ncbi.nlm.nih.gov/23266961/]
- 47. Ubiquitin Remnant Motif (K-Epsilon-GG) Polyclonal Antibody (PA5-120707) [https://www.thermofisher.com/antibody/product/Ubiquitin-Remnant-Motif-K-Epsilon-GG-Antibody-Polyclonal/PA5-120707]
- 48. What is Olink Proteomics? | Source Genomics [https://sourcebioscience.com/what-is-olink-proteomics/]
- 49. Proteomics technologies for cancer liquid biopsies | Molecular Cancer | Full Text [https://molecular-cancer.biomedcentral.com/articles/10.1186/s12943-022-01526-8]
- 50. Assessment of variability in the plasma 7k SomaScan assay proteomics [https://www.nature.com/articles/s41598-022-22116-0?error=cookies_not_supported&code=66418f6a-06d1-4bf8-b4a4-d3f4f621b04d]
- 51. The application of Aptamer in biomarker discovery | Biomarker Research [https://biomarkerres.biomedcentral.com/articles/10.1186/s40364-023-00510-8]
- 52. SomaScan® Assay: The Only Proteomic Approach that Scales with Precision - SomaLogic [https://somalogic.com/somascan-unique-scale/]
- 53. Evaluation of two high-throughput proteomic technologies for plasma biomarker discovery in immunotherapy-treated melanoma patients | Biomarker Research | Full Text [https://biomarkerres.biomedcentral.com/articles/10.1186/s40364-017-0112-9]
- 54. Proteomics Services | GENEWIZ from Azenta [https://www.genewiz.com/public/services/next-generation-sequencing/proteomics]
- 55. Targeted proteomics-derived biomarker profile develops a multi-protein classifier in liquid biopsies for early detection of esophageal squamous cell carcinoma from a population-based case-control study | Biomarker Research | Full Text [https://biomarkerres.biomedcentral.com/articles/10.1186/s40364-021-00266-z]
- 56. Synergistic insights into human health from aptamer - and... [https://www.nature.com/articles/s41467-021-27164-0?error=cookies_not_supported&code=484388d9-3739-4638-8c26-12358ebf4573]
- 57. Comparative analysis of Alzheimer’s disease Cerebrospinal fluid... [https://pmc.ncbi.nlm.nih.gov/articles/PMC9562128/]
- 58. Recent advances in mass spectrometry based clinical proteomics ... [https://clinicalproteomicsjournal.biomedcentral.com/articles/10.1186/s12014-020-09283-w]
- 59. : current impact... | Nature Reviews Cancer proteogenomics Cancer [https://www.nature.com/articles/s41568-022-00446-5?error=cookies_not_supported&code=67ee562a-1d4d-4e71-8480-eeab30638b2b]
- 60. Deciphering Cancer Complexity: Integrative and... Proteogenomics [https://pubmed.ncbi.nlm.nih.gov/39436604/]
- 61. Advancements in proteogenomics for preclinical targeted cancer ... [https://pmc.ncbi.nlm.nih.gov/articles/PMC11891078/]
- 62. Proteogenomics Reveals Resistance Biomarkers - NCI [https://dctd.cancer.gov/about/news-events/news/2025-news/proteogenomic-biomarkers-her2]
- 63. Frontiers | Multi-omics approaches for biomarker and... discovery [https://www.frontiersin.org/journals/endocrinology/articles/10.3389/fendo.2025.1520436/full]
- 64. Aptamer-based multiplexed proteomic technology for biomarker ... [https://pubmed.ncbi.nlm.nih.gov/21165148/]
- 65. offers new hope for early Liquid biopsy cancer detection [https://www.news-medical.net/news/20250422/Liquid-biopsy-offers-new-hope-for-early-cancer-detection.aspx]
- 66. Liquid biopsy in cancer: current status, challenges and future prospects | Signal Transduction and Targeted Therapy [https://www.nature.com/articles/s41392-024-02021-w]
- 67. Liquid biopsy entering clinical practice: Past discoveries, current insights, and future innovations - ScienceDirect [https://www.sciencedirect.com/science/article/abs/pii/S1040842825000010]
- 68. Frontiers | Clinical utility of various liquid biopsy samples for the early detection of ovarian cancer: a comprehensive review [https://www.frontiersin.org/journals/oncology/articles/10.3389/fonc.2025.1594100/full]
- 69. Cancer in a Drop: Liquid biopsy insights from AACR 2025 - PMC [https://pmc.ncbi.nlm.nih.gov/articles/PMC12223554/]
- 70. Frontiers | Spatial of the proteomics microenvironment in... tumor [https://www.frontiersin.org/journals/immunology/articles/10.3389/fimmu.2025.1568456/full]
- 71. A review of the current state of single-cell proteomics and future perspective | Analytical and Bioanalytical Chemistry [https://link.springer.com/article/10.1007/s00216-023-04759-8]
- 72. Multimodal single -resolved cell reveal pancreatic... spatial proteomics [https://www.nature.com/articles/s41467-024-54438-0?error=cookies_not_supported&code=0dc03047-0be6-489f-be3f-450bb5e9789e]
- 73. High Abundance Proteins Depletion vs Low Proteins... Abundance [https://pmc.ncbi.nlm.nih.gov/articles/PMC3087803/]
- 74. High Abundance Proteins Depletion vs Low Abundance Proteins Enrichment: Comparison of Methods to Reduce the Plasma Proteome Complexity | PLOS One [https://journals.plos.org/plosone/article?id=10.1371/journal.pone.0019603]
- 75. Comparison of Depletion Strategies for the Enrichment of Low-Abundance Proteins in Urine | PLOS One [https://journals.plos.org/plosone/article?id=10.1371/journal.pone.0133773]
- 76. (PDF) High Abundance Proteins Depletion vs Low ... Abundance [https://www.academia.edu/13210635/High_Abundance_Proteins_Depletion_vs_Low_Abundance_Proteins_Enrichment_Comparison_of_Methods_to_Reduce_the_Plasma_Proteome_Complexity]
- 77. A cross-species proteomic assessment of cost-effective platforms for... [https://bmcmethods.biomedcentral.com/articles/10.1186/s44330-025-00042-7]
- 78. Sample preparation for detection of low abundance proteins in human plasma using ultra-high performance liquid chromatography coupled with highly accurate mass spectrometry - PubMed [https://pubmed.ncbi.nlm.nih.gov/28649027/]
- 79. Cancer biomarker discovery and translation: proteomics and beyond - PubMed [https://pubmed.ncbi.nlm.nih.gov/30556752/]
- 80. and Interpretation of Protein Post-Translational Modification... Analysis [https://pubmed.ncbi.nlm.nih.gov/31296352/]
- 81. Absolute Quantification (AQUA) Service - Creative Proteomics [https://www.creative-proteomics.com/services/absolute-quantification-aqua-2.htm]
- 82. Ubiquitomics: An Overview and Future - PMC [https://pmc.ncbi.nlm.nih.gov/articles/PMC7603029/]
- 83. Increasing the reproducibility of fluid biomarker studies in neurodegenerative studies | Nature Communications [https://www.nature.com/articles/s41467-020-19957-6]
- 84. Metastatic Biomarker Through Discovery | Proteomics ... Cancer [https://cgp.iiarjournals.org/content/9/6/345?ijkey=e39dd9f999b8e9f80e8a5858f76b8cedbd808803&keytype2=tf_ipsecsha]
- 85. Workflow comparison for label-free, quantitative secretome... [https://pubmed.ncbi.nlm.nih.gov/20085282/]
- 86. Challenges in Lipidomics Biomarker Identification: Avoiding the Pitfalls and Improving Reproducibility - PMC [https://pmc.ncbi.nlm.nih.gov/articles/PMC11356033/]
- 87. A computational solution to improve biomarker reproducibility during long-term projects | PLOS One [https://journals.plos.org/plosone/article?id=10.1371/journal.pone.0209060]
- 88. Integrated meta-analysis of colorectal cancer public proteomic ... [https://journals.plos.org/ploscompbiol/article?id=10.1371/journal.pcbi.1011828]
- 89. approaches to study Proteomic ubiquitinomics [https://pubmed.ncbi.nlm.nih.gov/37121501/]
- 90. Multi-Omics Integration for the Design of Novel Therapies and the Identification of Novel Biomarkers - PMC [https://pmc.ncbi.nlm.nih.gov/articles/PMC10594525/]
- 91. Multi-omics data integration using ratio-based quantitative profiling with Quartet reference materials | Nature Biotechnology [https://www.nature.com/articles/s41587-023-01934-1]
- 92. Integrating Molecular Perspectives: Strategies for Comprehensive Multi-Omics Integrative Data Analysis and Machine Learning Applications in Transcriptomics, Proteomics, and Metabolomics [https://www.mdpi.com/2079-7737/13/11/848]
- 93. Frontiers | Quantitative Analysis of Ubiquitinated Proteins in Human Pituitary and Pituitary Adenoma Tissues [https://www.frontiersin.org/journals/endocrinology/articles/10.3389/fendo.2019.00328/full]
- 94. Mass spectrometry based , verification, and... biomarker discovery [https://pmc.ncbi.nlm.nih.gov/articles/PMC5528535/]
- 95. Selected reaction monitoring ( SRM ) mass spectrometry without isotope... [https://pmc.ncbi.nlm.nih.gov/articles/PMC4121859/]
- 96. Clinical proteomics for prostate cancer : understanding prostate... [https://clinicalproteomicsjournal.biomedcentral.com/articles/10.1186/s12014-020-09305-7]
- 97. Multiple Reaction Monitoring - an overview | ScienceDirect Topics [https://www.sciencedirect.com/topics/medicine-and-dentistry/multiple-reaction-monitoring]
- 98. Selected reaction monitoring - Wikipedia [https://en.wikipedia.org/wiki/Selected_reaction_monitoring]
- 99. SRM & MRM Analysis Service - Creative Proteomics [https://www.creative-proteomics.com/services/srm-mrm.htm]
- 100. Ubiquitinated Proteomics Analysis Service - Creative Proteomics [https://www.creative-proteomics.com/services/ubiquitination-2.htm]
- 101. Protein Degradation Through Ubiquitination: Insights into... | Preprints.org [https://www.preprints.org/manuscript/202504.2585/v1]
- 102. Time-resolved in vivo ubiquitinome profiling by DIA-MS reveals USP7 targets on a proteome-wide scale | Nature Communications [https://www.nature.com/articles/s41467-021-25454-1]
- 103. Frontiers | Multi-omics analysis identifies UBA family as potential... [https://www.frontiersin.org/journals/immunology/articles/10.3389/fimmu.2025.1510503/full]
- 104. Visualization analysis of breast cancer-related ubiquitination modifications over the past two decades | Discover Oncology [https://link.springer.com/article/10.1007/s12672-025-02032-1]
- 105. The Oncology Biomarker ... | Nature Communications Discovery [https://www.nature.com/articles/s41467-023-41011-4?error=cookies_not_supported&code=dc7a7a4c-ecc1-4a27-b46f-794d0617943f]
- 106. Emerging biomarkers for early cancer detection and diagnosis... [https://eurjmedres.biomedcentral.com/articles/10.1186/s40001-025-03003-6]
- 107. Multi-Omics Characterization of E Regulatory Patterns in Different... 3 [https://pmc.ncbi.nlm.nih.gov/articles/PMC11276688/]
- 108. Specific targeting of the deubiquitinase and E3 ligase families with engineered ubiquitin variants - PMC [https://pmc.ncbi.nlm.nih.gov/articles/PMC5434665/]
- 109. Drugging the undruggables: exploring the ubiquitin system for drug development | Cell Research [https://www.nature.com/articles/cr201631]
- 110. Dynamic ubiquitination networks in liver cancer : decoding E ... 3 ligases [https://pubmed.ncbi.nlm.nih.gov/40684404/]
- 111. The emerging role of E ubiquitin 3 and ligases in... deubiquitinases [https://translational-medicine.biomedcentral.com/articles/10.1186/s12967-025-06255-2]
- 112. The role of E3 ubiquitin ligases and deubiquitinases in bladder cancer development and immunotherapy - PubMed [https://pubmed.ncbi.nlm.nih.gov/37215134/]
- 113. Regulatory Roles of E3 Ubiquitin Ligases and Deubiquitinases in Bone [https://www.mdpi.com/2218-273X/15/5/679]
- 114. Regulatory Roles of E3 Ubiquitin Ligases and Deubiquitinases in Bone - PMC [https://pmc.ncbi.nlm.nih.gov/articles/PMC12108743/]
- 115. Screening for E3-Ubiquitin ligase inhibitors: challenges and opportunities | Oncotarget [https://www.oncotarget.com/article/2431/text/]
- 116. : A Quantitative... - MetwareBio Proteomics Biomarker Discovery [https://www.metwarebio.com/proteomics-biomarker-discovery-workflow/]
- 117. profiling of tumor and plasma extracellular... Integrative proteomic [https://pmc.ncbi.nlm.nih.gov/articles/PMC12147850/]
- 118. Frontiers | Proteomic alterations in ovarian cancer —Predicting... [https://www.frontiersin.org/journals/medicine/articles/10.3389/fmed.2025.1562558/full]
- 119. and bioinformatics for the identification of... Integrating proteomics [https://cancerci.biomedcentral.com/articles/10.1186/s12935-025-03955-z]